Inventory ABC Analysis: How to Prioritize Your SKUs
You Are Probably Treating All Your SKUs the Same. Stop.
I used to review every SKU in my catalog with the same attention. Weekly forecast check, safety stock review, supplier lead time update. All 180 of them. It took hours and I was still stocking out on my top sellers because by the time I got to them, I had burned my energy on products that generated $12/month in revenue.
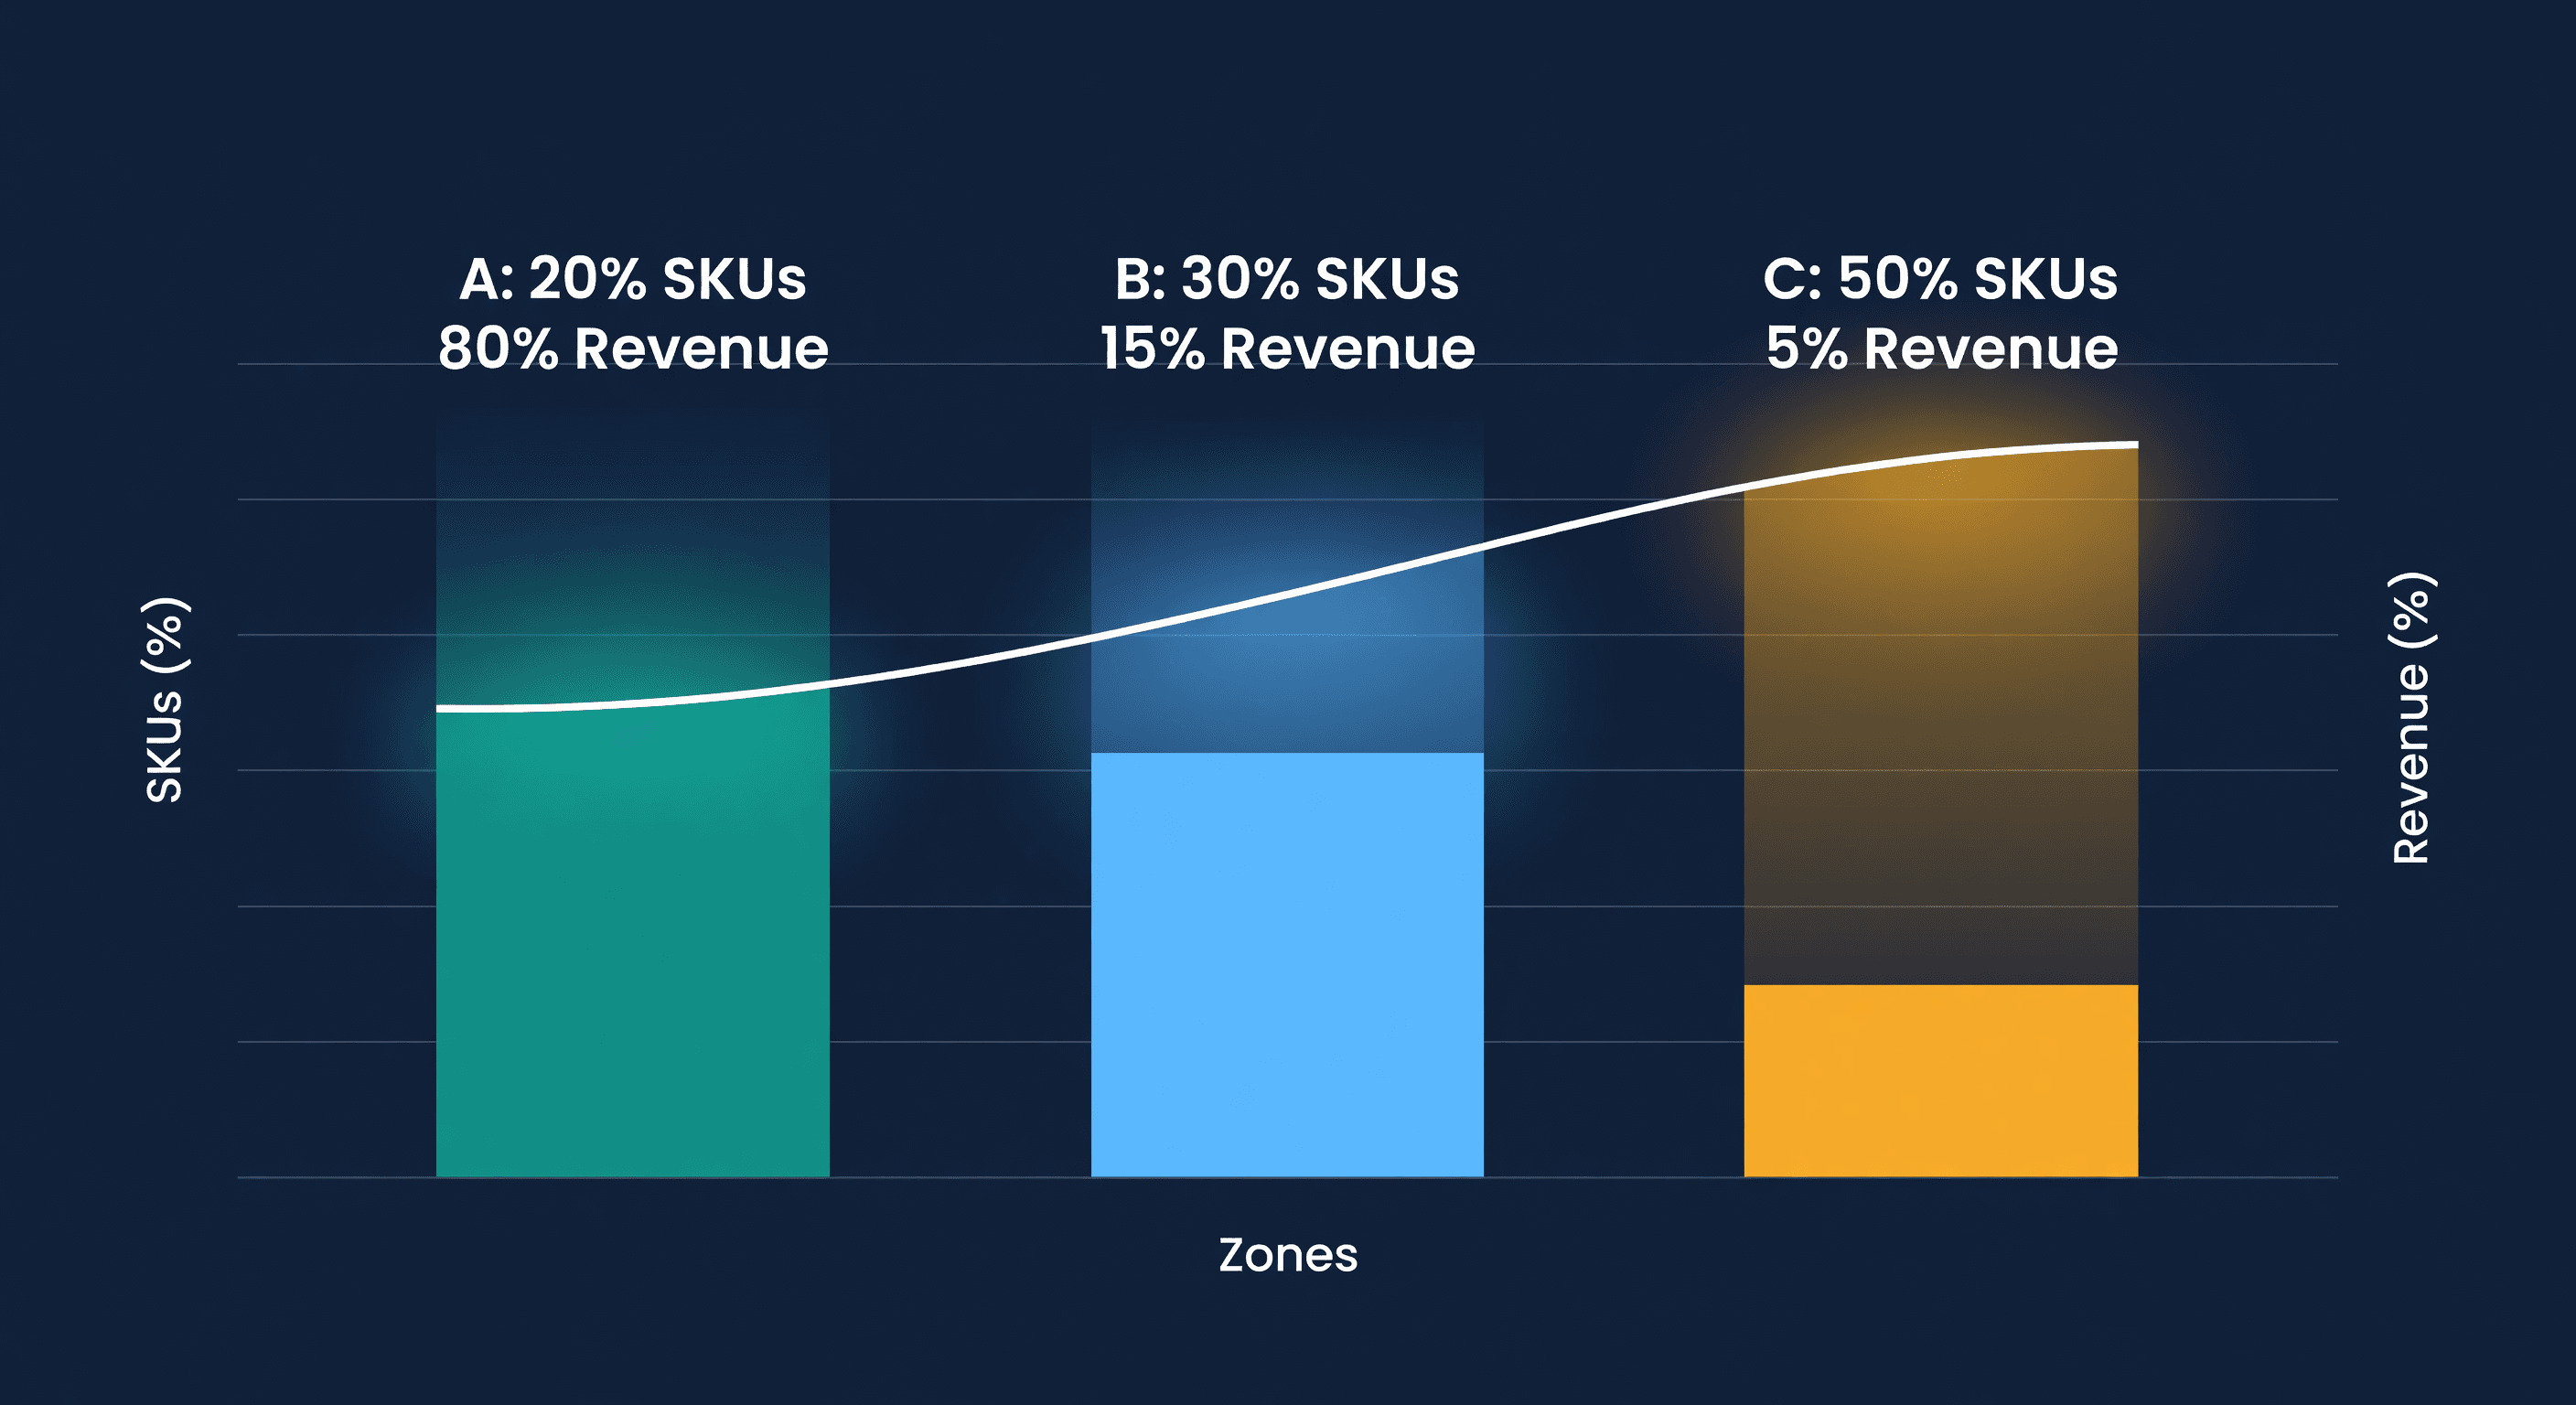
ABC analysis fixed that. The idea comes from the Pareto principle: roughly 20% of your products generate 80% of your revenue. Those are your A items, and they deserve most of your attention. The other 80% of SKUs? They matter, but not equally.
The Three Categories
A Items -- Your Money Makers. Top 10-20% of SKUs generating 70-80% of revenue. A stockout here is a financial emergency. Forecast these weekly, keep safety stock high, and monitor daily. If you only have time to look at one thing, look at your A items.
B Items -- The Middle. Next 20-30% of SKUs, generating 15-25% of revenue. These need regular monitoring but not obsessive attention. Forecast monthly, keep moderate safety stock, review weekly.
C Items -- The Long Tail. The remaining 50-70% of SKUs, generating only 5-10% of revenue. An occasional stockout on a C item is annoying but not damaging. Forecast quarterly, keep minimal safety stock, and order in bulk when possible to reduce ordering cost.
The insight is not that C items do not matter. It is that spending equal effort on all three categories is wasteful. Focus where the dollars are.
How to Run ABC Analysis (Step by Step)
Step 1: Pull Your Data
Export from Shopify or Amazon:
- SKU identifier
- Units sold (last 90 days)
- Revenue generated
- Current inventory value
Step 2: Calculate Revenue per SKU
Annual Revenue = Units Sold × Selling Price
Sort from highest to lowest revenue. This list tells you a lot by itself.
Step 3: Calculate Cumulative Percentage
For each SKU, calculate its individual contribution percentage and the running cumulative total. Your top SKU might be 12% of revenue. By the time you hit SKU #20, you might be at 75%.
Step 4: Draw the Lines
| Cumulative Revenue | Category |
|---|---|
| 0-80% | A |
| 80-95% | B |
| 95-100% | C |
Step 5: Apply Different Rules
This is where ABC analysis earns its keep. Stop treating every SKU the same:
| Category | Safety Stock | Review Frequency | Stockout Tolerance |
|---|---|---|---|
| A | 2-4 weeks | Daily/Weekly | Zero |
| B | 1-2 weeks | Weekly/Biweekly | Low |
| C | 1 week or less | Monthly | Acceptable |
I ran these numbers on a 200-SKU catalog and found that 22 SKUs (11%) generated 78% of revenue. Those 22 products got daily attention. The other 178 got monthly check-ins. Stockout rate on A items dropped from 8% to under 1%. Total time spent on inventory planning went down 40%.
ABC Analysis for Multi-Channel Sellers
If you sell on both Shopify and Amazon, run ABC analysis three ways:
- Per channel -- your Amazon bestsellers and Shopify bestsellers are often different products
- Combined -- overall business prioritization for purchasing decisions
- By location -- FBA vs. warehouse performance may tell you different stories
A product selling 50 units/day on Amazon but 2/day on Shopify is an A-item on Amazon and a C-item on Shopify. Your FBA restock priority should reflect the Amazon classification, while your Shopify safety stock follows the Shopify one.
Four Mistakes That Break ABC Analysis
Using units instead of revenue. A product selling 1,000 units at $3 each generates less revenue than one selling 50 units at $80. Revenue-based ranking catches this. Unit-based ranking does not. Always rank by revenue or gross margin.
Never updating classifications. Products shift categories. Last year's bestseller might be this year's slow mover. I update my classifications quarterly, and I usually find 5-10% of SKUs have moved between categories. If you run a seasonal business, check monthly during peaks.
Ignoring new products. A new SKU has no sales history. Place it in a temporary "N" (new) category with higher attention until you have 90 days of data. Do not dump it into C just because it has not sold much yet -- it has not had the chance.
Treating all C items the same. Some C items are strategic. The accessory that drives your A-item sales, the SKU customers expect you to carry, or the product needed for bundles. Flag these as "C-strategic" and give them more attention than a random low-seller.
ABC + Demand Forecasting
ABC analysis tells you where to focus. Demand forecasting tells you how much to order. The combination is powerful:
| Category | Forecasting Approach |
|---|---|
| A | Sophisticated models, weekly updates, tight monitoring |
| B | Standard models, monthly updates |
| C | Simple averages, quarterly review |
This prioritization means you achieve 90%+ forecast accuracy on your A items -- the ones where it matters most -- without burning hours trying to forecast a C-item that sells 3 units a month.
Automating ABC in ReplenishRadar
Running ABC analysis in a spreadsheet works until you hit about 200 SKUs or sell on multiple channels. At that point, you are spending an afternoon every quarter re-sorting, re-calculating percentages, and re-assigning categories. And that assumes you remember to do it, which I usually did not.
We automated this in ReplenishRadar. The system calculates ABC classifications from your sales data, updates the rankings as velocity changes, and applies different forecasting rigor by category. When a product shifts from B to A -- say, a seasonal item entering its peak -- the system increases forecast frequency and tightens the reorder point automatically. You get an alert instead of discovering the shift three weeks late during your next quarterly review.
Try ReplenishRadar free for 14 days ->
Related Reading:
Frequently Asked Questions
See what your inventory is really doing
Doing $5M+ in revenue? Talk to our team
Related Posts
Best Inventory Management Software for Shopify (2026)
Compare the best inventory management tools for Shopify stores. See features, pricing, and which solution fits your business size and needs.
Best Multi-Channel Inventory Software (2026)
Compare the best inventory management tools for multi-channel e-commerce. Find solutions for Shopify, Amazon, and marketplace sellers.
Best Amazon FBA Inventory Tools (2026)
Compare the best inventory management tools for Amazon FBA sellers. See features, pricing, and which solution helps prevent stockouts and manage restock limits.