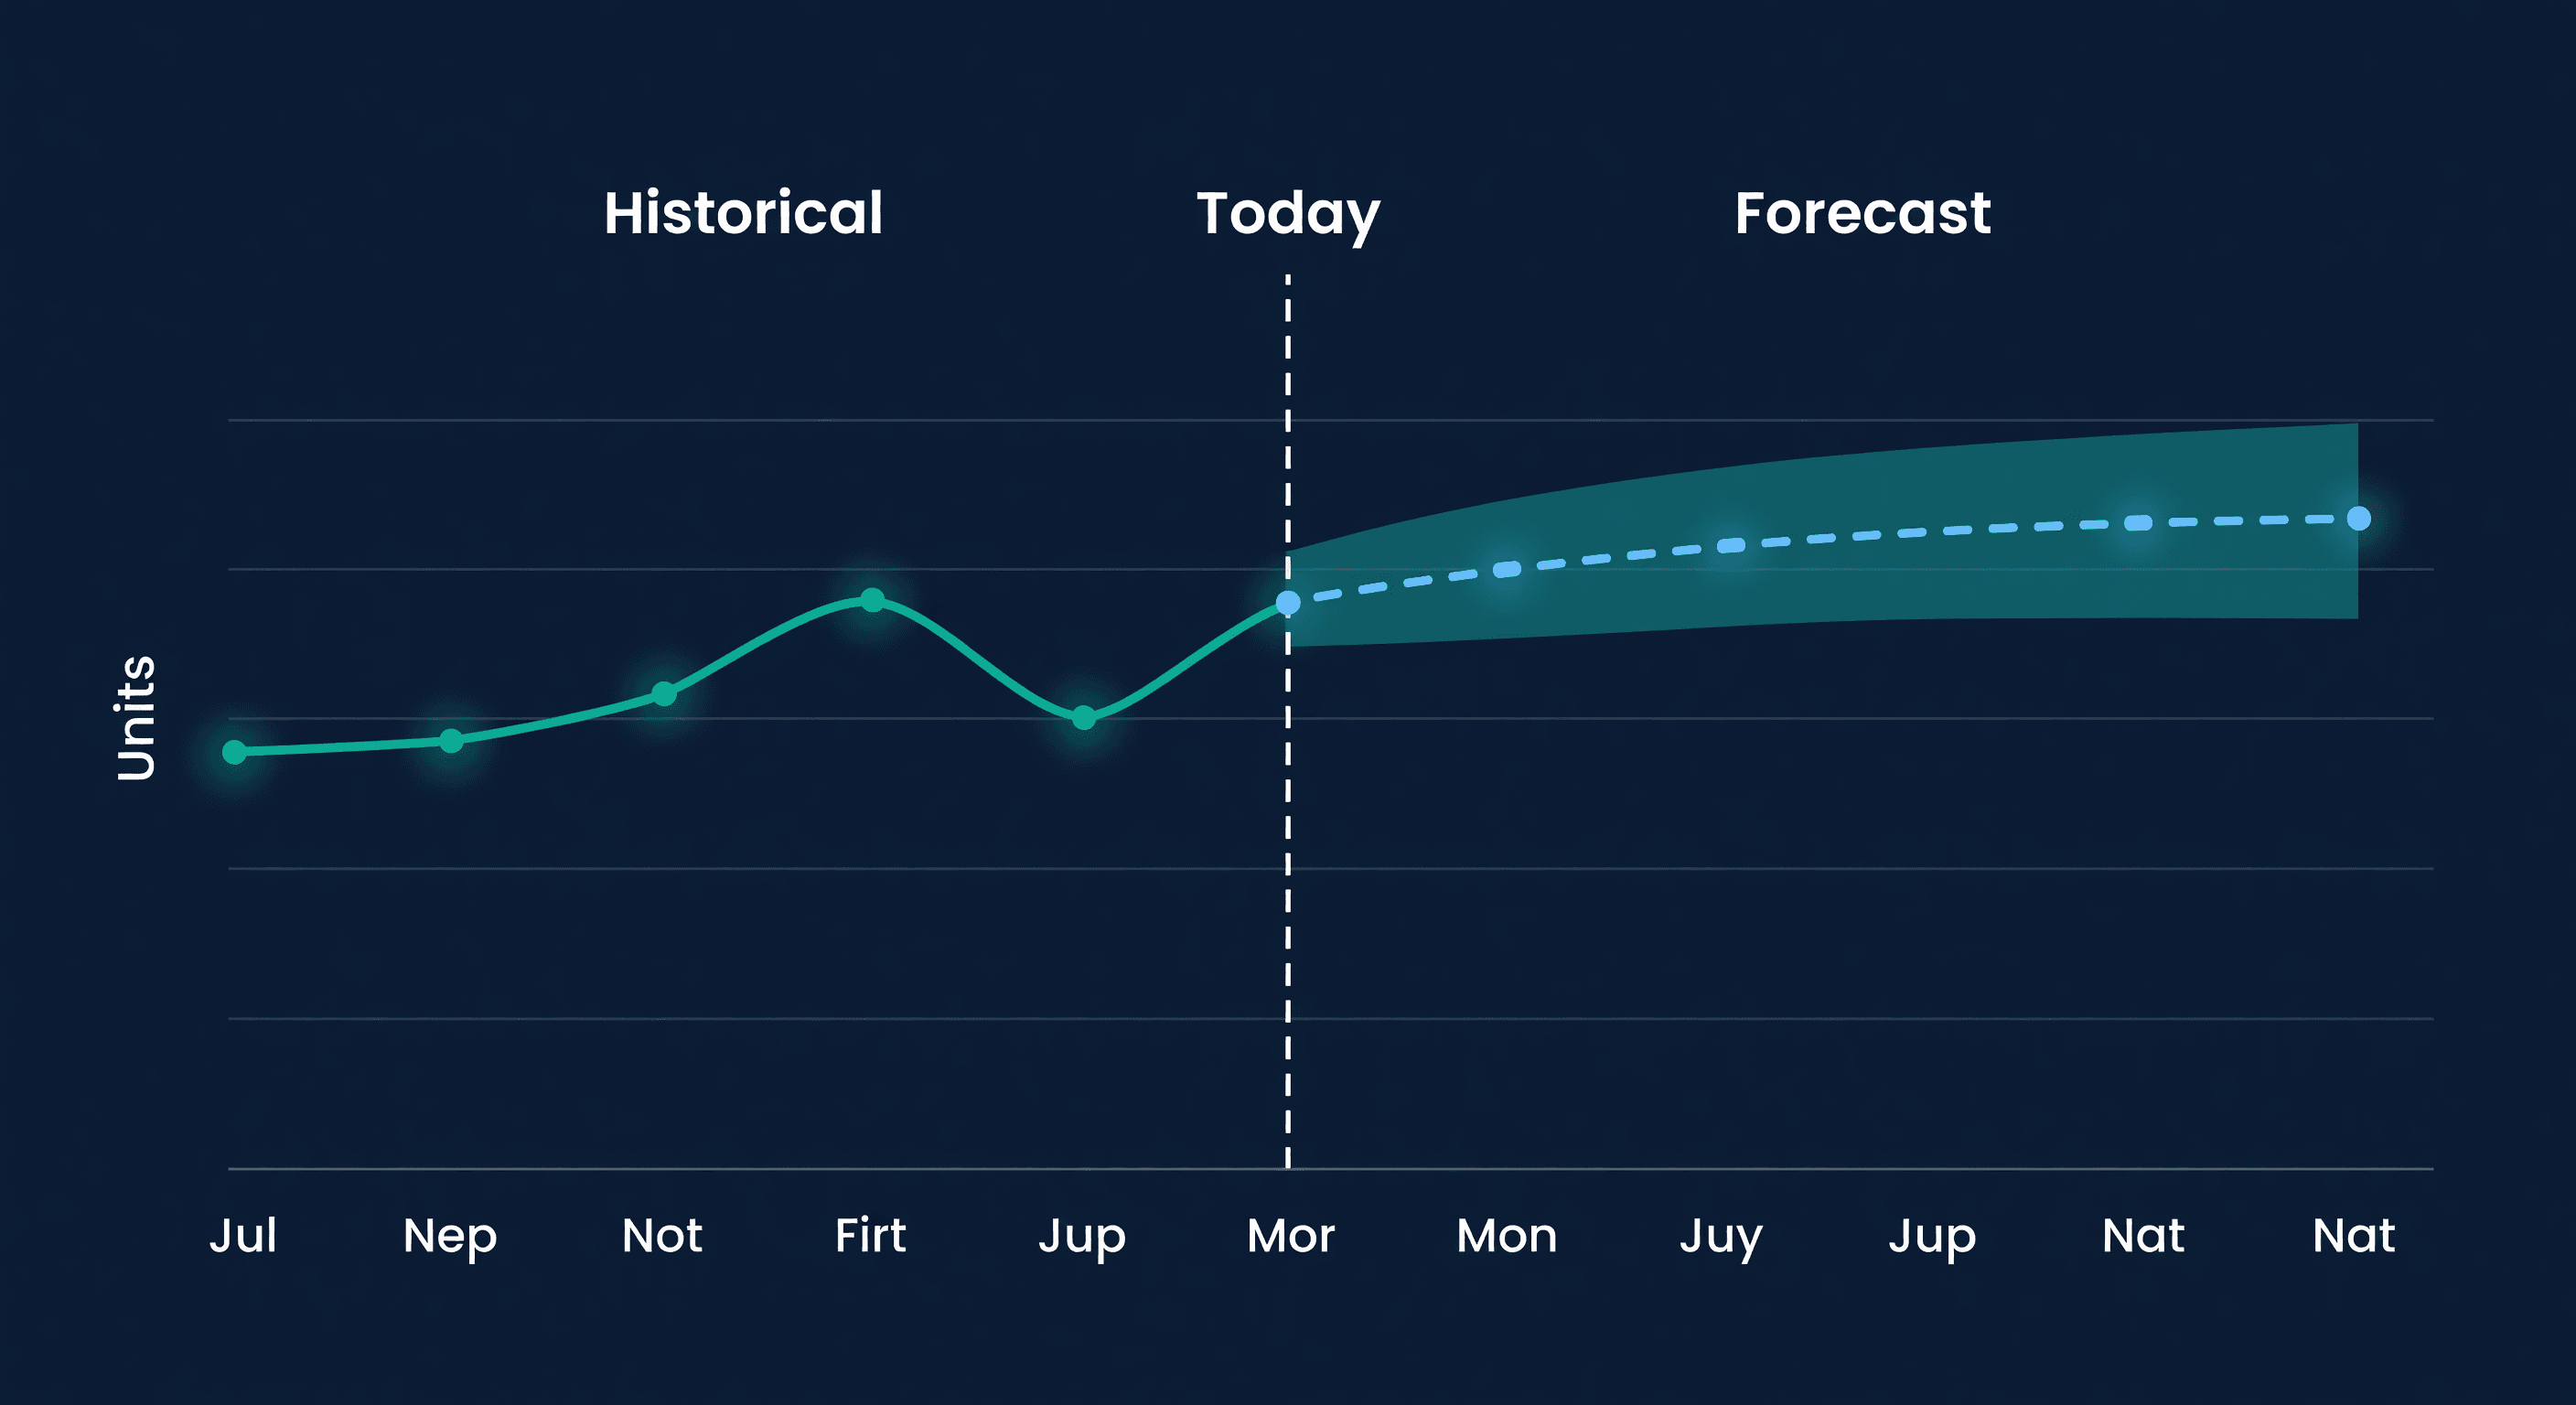
Inventory Forecasting 101: A Beginner's Guide
Key takeaway: Forecasting answers one question: how much will you sell before your next order arrives? The core formula is (Average Daily Sales × Lead Time) + Safety Stock. Good forecasts prevent both stockouts and the cash drain of overstock.
The One Question Forecasting Answers
Every inventory decision you make comes down to a single question: how much will I sell before my next order arrives?
Get it right and you have product on shelves when customers want it, with cash left over for growth. Get it wrong and you are either staring at a stockout notification or a warehouse full of product that is not moving. I have been on both sides. The stockout side is worse - you lose the sale, the ranking, and sometimes the customer permanently.
Whether you are managing Shopify inventory or running multi-channel operations, forecasting is the skill that separates sellers who grow from sellers who thrash. If you sell across more than one channel, the best multi-channel inventory software does this forecasting math across all of them at once.
The Formula
At its simplest:
Reorder Quantity = (Daily Sales x Lead Time) + Safety Stock - Current Inventory
Three inputs. That is it. The hard part is getting each one right.
Sales Velocity
How fast are you selling? Pull your last 30 days:
Last 30 days sold: 300 units
Daily average: 10 units/day
Simple division. But do not stop there. Is demand trending up or down? We had a product averaging 10 units per day, then a competitor ran out of stock and suddenly we were doing 18. If we had ordered based on the trailing average, we would have stocked out in two weeks.
Look at the trend, not just the average. And if a big promotion is coming - Prime Day, a site-wide sale - adjust upward manually. No algorithm will predict your own marketing calendar.
Lead Times
Lead time is not just shipping. It is every day between placing the order and having inventory ready to sell:
Supplier processing: 3 days
Shipping from China: 30 days
Customs + receiving: 7 days
Total lead time: 40 days
During those 40 days, you will sell approximately:
10 units/day x 40 days = 400 units
That is 400 units you need on hand just to survive the wait. I track actual delivery dates against estimated ones for every PO. Most suppliers are slower than they claim. Knowing by how much changes your math.
Safety Stock
Safety stock protects you when things go sideways. Demand spikes. Shipping delays. Supplier issues. A simple rule that works for most sellers: keep two weeks of extra stock.
10 units/day x 14 days = 140 units
For a deeper look at the statistics behind this, see our safety stock calculation guide. But two weeks is a solid starting point for products with stable demand and reliable suppliers.
The Reorder Point
Put the pieces together and you get your trigger - the inventory level that means "order now":
Lead Time Demand + Safety Stock = Reorder Point
400 units + 140 units = 540 units
When you hit 540 units, place your next order. Not 500. Not "when it feels low." 540. Having a specific number removes the guesswork and the procrastination.
How Much to Order
The reorder point tells you when. Order quantity tells you how much. This depends on:
- Reorder frequency: ordering monthly means larger orders than weekly
- Minimum order quantities: your supplier may require 500+ units
- Storage capacity: FBA limits and warehouse space constraints
- Cash flow: a $20,000 PO is great math but bad if you cannot make payroll
I default to ordering enough to cover one full reorder cycle plus safety stock. For most products, that means 30-60 days of supply per order. If you want the textbook answer that balances ordering costs against holding costs, run the numbers through our EOQ calculator and treat the result as a starting benchmark, not gospel.
Seasonality Changes Everything
E-commerce demand is not flat. If you sell the same amount in November as you do in February, you are either very lucky or selling something boring.
The patterns that matter most:
- Q4: holiday shopping can 3-5x your normal volume
- Summer: some categories dip 20-30%
- Prime Day / Black Friday: concentrated spikes that need pre-positioning
- Category-specific: swimwear peaks in April (when people buy, not when they swim)
Pull last year's monthly sales. Compare month over month. That ratio is your seasonal index, and it should adjust your forecasts forward.
When Spreadsheets Stop Working
Spreadsheets are fine for 20 SKUs. I built my first forecasting model in Google Sheets and it worked for about six months. Then we crossed 80 SKUs and the spreadsheet started lying to me - formulas referencing the wrong rows, seasonal adjustments I forgot to apply, a velocity calculation that was still using data from a product we discontinued.
The breaking point for most sellers is around 50 SKUs. Below that, a well-maintained spreadsheet is adequate. Above it, the maintenance time exceeds the value.
We built ReplenishRadar to handle this transition. Connect your Shopify or Amazon store and forecasts generate automatically from your sales history. The system picks up seasonality, flags when velocity changes, and tells you when to reorder - without a spreadsheet you have to babysit. If you sell on Shopify and want to compare your options first, we ranked the best Shopify inventory management software by forecasting depth, channel support, and pricing.
You can also connect an AI agent to your inventory and query your forecasts conversationally - ask "what is the 30-day forecast for SKU-X?" and get an answer in seconds instead of digging through dashboards.
Try ReplenishRadar free for 14 days ->
Getting Started Today
- Export sales data: pull the last 12 months by SKU from your platform
- Calculate velocity: average daily sales per product for the most recent 30 days
- Document lead times: call your suppliers, get real numbers, then add a few days
- Set reorder points: use the formula above
- Review monthly: forecasting improves with iteration, not perfection
The sellers who forecast well are not smarter. They just have better data and they actually look at it.
Related Reading:
- Safety Stock Calculation Guide
- Reorder Point Calculator
- Stockout Cost Calculator
- Why One Formula Can't Forecast Every SKU
- Your Forecast Accuracy Score, Explained
- SKU-Level Demand Forecasting - per-product forecasting instead of category averages
Frequently Asked Questions
Get notified when it matters
Amazon and Shopify change the rules constantly. We'll email you when something affects your business.
See what your inventory is really doing
Doing $5M+ in revenue? Talk to our team
Related Posts
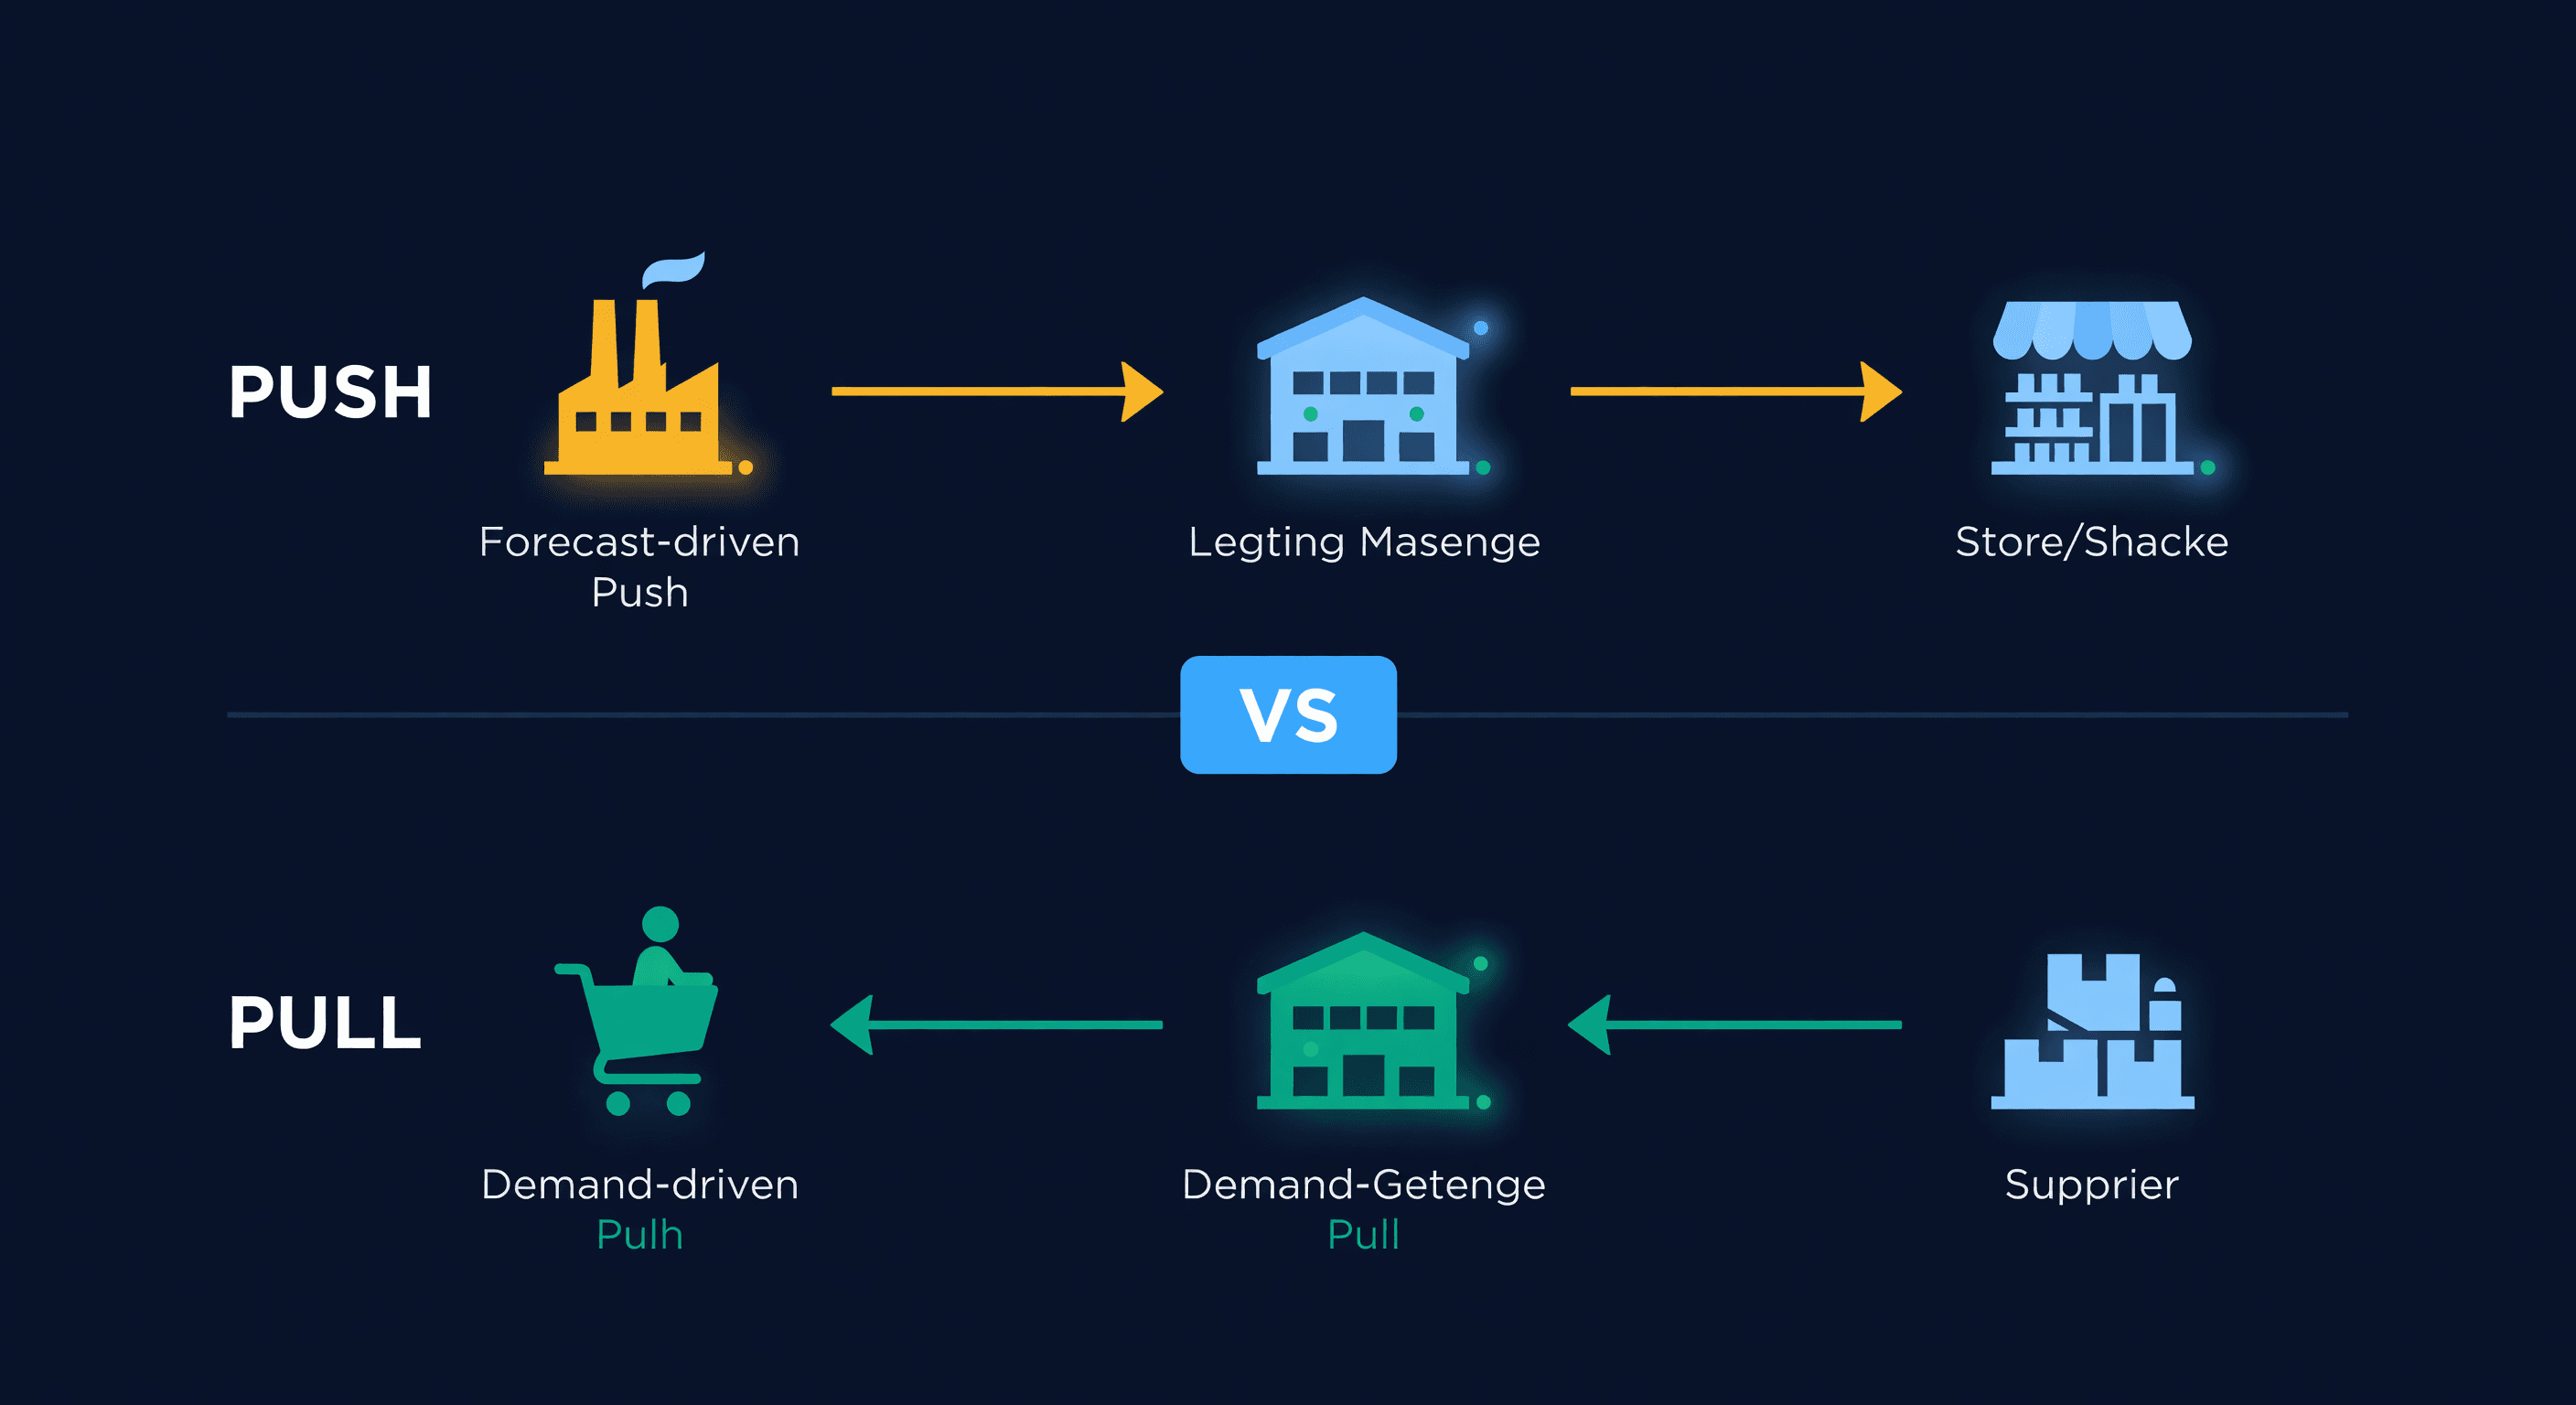
Pull vs Push Inventory: Which Model Wins?
Push inventory relies on forecasts. Pull inventory responds to demand. Most e-commerce sellers need both. Here's how to decide.
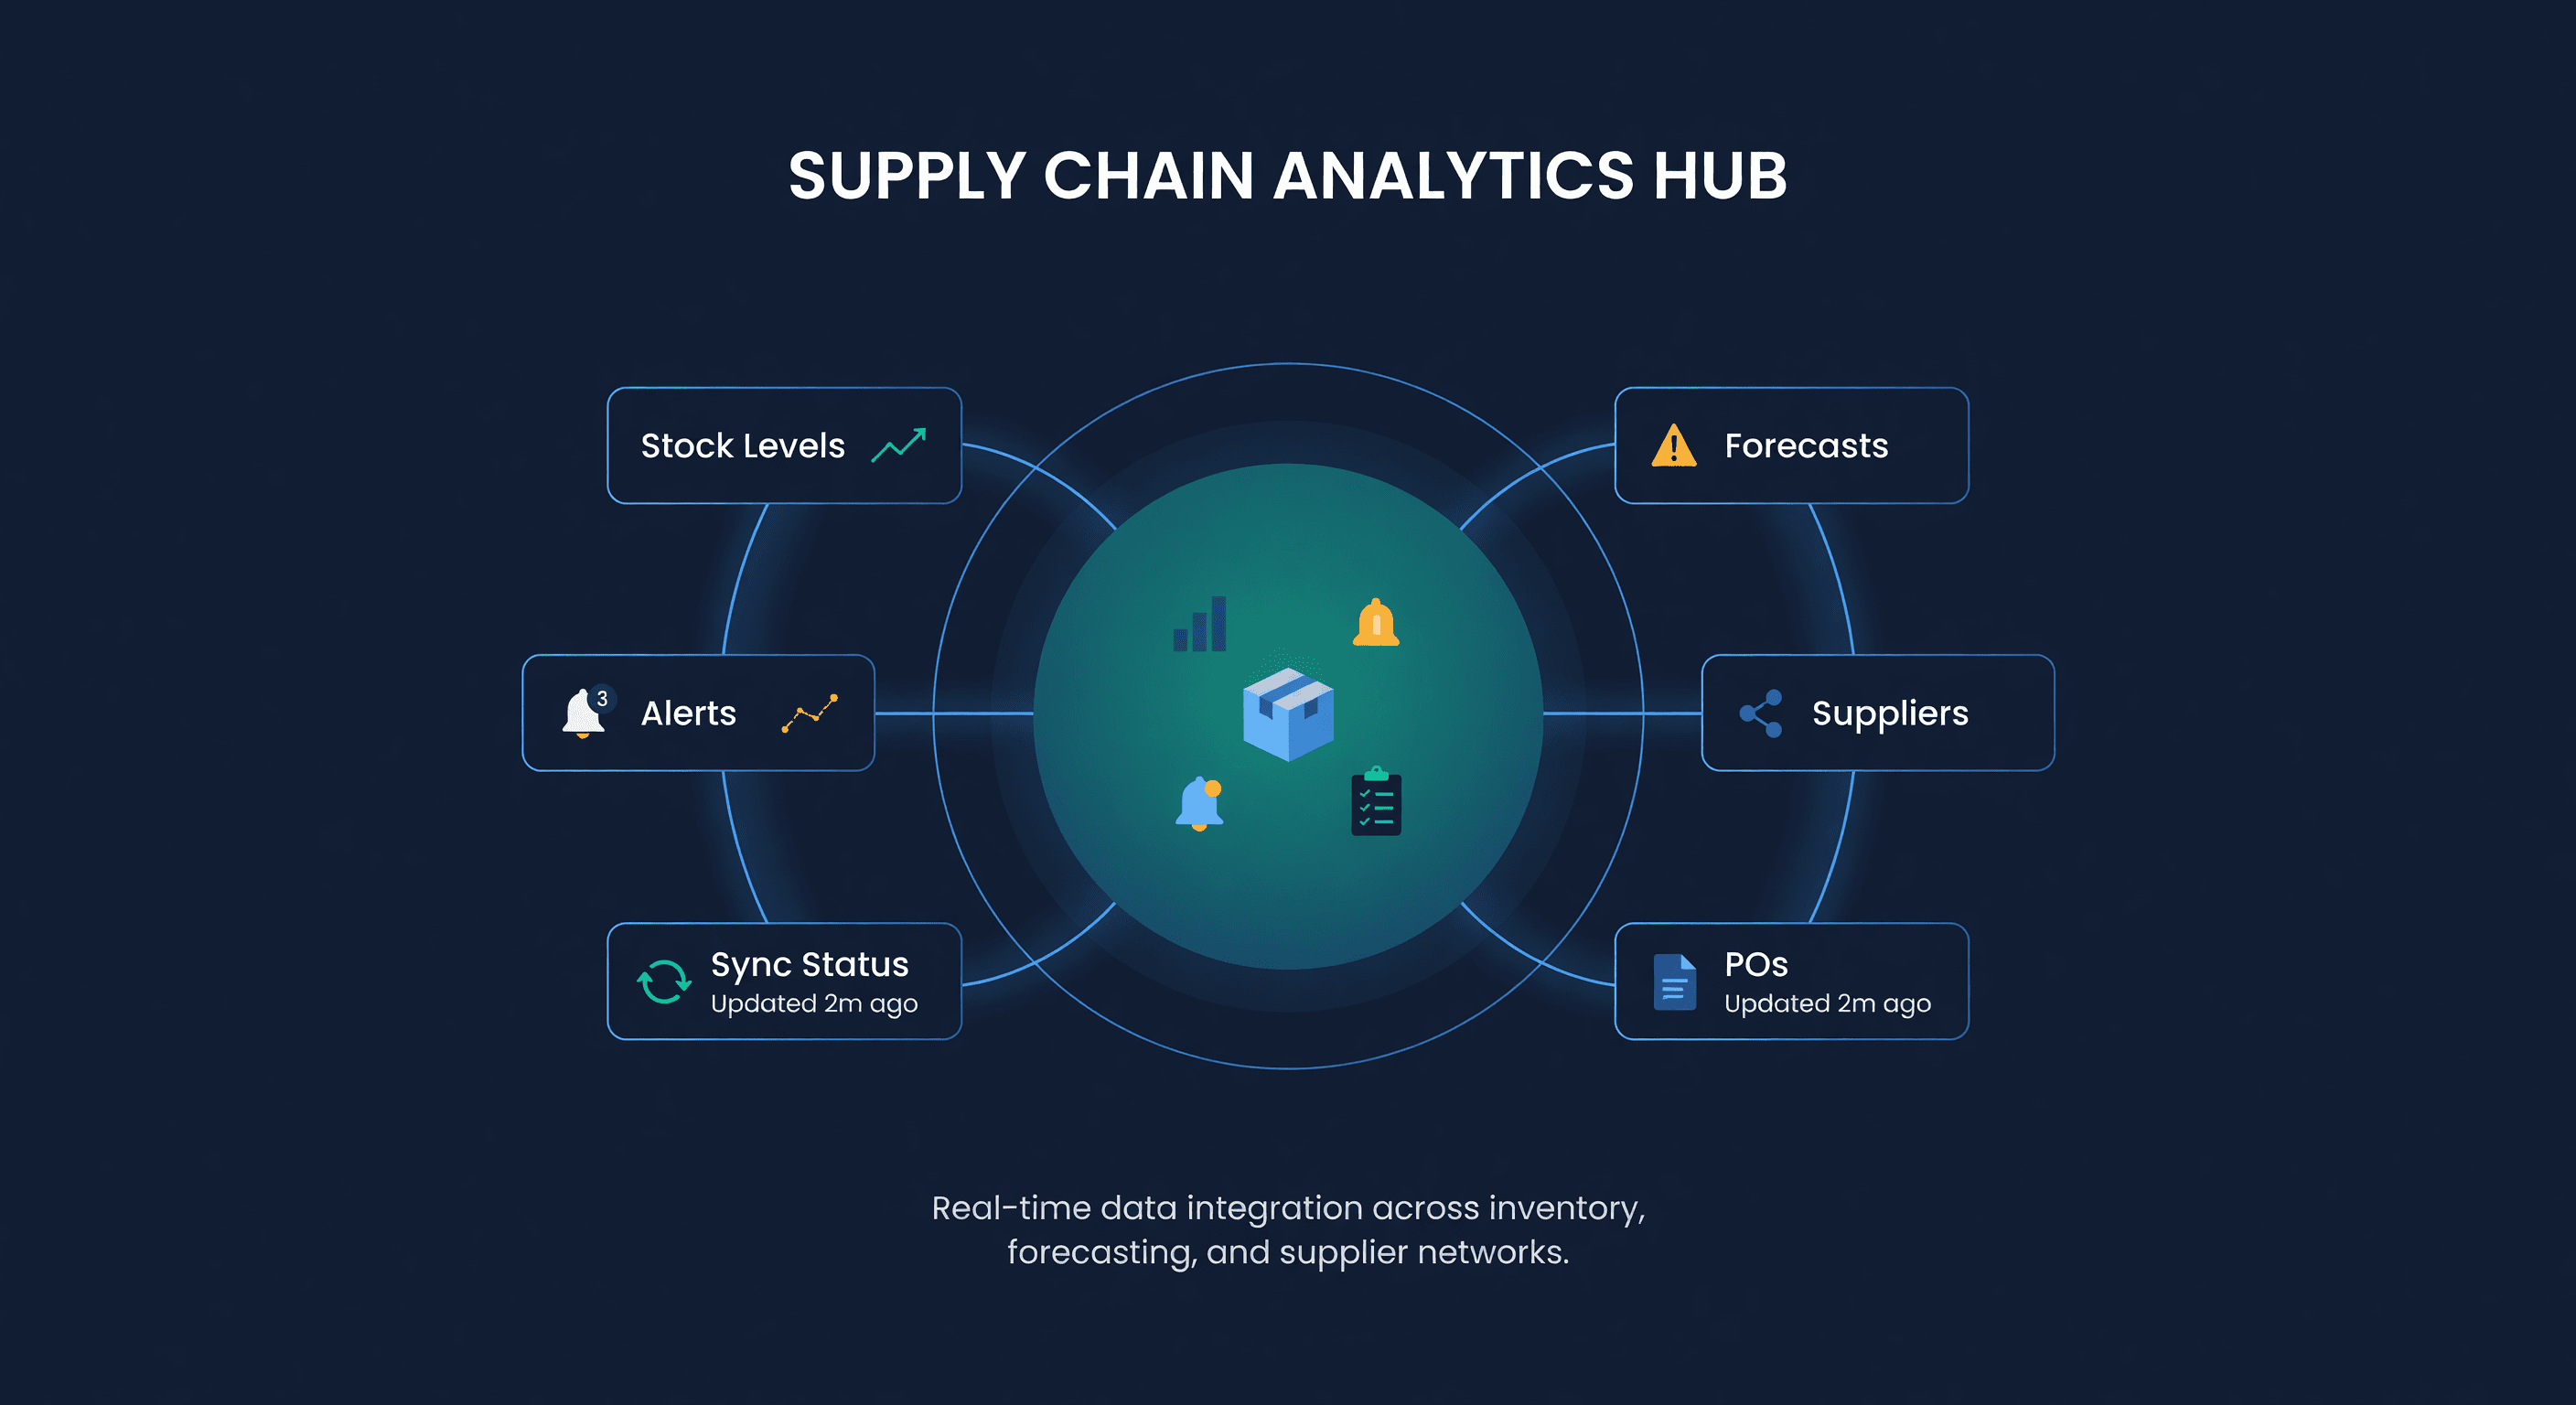
What Can an AI Agent Do With Your Inventory Data?
Real use cases for AI agents in inventory management: morning briefings, stockout alerts, PO drafts, and what agents still can't do.
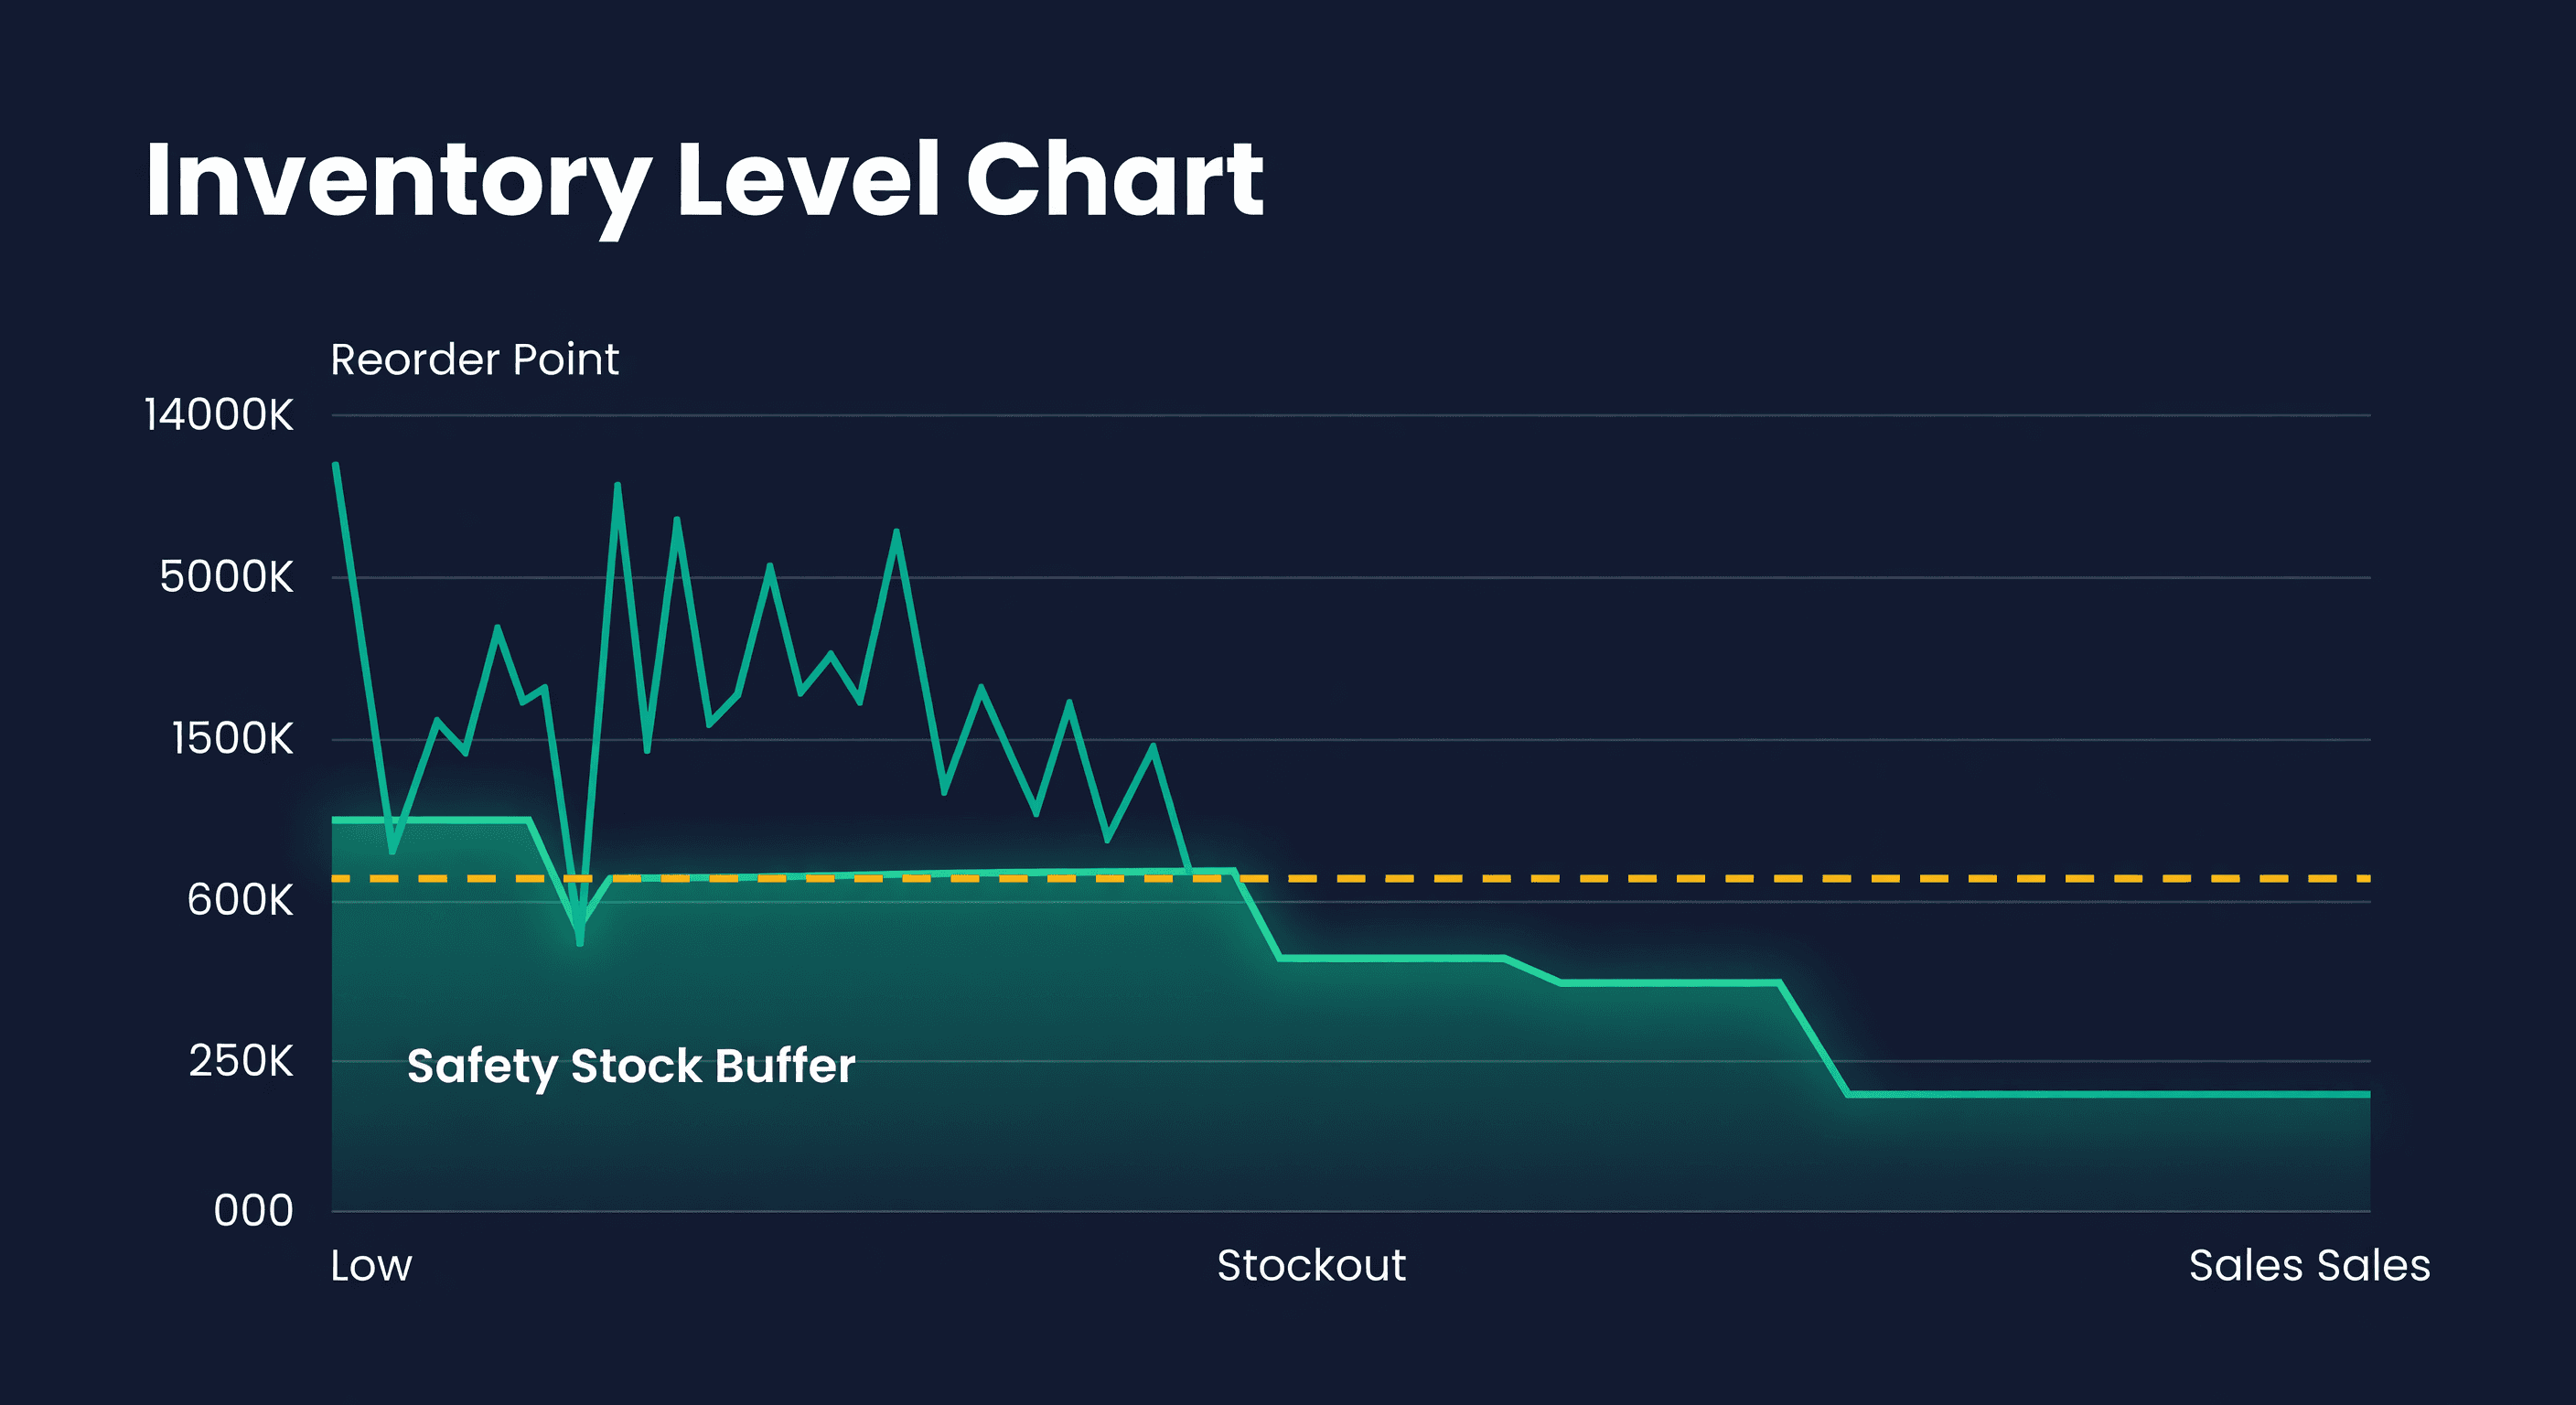
Safety Stock Calculation: The Complete Guide for E-commerce
Learn how to calculate safety stock for your e-commerce business. Includes formulas, examples, and tips for Shopify and Amazon sellers.
