What Your Stockouts Actually Cost (Per-SKU)
Every seller I have talked to can tell me their best-selling SKU. Revenue per month, margin, maybe even the conversion rate. Ask them which stockout cost the most money last quarter and you get a blank stare.
That is not a knowledge gap. It is a measurement gap. Your sales dashboard shows what happened. It does not show what should have happened.
You Track Revenue. You Do Not Track Missing Revenue.
Shopify and Amazon both report sales beautifully. Daily revenue, units sold, average order value. But neither platform tells you the other number -- the revenue that vanished because a product was not available to buy.
Think about that for a second. You know the exact dollar amount of every transaction. You have zero visibility into the transactions that never happened because inventory hit zero.
I ran a thought experiment on a mid-size Amazon catalog recently. 400 active SKUs. Pulled the OOS data for one quarter. Fourteen SKUs had stockout events ranging from 3 to 19 days. The aggregate lost revenue? Over $74,000. From fourteen products across 90 days.
The seller had no idea. She knew she had stocked out -- she remembered restocking them. But she had never gone back and quantified the damage per SKU. Why would she? The restocking felt like the fix. The money was already gone.
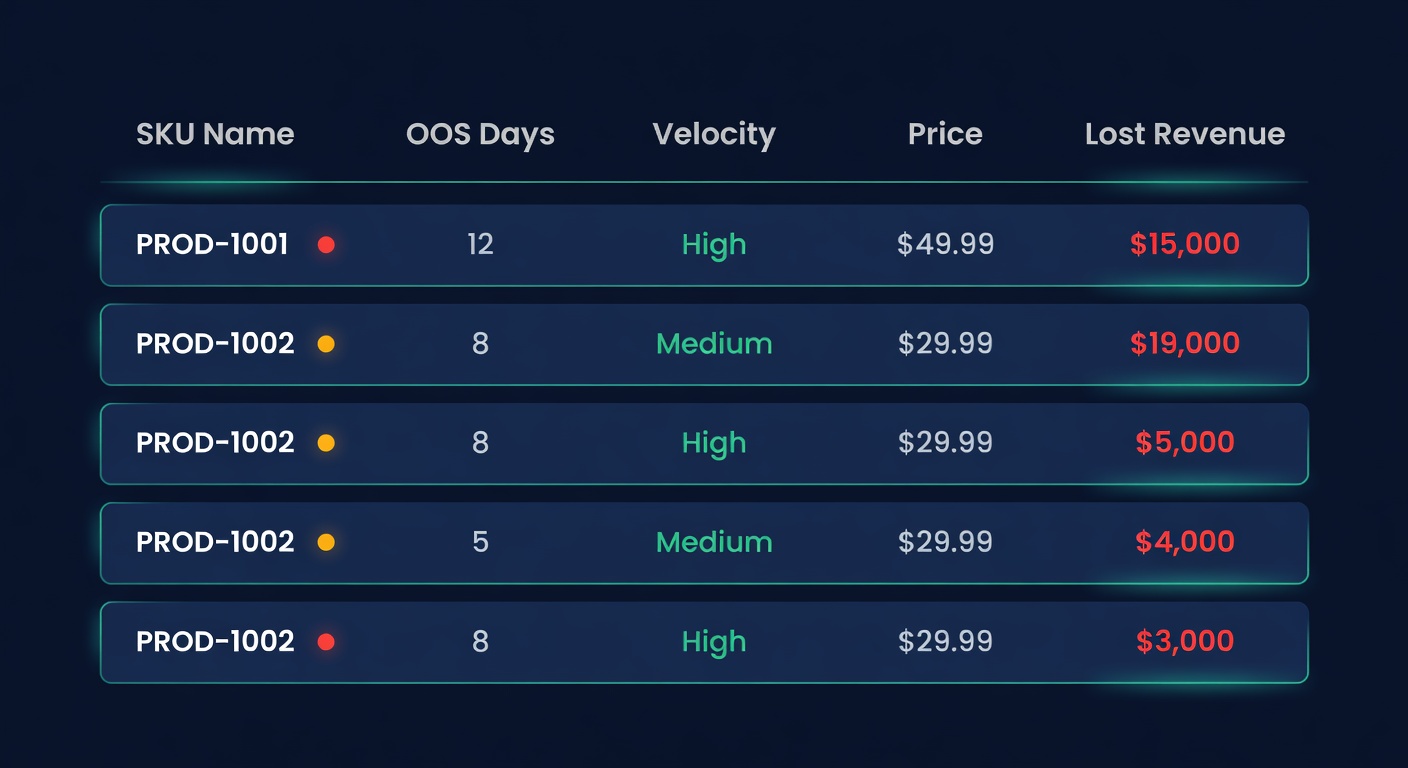
The Formula Is Simple. The Visibility Is Not.
Lost sales math is not complicated:
OOS Days x Daily Velocity x Revenue Per Unit = Lost Revenue
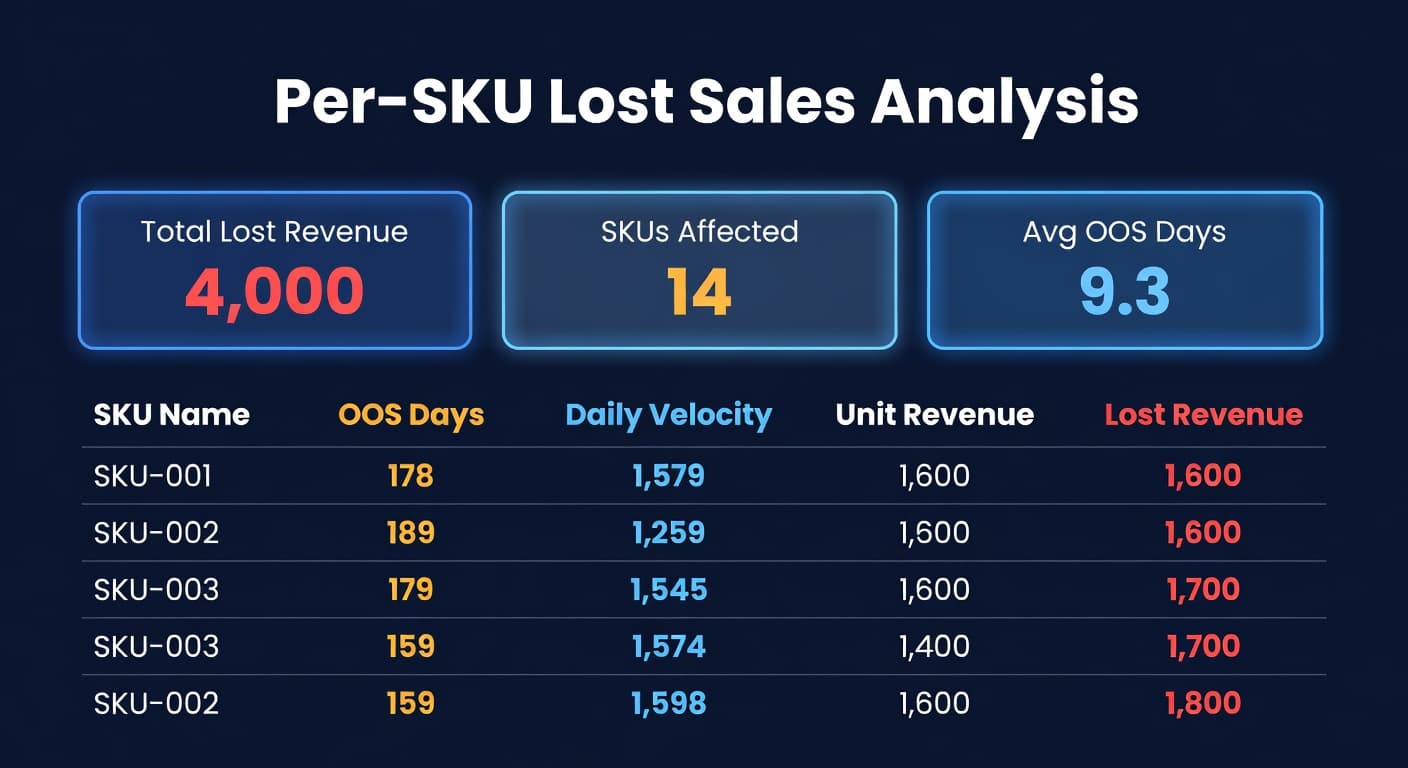
One SKU. One formula. Three inputs. Here is what it looks like on a real product:
| Variable | Value |
|---|---|
| Product | Stainless steel water bottle |
| Days out of stock | 12 |
| Daily velocity (pre-stockout) | 4 units |
| Revenue per unit | $50 |
| Lost revenue | $2,400 |
$2,400 from one product. Not your whole catalog. One SKU.
That number is easy to calculate in isolation. The problem is doing it across 200, 500, 2,000 SKUs on an ongoing basis. You need accurate OOS tracking per SKU (not just "was it in stock today, yes or no" but the exact days), you need reliable velocity data from before the stockout started, and you need it all in one place where you can sort by impact.
That is where most sellers hit a wall. The data exists. It lives in three different places. And nobody has the patience to stitch it together in a spreadsheet every month.
The Pareto Problem
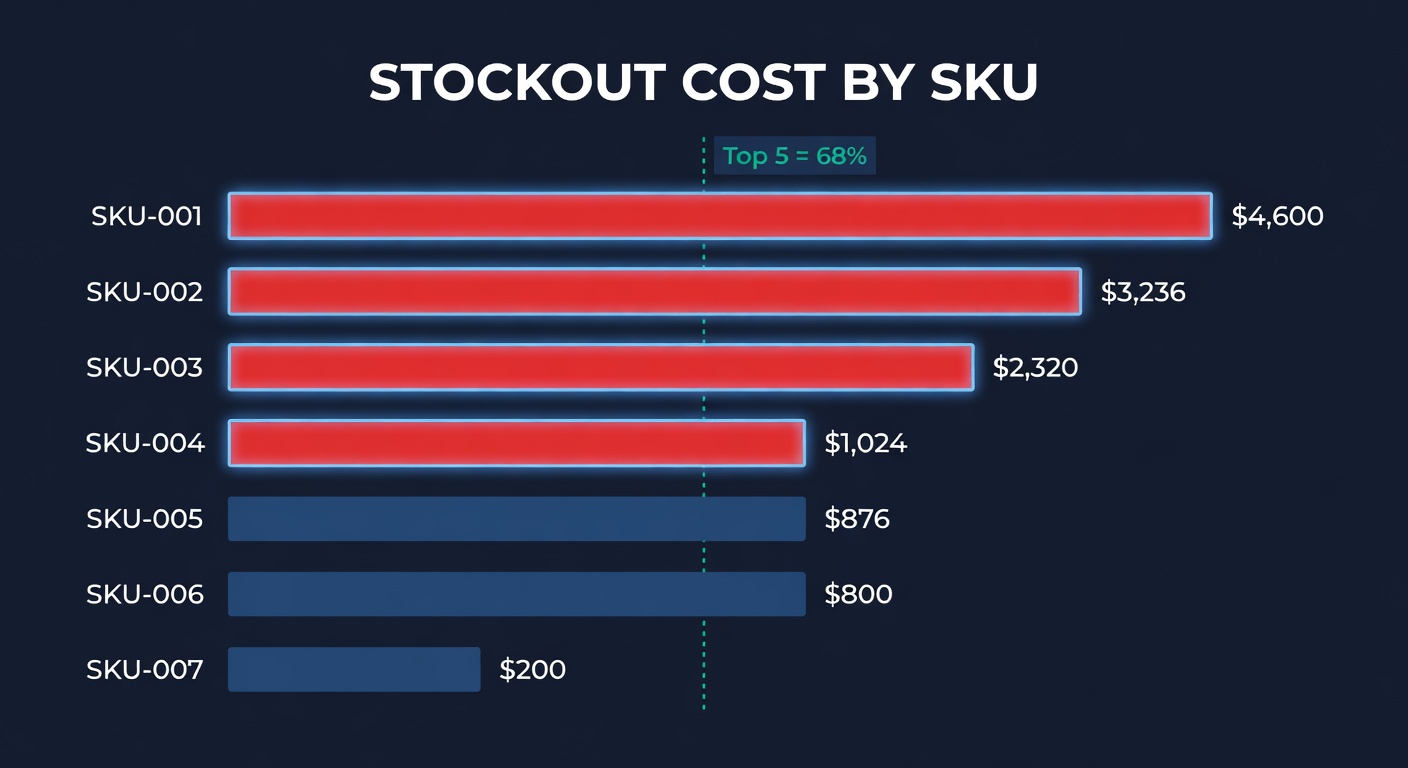
Here is what surprised me when I first did this analysis: stockout losses are absurdly concentrated.
We looked at that 400-SKU catalog I mentioned. The top 5 stockouts by lost revenue accounted for more than half the total damage. Five products out of fourteen that stocked out. Out of 400 total.
| Rank | SKU | OOS Days | Daily Velocity | Unit Revenue | Lost Revenue | % of Total |
|---|---|---|---|---|---|---|
| 1 | Bottle - 32oz Black | 19 | 14 | $50 | $13,300 | 18.0% |
| 2 | Resistance Band Set | 17 | 12 | $34 | $6,936 | 9.4% |
| 3 | Yoga Mat - 6mm Gray | 16 | 9 | $45 | $6,480 | 8.8% |
| 4 | Meal Prep Containers 10pk | 14 | 16 | $28 | $6,272 | 8.5% |
| 5 | Blender Bottle - 28oz | 12 | 11 | $32 | $4,224 | 5.7% |
| Top 5 Total | $37,212 | 50.3% | ||||
| Other 9 stockouts | $36,788 | 49.7% |
This is Pareto at work, and it means something practical. You do not need to fix all your stockouts at once. Fix the five most expensive ones and you recover half the damage. That is an afternoon of work -- adjust five reorder points, maybe expedite one PO -- and you prevent $37,000 in lost sales next quarter.
But you cannot do this without the per-SKU view. An aggregate "you lost $74,000 to stockouts" number tells you the problem is real. It does not tell you where to start.
Why Velocity Matters More Than You Think
There is a subtlety in the formula that most people miss. Velocity is not the same for every product, and it is not static.
A product selling 2 units a day that stocks out for a week costs you 14 units. A product selling 20 units a day that stocks out for 3 days costs you 60 units. The second stockout was shorter but four times as expensive in lost units.
I have seen sellers spend a week chasing a restock for a slow-moving product that stocked out while ignoring a fast mover that went OOS for just two days. The slow mover felt more urgent because it had been out longer. The fast mover cost three times as much.
This is why sorting by lost revenue -- not by OOS days, not by "how long has it been out" -- changes how you prioritize. A 3-day stockout on a high-velocity SKU is more expensive than a 10-day stockout on a slow mover. You need to see the dollars, not just the days.
From Lost Sales to Profit Drag
Lost sales are half the story. The other half is the inventory you are holding too much of.
Every SKU in your catalog sits somewhere on this spectrum:
| State | What Is Happening | Cost |
|---|---|---|
| Stocked out | Lost sales, ranking damage | Revenue you did not earn |
| Understocked | Days of supply running low | Stockout risk building |
| Right-sized | Demand matches supply | Minimal waste |
| Overstocked | Excess sitting in warehouse | Carrying cost bleeding cash |
| Dead stock | Nothing moving at all | Storage fees + write-off risk |
The combined cost of lost sales (left side) and excess holding costs (right side) is what I call profit drag. It is the gap between your actual profit margin and what your margin would be if every SKU had exactly the right amount of inventory.
For most sellers, profit drag runs 5-15% of revenue. That is not a typo. On a $2M business, we are talking $100,000-$300,000 a year in preventable waste from both ends of the spectrum.
The problem is that most sellers only worry about one end. Amazon sellers obsess over stockouts because the ranking penalty is brutal. Shopify sellers tend to over-order because they do not face storage fee pressure until their warehouse lease comes up for renewal. Neither group looks at both sides of the equation together.
What to Do With This Data
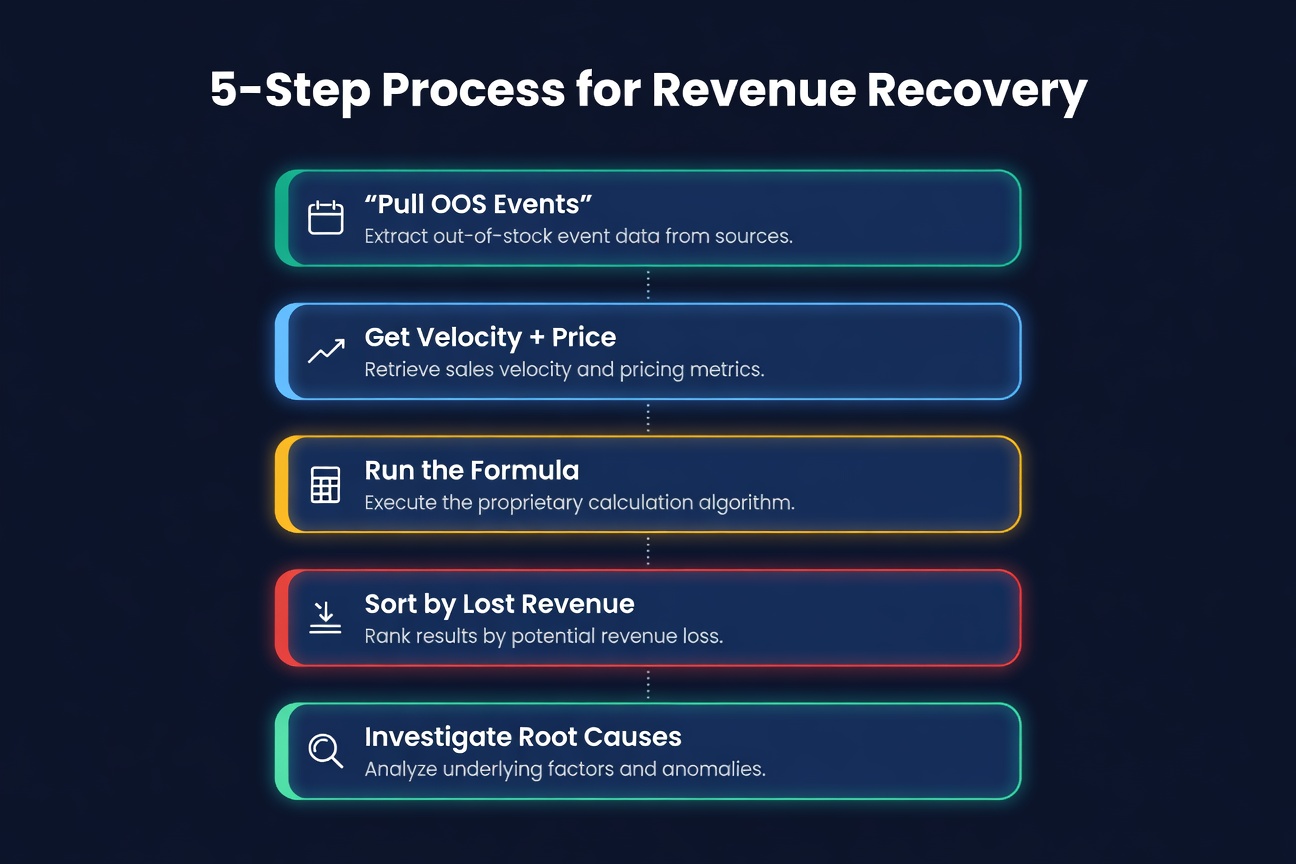
If you have never done a per-SKU lost sales analysis, here is how to start. It takes about an hour with a spreadsheet.
Step 1: Pull your OOS events. Go back 90 days. For every SKU that stocked out, record the product, the start date, the end date, and the number of days at zero inventory. Amazon's inventory health report has this data. For Shopify, you need to reconstruct it from inventory snapshots or use an app that tracks it.
Step 2: Get velocity and price. For each stockout SKU, pull the average daily sales velocity from the 30 days before the stockout started. Not during, not after. Before. Multiply by the average selling price.
Step 3: Run the formula. OOS days times velocity times price per unit. That is your per-SKU lost revenue.
Step 4: Sort by lost revenue, descending. This is the list that matters. The top 10 are your highest-priority reorder fixes.
Step 5: Ask why each one stocked out. Was the reorder point too low? Did the supplier ship late? Did demand spike unexpectedly? The fix is different for each cause, and the lost revenue number tells you which causes to investigate first.
Automating It
That spreadsheet exercise is useful once. Doing it monthly? Nobody does. I tried. I made it three months before the spreadsheet went stale because I did not update the velocity data or forgot to pull the new stockout events.
This is exactly the kind of analysis that breaks down as a manual process. The inputs change constantly -- velocity shifts with the season, new stockout events happen every week, prices move. By the time you finish the spreadsheet, the numbers are already outdated.
We built the lost sales analysis into ReplenishRadar's Profit Intelligence dashboard because we got tired of watching sellers fly blind on the most expensive problem in their inventory. The system tracks OOS days per SKU automatically, pulls the velocity data from your actual sales history, and calculates lost revenue in real time. You open the dashboard, sort by lost revenue, and you are looking at a ranked list of exactly where your money went.
The per-SKU lost sales table is available on Growth plans and above. Standard plans see the aggregate summary -- total lost revenue across the catalog -- which tells you the problem is real but does not show you the individual SKUs. If you manage more than a few dozen products, the per-SKU breakdown is where the money is.
See how Profit Intelligence surfaces your lost sales
The Number That Should Keep You Up
Run the analysis. Just once. Do the spreadsheet version if you want. The number you find will be larger than you expect because every seller I have walked through this exercise has the same reaction: "I knew stockouts were bad, but I did not know they were that bad."
Then look at the top 5. Those are the SKUs where a small change to your reorder point or safety stock saves thousands of dollars next quarter. Five fixes. Maybe ten minutes each. Against thousands in recovered revenue.
The math is not hard. The visibility is the bottleneck. Once you can see what each stockout costs at the SKU level, the prioritization takes care of itself.
Related Reading:
Frequently Asked Questions
Get notified when it matters
Amazon and Shopify change the rules constantly. We'll email you when something affects your business.
See what your inventory is really doing
Doing $5M+ in revenue? Talk to our team
Related Posts
10 Inventory KPIs Every E-commerce Seller Should Track
Stop guessing. Track these 10 inventory metrics to know if your business is healthy, where you're losing money, and what to fix first.
Stocky Is Shutting Down: Best Alternatives (2026)
Shopify discontinued Stocky. It shuts down August 2026. Here are the best Stocky alternatives for Shopify sellers, with honest pros and pricing.
How to Prevent Stockouts on Amazon
Amazon stockouts cost more than lost sales. Here's the math, the prevention playbook, and the recovery plan for FBA sellers.