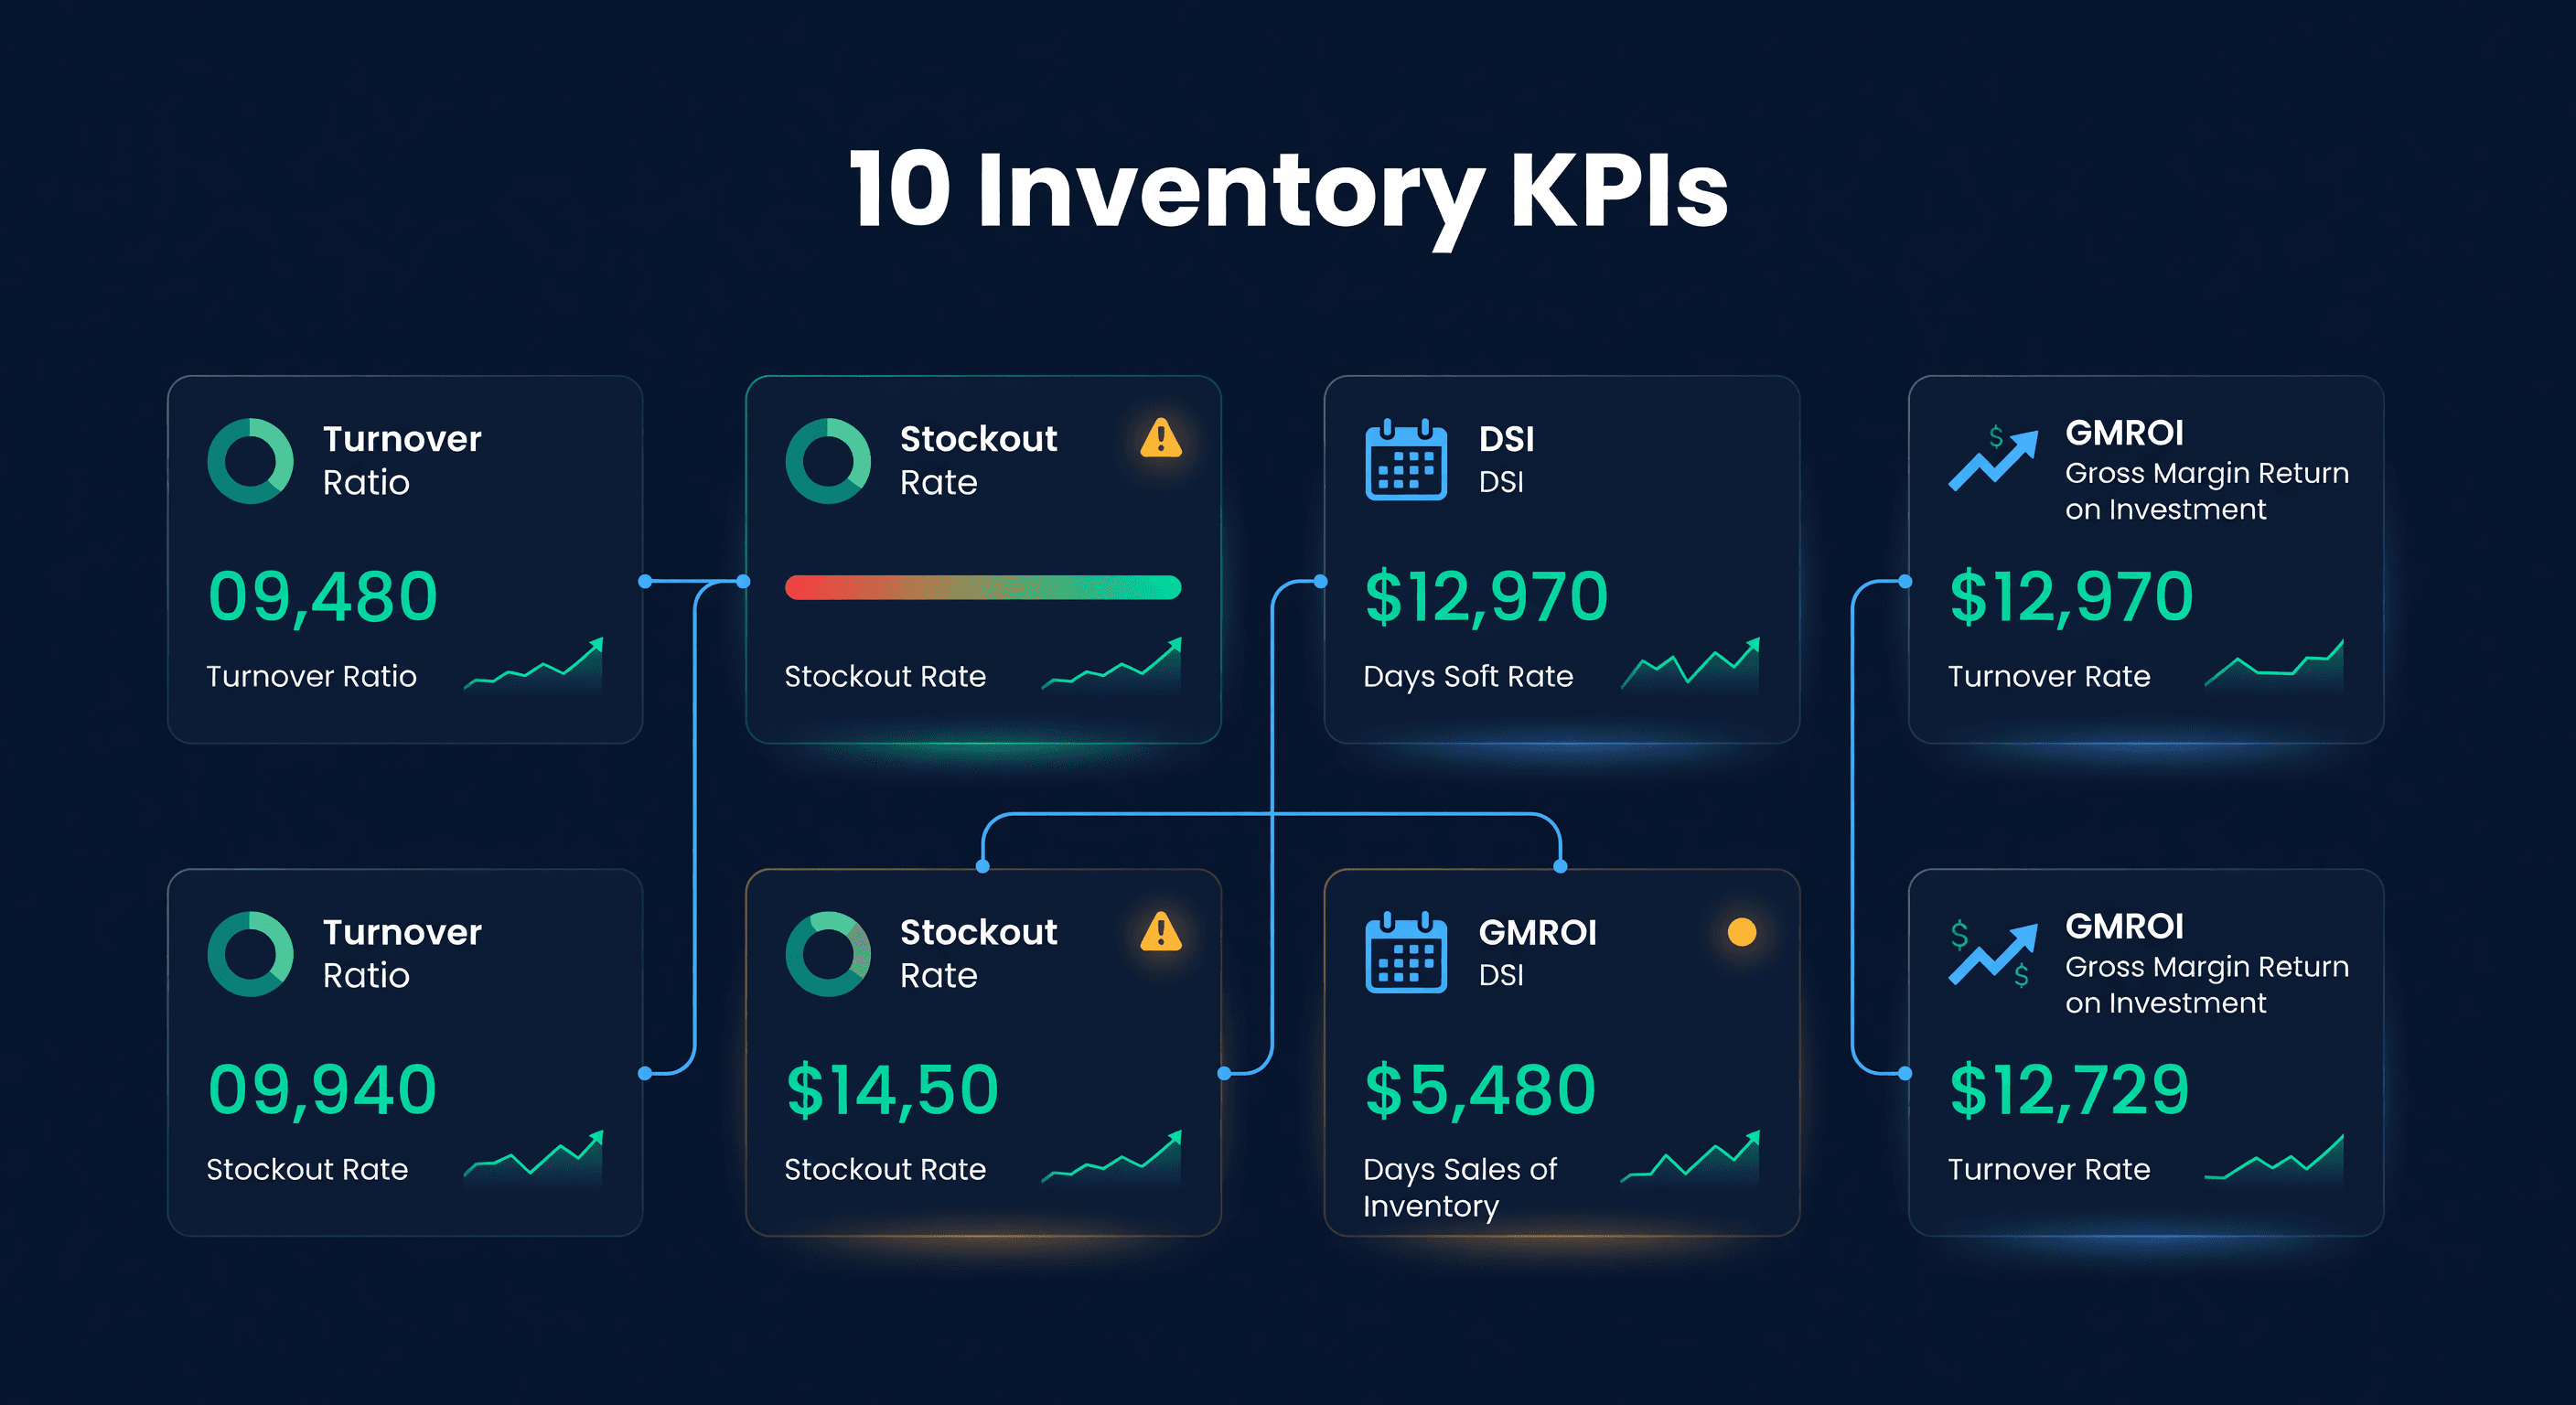
10 Inventory KPIs Every E-commerce Seller Should Track
Key takeaway: Start with five KPIs: Inventory Turnover Ratio, Days Sales of Inventory, Stockout Rate, Fill Rate, and GMROI. These expose hidden cash flow leaks and profitability drains that revenue numbers alone won't show.
Most Sellers Only Track Two Things
Units on hand and units sold. That tells you what happened. It does not tell you whether your inventory is working for you or quietly eating your margins.
I ran my business for over a year before I started tracking turnover ratio. When I finally calculated it, I realized a third of my capital was locked in products turning twice a year while my best SKUs were constantly understocked. That single number changed how I allocated purchasing budget.
These 10 KPIs give you the numbers to make better decisions. Start with three, build the habit, and add more as your operation matures.
Summary Table
| # | KPI | Formula | Target | Why It Matters |
|---|---|---|---|---|
| 1 | Inventory Turnover Ratio | COGS / Avg Inventory | 6-8x/year | Cash efficiency |
| 2 | Days Sales of Inventory | 365 / Turnover Ratio | 45-60 days | How long stock sits |
| 3 | Stockout Rate | Days OOS / Total Days | < 2% | Lost sales visibility |
| 4 | Fill Rate | Orders Filled Complete / Total Orders | > 95% | Customer satisfaction |
| 5 | GMROI | Gross Margin / Avg Inventory Cost | > 2.0 | Profit per dollar invested |
| 6 | Carrying Cost | (Holding Costs / Avg Inventory) x 100 | 20-30% of value | True cost of holding |
| 7 | Dead Stock % | Dead Units / Total Units | < 5% | Capital trapped in unsellable goods |
| 8 | Forecast Accuracy | 1 - (Abs Error / Actual) | > 70% | Purchasing decision quality |
| 9 | Order Cycle Time | Order Placed to Received | Varies | Supplier reliability |
| 10 | Perfect Order Rate | Perfect Orders / Total Orders | > 90% | Operational quality |
1. Inventory Turnover Ratio
How many times you sell and replace your inventory in a given period.
Inventory Turnover = Cost of Goods Sold / Average Inventory Value
Benchmark: 6-8 turns per year for most e-commerce sellers. Fast-moving categories (electronics, consumables) target 10-12.
Low turnover means capital is locked in slow-moving products. Too-high turnover can signal chronic understocking. The sweet spot depends on your category, but if you are below 4, something is wrong.
Example: Your COGS is $600,000/year. Average inventory is $100,000. Turnover = 6. Each dollar of inventory generates $6 in sales. If you improve to 8 turns, you only need $75,000 in inventory to support the same sales volume, freeing $25,000 in cash.
For a deeper breakdown, see Inventory Turnover Ratio: Formula, Benchmarks, and How to Improve.
2. Days Sales of Inventory (DSI)
The average number of days it takes to sell through your inventory.
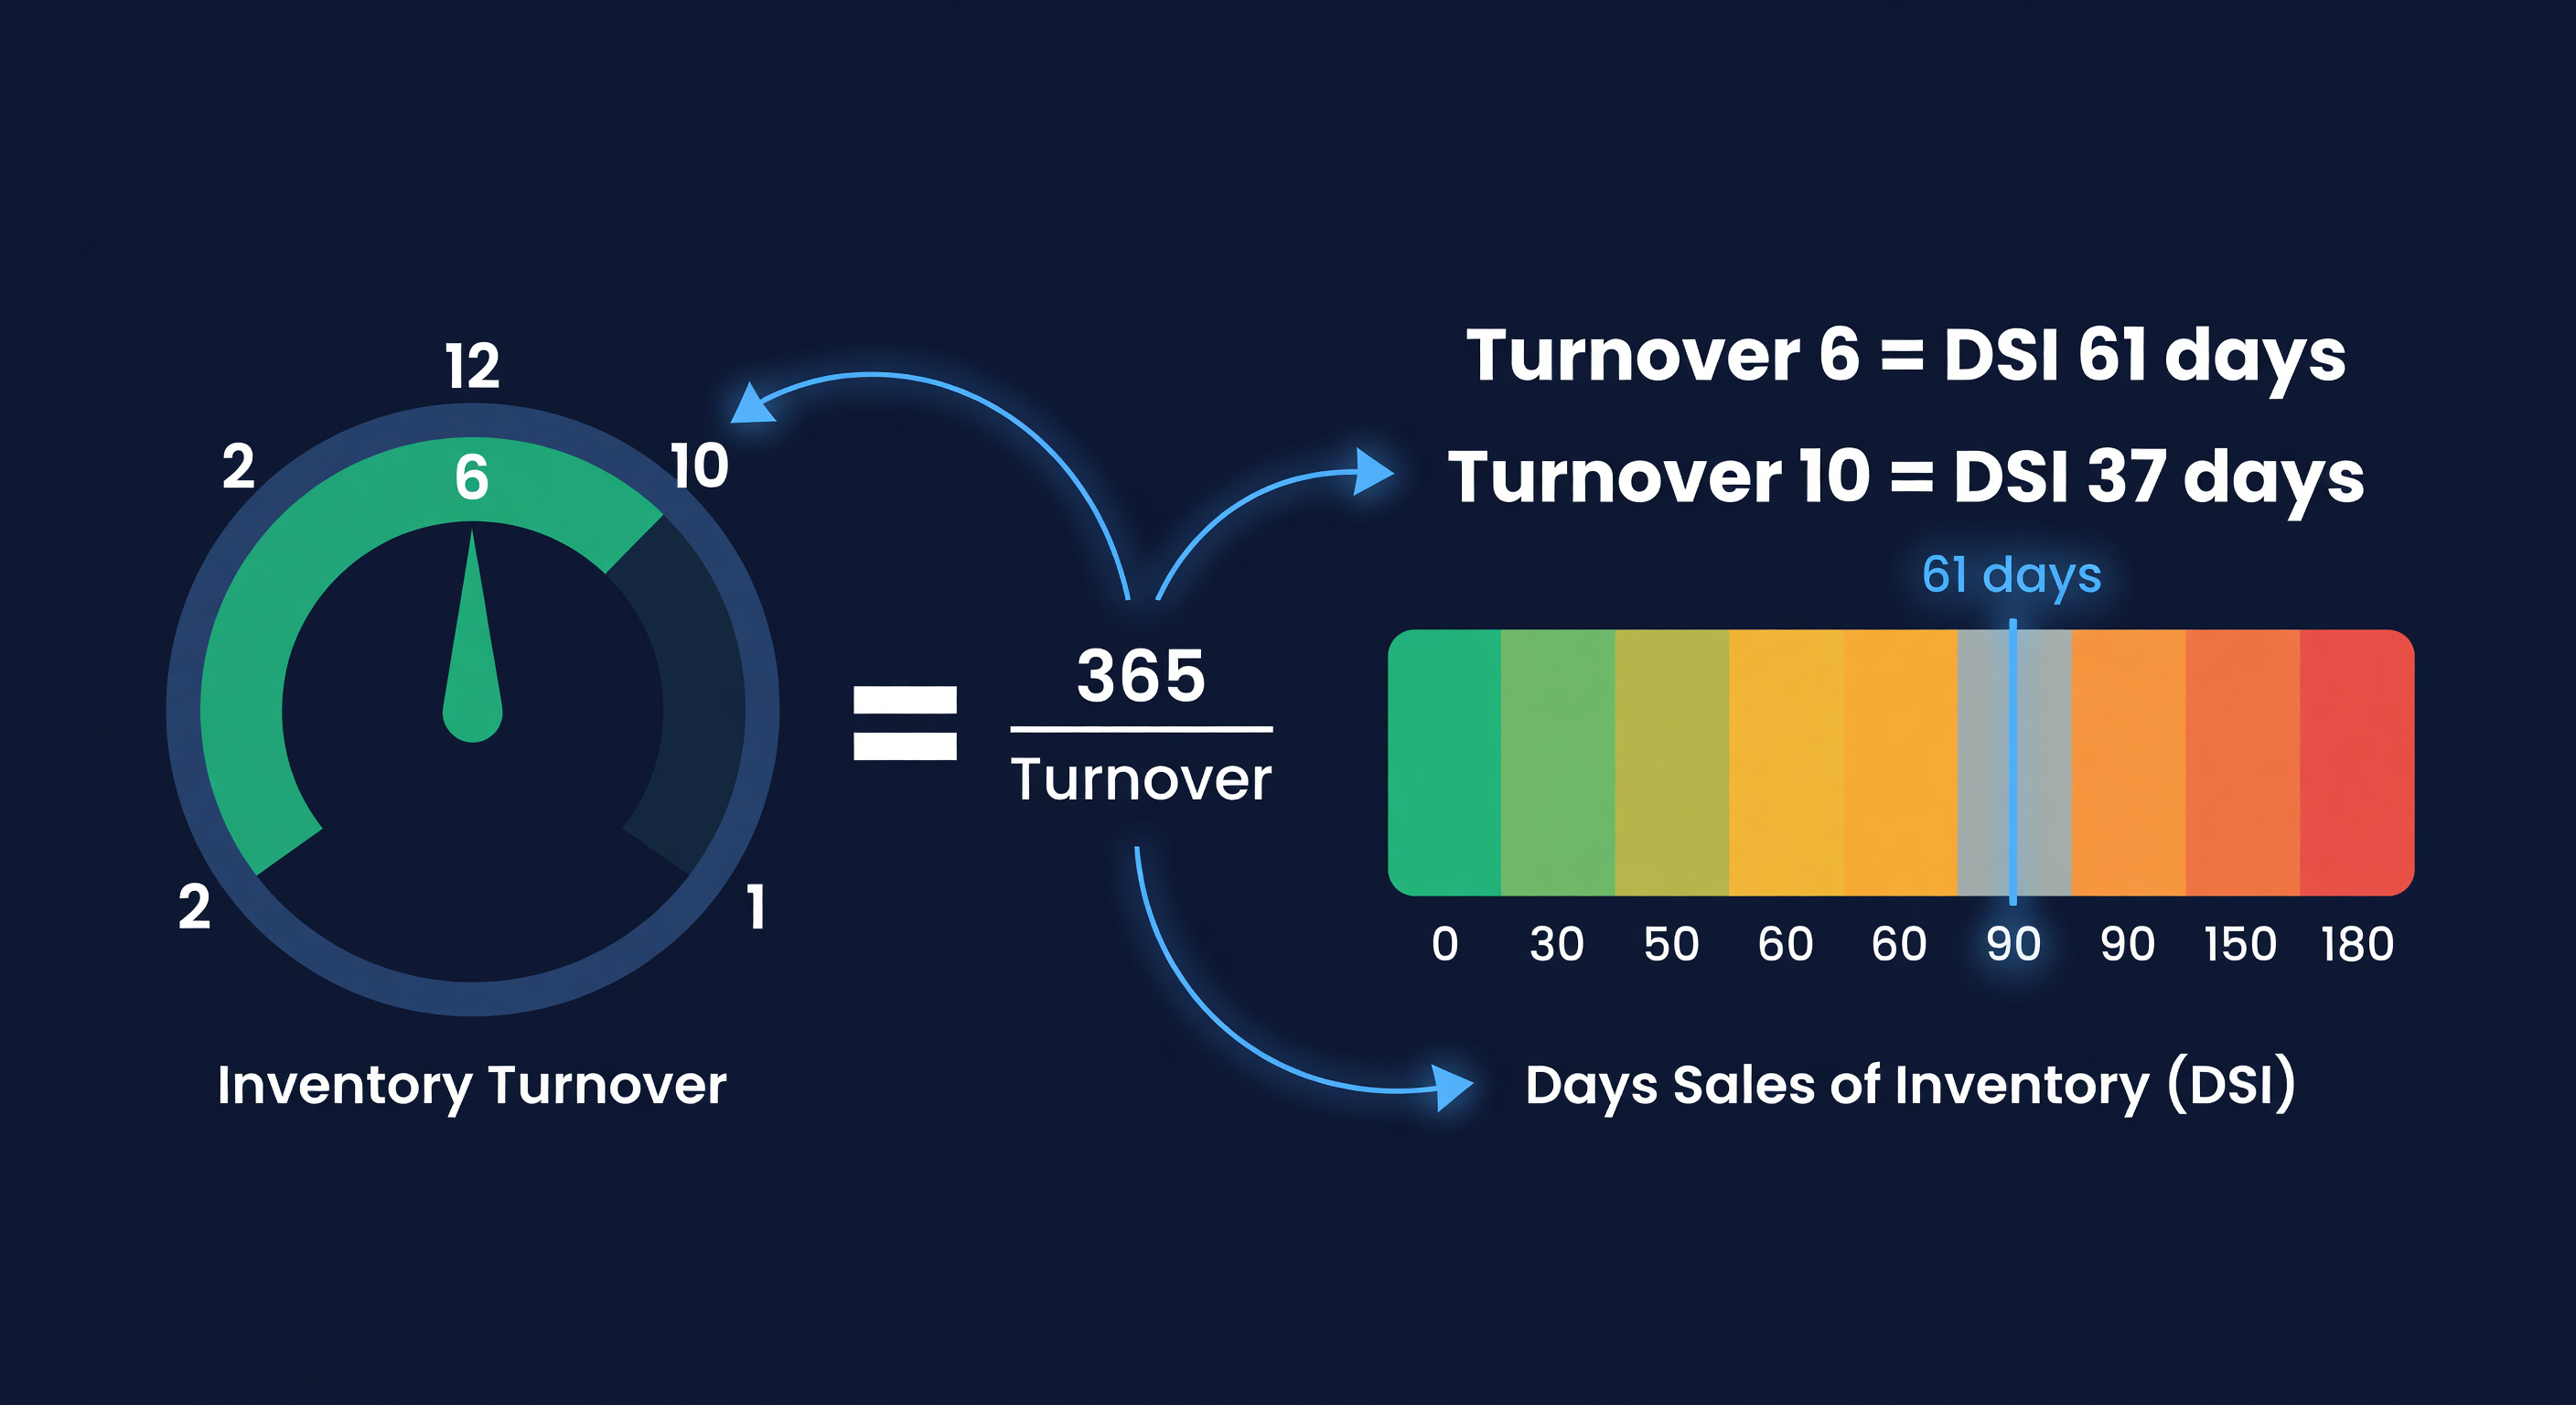
DSI = 365 / Inventory Turnover Ratio
Benchmark: 45-60 days for general e-commerce. Under 30 days for perishable or fast-fashion goods.
DSI translates turnover into a number that is easier to act on. "55 days" is more intuitive than "6.6 turns." It also maps directly to Amazon's long-term storage fee thresholds (181+ days and 365+ days).
Example: Turnover of 6 means DSI = 61 days. Turnover of 10 means DSI = 37 days. If your DSI is 120 days, nearly a third of your inventory has been sitting for a full quarter.
3. Stockout Rate
The percentage of time a product is unavailable for sale.
Stockout Rate = Days Out of Stock / Total Days in Period
Benchmark: Under 2% for A-items (top revenue SKUs). Under 5% overall.
Stockouts cost more than the lost sale. On Amazon, a stockout tanks your Best Seller Rank and organic visibility. On Shopify, customers who encounter stockouts may not return.
Example: If SKU-A was out of stock for 6 days in a 30-day month, the stockout rate is 20%. If that SKU sells $500/day, that is $3,000 in direct lost revenue, plus ranking damage that can take weeks to recover.
See Stockout Cost Calculator for the full cost model.
4. Fill Rate
The percentage of customer orders you can ship complete from available stock.
Fill Rate = Orders Shipped Complete / Total Orders x 100
Benchmark: 95% or higher. Top performers hit 98-99%.
Fill rate captures a different angle than stockout rate. You might have stock of most SKUs but consistently fail to fill multi-item orders because one item is missing.
Example: You receive 1,000 orders in a month. 940 ship complete on the first attempt. Fill rate = 94%. The 60 partial orders need backorders or split shipments, each adding cost.
5. Gross Margin Return on Investment (GMROI)
How much gross profit you earn for every dollar invested in inventory. This is the KPI I wish I had learned first.
GMROI = Gross Margin / Average Inventory Cost
Benchmark: Above 2.0 means you earn $2 in gross margin for every $1 in inventory. Below 1.0 means your inventory is losing money after holding costs.
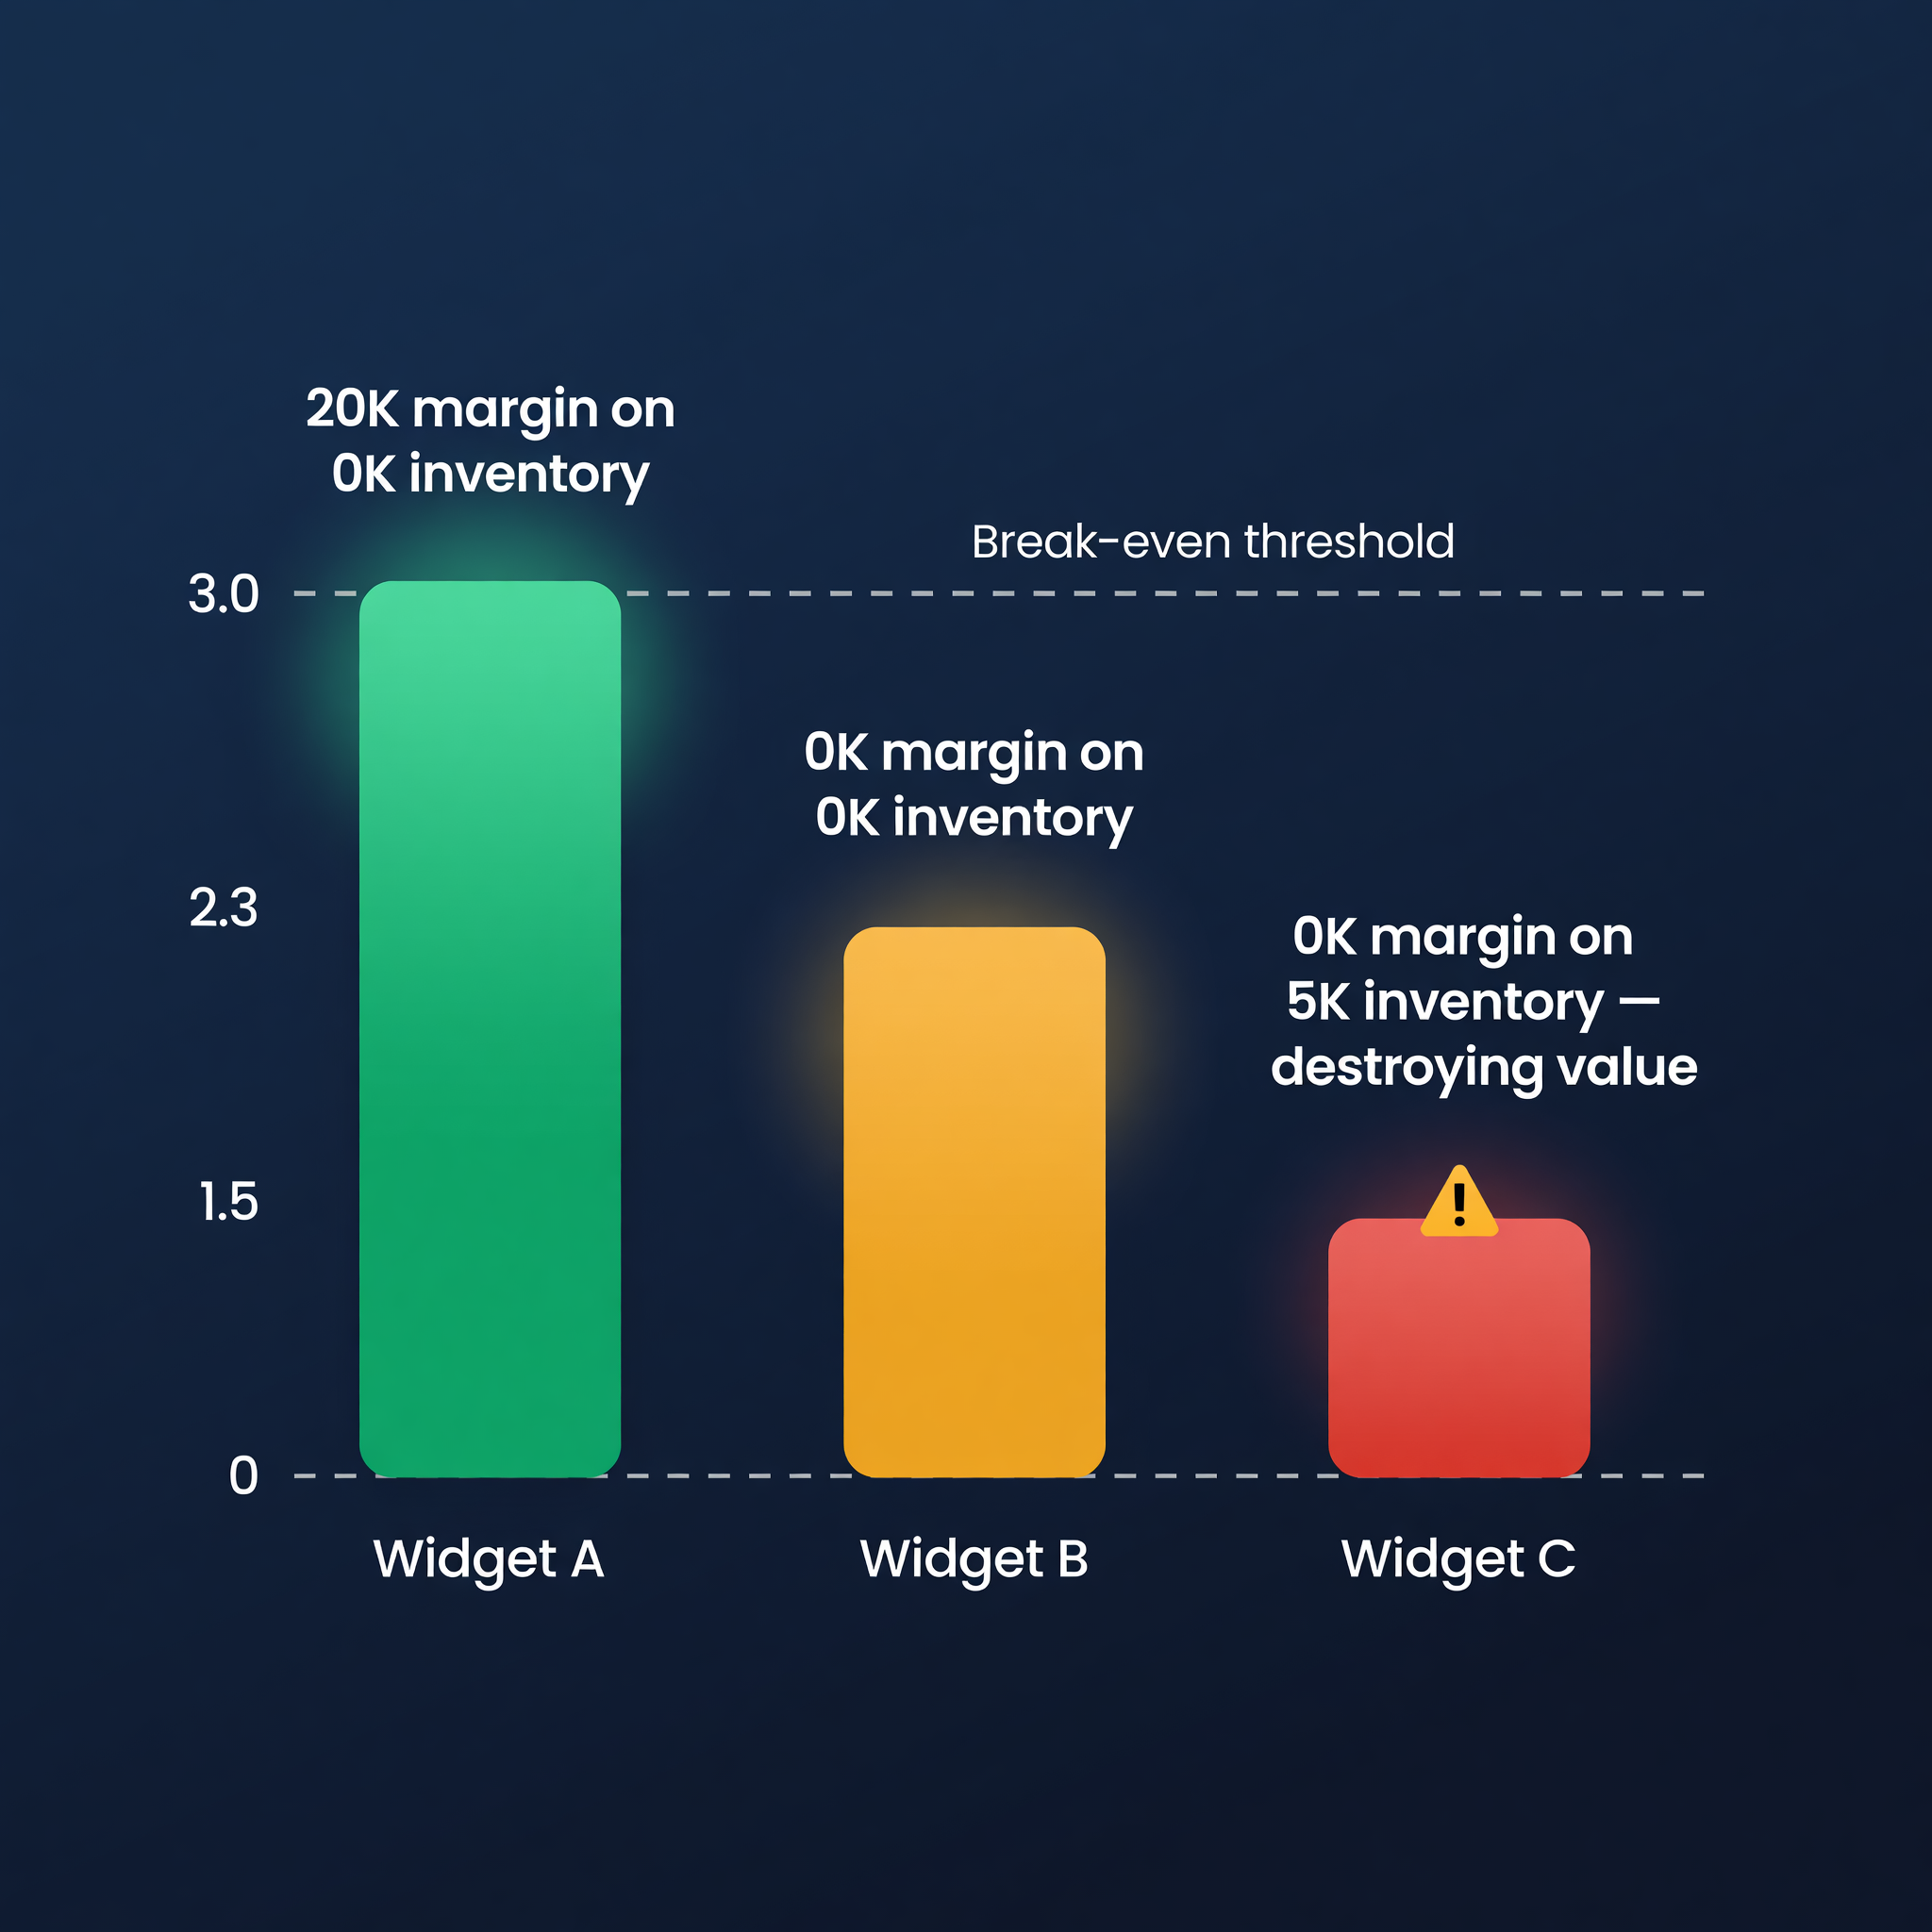
Turnover tells you speed. GMROI tells you profitability. A product that turns 12 times a year at 5% margin may be less valuable than one that turns 4 times at 40% margin.
Example:
| Product | Gross Margin | Avg Inventory | GMROI |
|---|---|---|---|
| Widget A | $120,000 | $40,000 | 3.0 |
| Widget B | $80,000 | $60,000 | 1.3 |
| Widget C | $30,000 | $35,000 | 0.86 |
Widget C is destroying value. Each dollar invested returns only $0.86 in gross margin before holding costs.
6. Carrying Cost of Inventory
The total cost of holding inventory, expressed as a percentage of average inventory value.
Carrying Cost % = (Storage + Insurance + Depreciation + Opportunity Cost) / Avg Inventory Value x 100
Benchmark: 20-30% of inventory value per year. FBA sellers often run higher due to Amazon's storage fees.
Most sellers underestimate this because they only count warehouse rent. The true cost includes tied-up capital, insurance, shrinkage, obsolescence, and storage fees. A $100,000 inventory with 25% carrying cost is $25,000/year just to hold.
Example: Monthly FBA storage for standard-size items is $0.87/cubic foot. 500 cubic feet of slow-moving inventory costs $435/month or $5,220/year in storage alone, before capital cost.
7. Dead Stock Percentage
The share of your inventory that has not sold in a defined period (typically 90 or 180 days).
Dead Stock % = Units with Zero Sales in 180 Days / Total Units on Hand x 100
Benchmark: Under 5%. Above 10% signals a serious problem.
Dead stock is the end stage of slow-moving inventory. It occupies space, ties up capital, and often has to be liquidated at a loss. Catching it early saves money. Catching it late saves less.
Example: You have 10,000 units across your catalog. 800 units have had zero sales in 6 months. Dead stock percentage = 8%. If those units cost $12 each on average, that is $9,600 in trapped capital.
Use ABC Analysis to identify slow movers before they become dead stock.
8. Forecast Accuracy
How close your demand predictions are to what actually sells.
Forecast Accuracy = 1 - (|Forecast - Actual| / Actual) x 100
Benchmark: 70-85% is typical for e-commerce. Above 85% is strong. Below 60% means forecasts are not reliable enough to inform purchasing.
Every purchase order starts with a forecast. If your forecast says 100 units and reality is 60, you overspent by 67%. If reality is 150, you stocked out. Measuring accuracy is the first step to improving it.
Example: You forecast 200 units for SKU-A over 30 days. Actual sales were 170. Error = 30/170 = 17.6%. Accuracy = 82.4%. Solid, but room to improve.
For a detailed guide, see How to Measure Forecast Accuracy.
9. Order Cycle Time
The total time from placing a purchase order to receiving inventory.
Order Cycle Time = Date Received - Date Ordered
Benchmark: Domestic suppliers: 5-15 days. Overseas suppliers: 30-90 days.
Cycle time directly affects safety stock requirements. Tracking it reveals supplier reliability issues before they cause stockouts.
Example:
| Supplier | Promised Lead Time | Actual Average | Variance |
|---|---|---|---|
| Supplier A | 14 days | 16 days | +2 days |
| Supplier B | 21 days | 28 days | +7 days |
Supplier B consistently delivers late. Your safety stock for their products should use 28 days, not 21.
10. Perfect Order Rate
The percentage of orders delivered on time, in full, undamaged, and with correct documentation.
Perfect Order Rate = Perfect Orders / Total Orders x 100
Benchmark: Above 90%. Best-in-class operations hit 95%+.
This is the ultimate operational quality metric. It combines fill rate, on-time shipping, damage rate, and accuracy into one number.
Example: Out of 500 orders: 480 shipped on time, 470 were complete, 495 arrived undamaged, 490 had correct items. Perfect orders (meeting ALL criteria) = 440. Rate = 88%. The gap between your best individual metric (99%) and the combined rate (88%) shows how small failures compound.
Where to Start
Do not try to track all 10 at once. Start with these three:
- Inventory Turnover Ratio -- tells you how efficiently capital is working
- Stockout Rate -- tells you where you are losing sales
- DSI -- tells you how long products sit before selling
Once these are stable and trending the right way, add GMROI and Carrying Cost for the financial picture. Then layer in Forecast Accuracy and Fill Rate for operational depth.
| Stage | KPIs to Track | Goal |
|---|---|---|
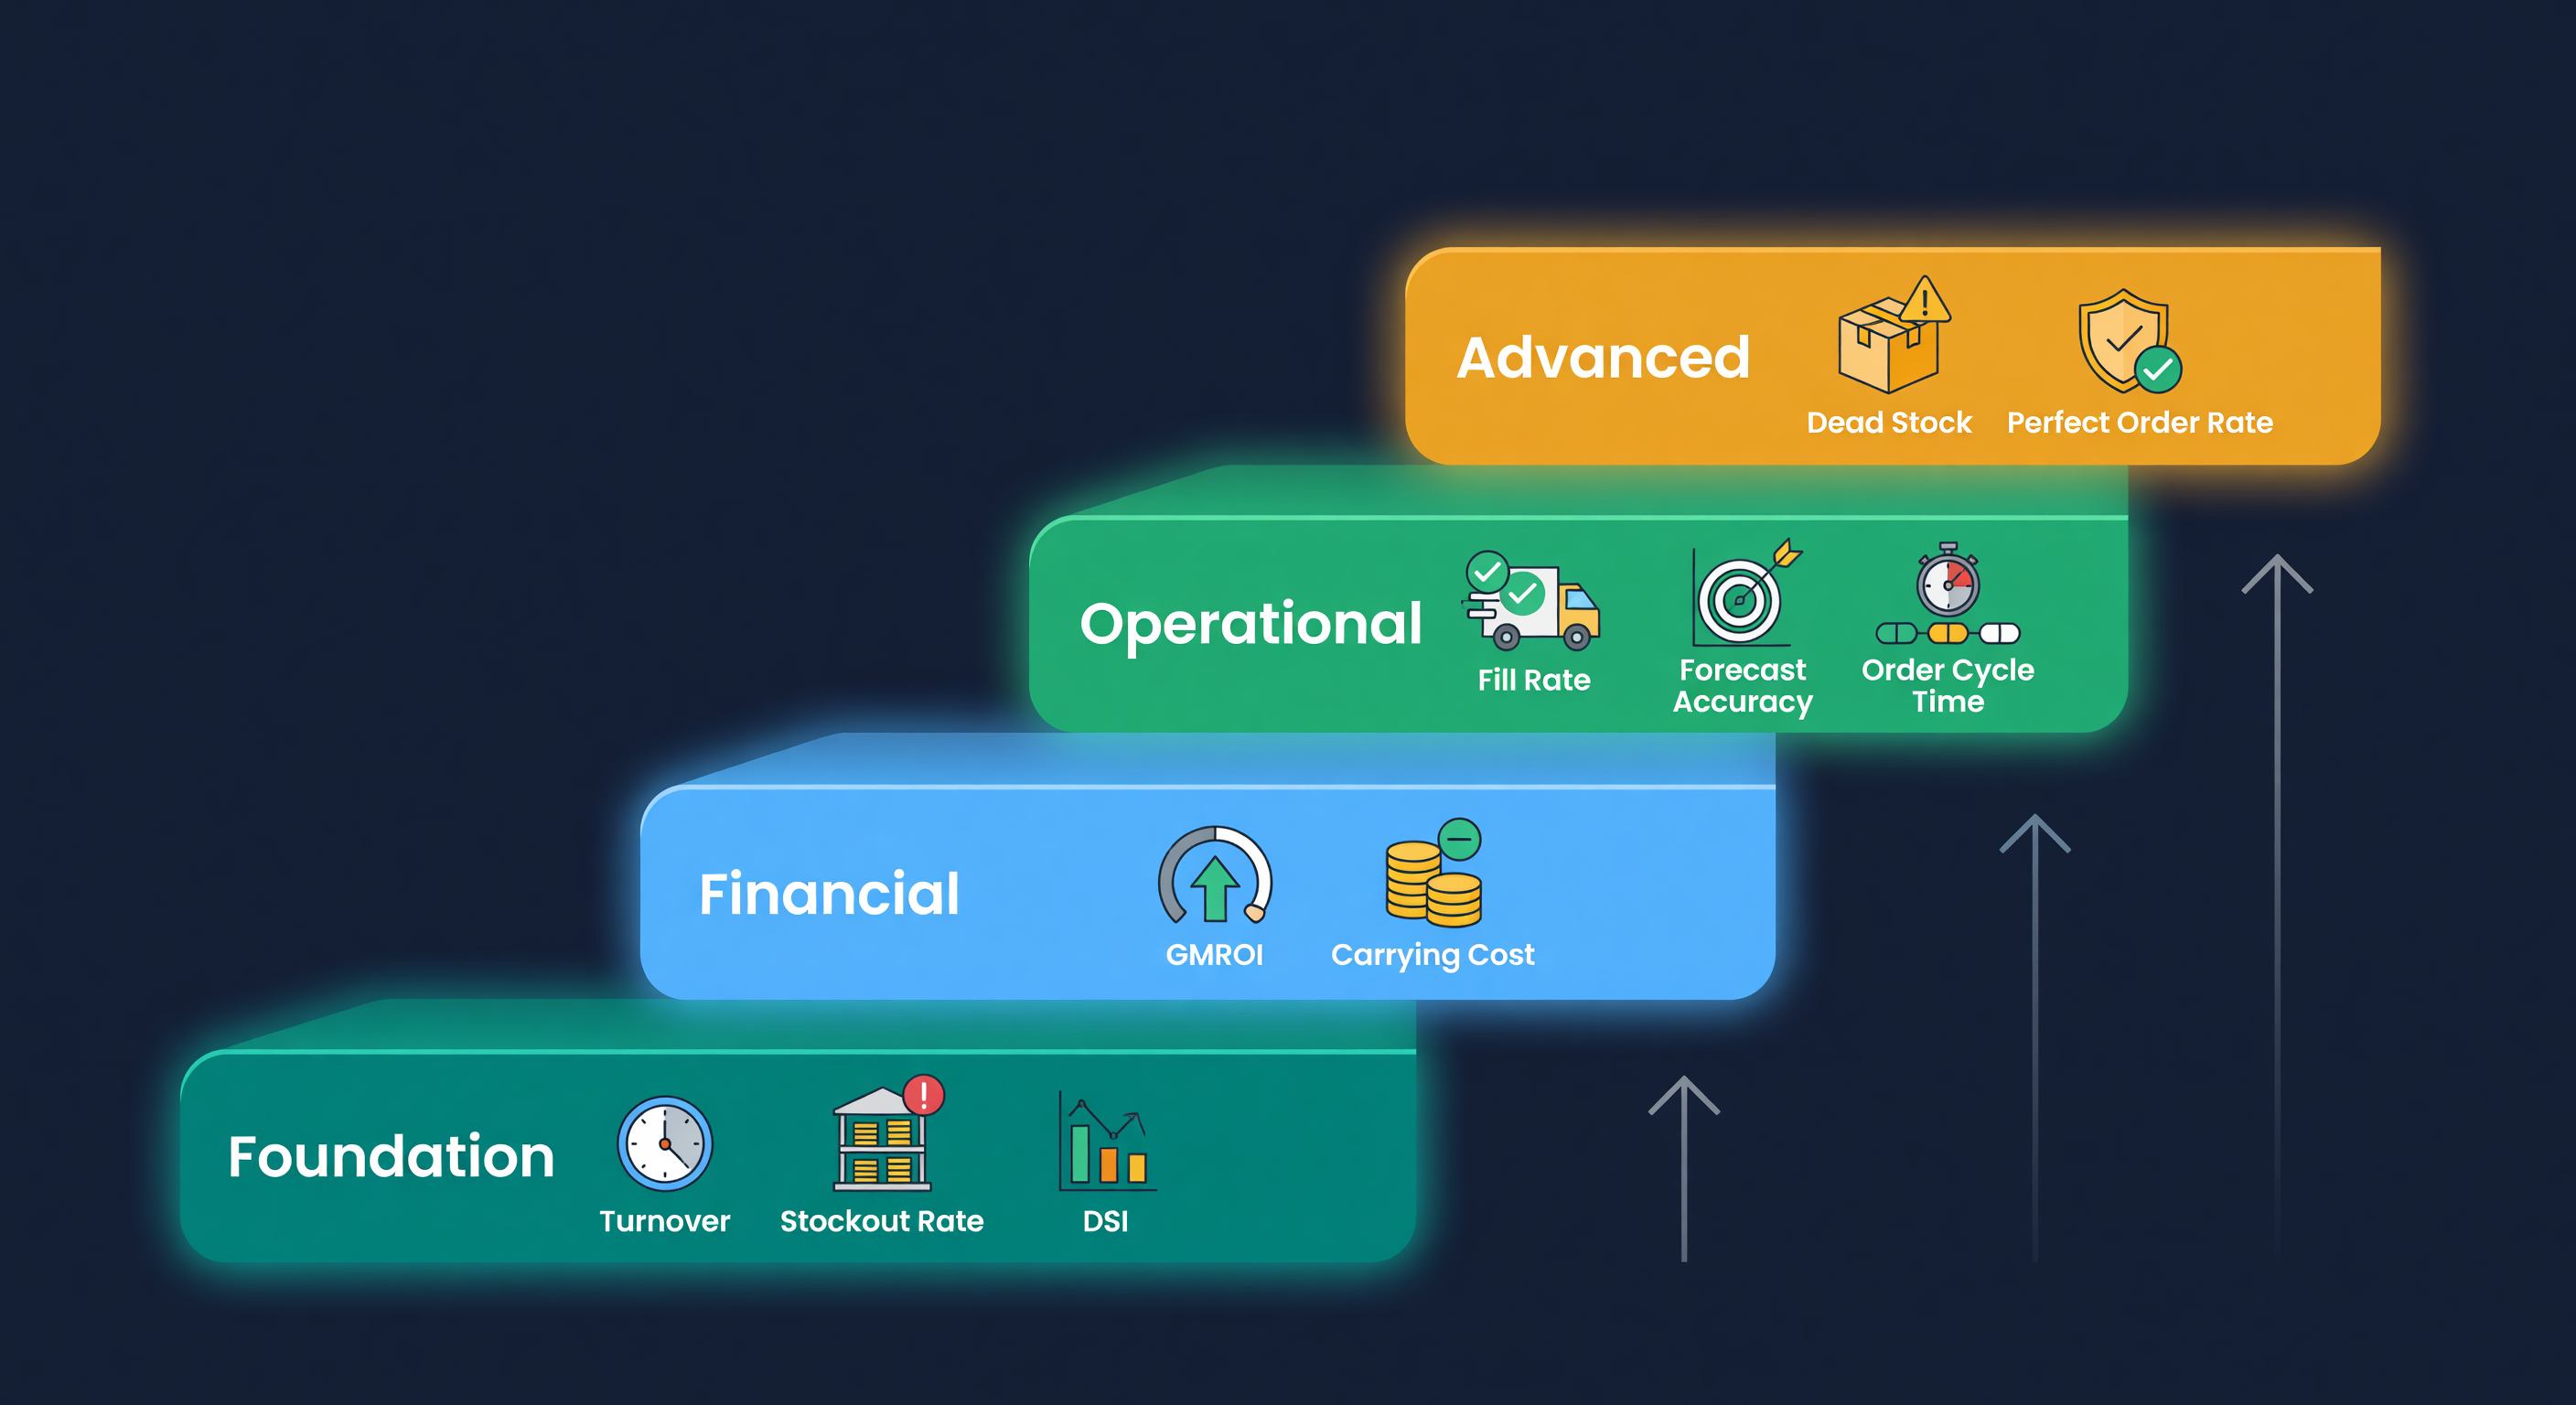
| Foundation | Turnover, Stockout Rate, DSI | Know your baseline |
| Financial | + GMROI, Carrying Cost | Understand profitability |
| Operational | + Fill Rate, Forecast Accuracy, Order Cycle Time | Improve execution |
| Advanced | + Dead Stock %, Perfect Order Rate | Tighten the whole system |
Tracking KPIs Without a Spreadsheet Marathon
We built the analytics dashboard in ReplenishRadar to calculate these metrics automatically from your Shopify and Amazon data. Turnover, stockout rate, DSI, and forecast accuracy show up at both the catalog level and per-SKU. The data quality tab flags dead stock and SKUs with degrading forecast accuracy so you can act before problems compound. Connect your stores and the numbers update with every sync -- no manual spreadsheet maintenance required.
Try ReplenishRadar free for 14 days -> and find out where your inventory is working and where it is not.
Related Reading:
Frequently Asked Questions
Get notified when it matters
Amazon and Shopify change the rules constantly. We'll email you when something affects your business.
See what your inventory is really doing
Doing $5M+ in revenue? Talk to our team
Related Posts
Stocky Is Shutting Down: Best Alternatives (2026)
Shopify discontinued Stocky. It shuts down August 2026. Here are the best Stocky alternatives for Shopify sellers, with honest pros and pricing.
How to Prevent Stockouts on Amazon
Amazon stockouts cost more than lost sales. Here's the math, the prevention playbook, and the recovery plan for FBA sellers.
What Your Stockouts Actually Cost (Per-SKU)
Most sellers track what sold but not what didn't. Per-SKU lost sales analysis reveals the exact revenue each stockout costs.