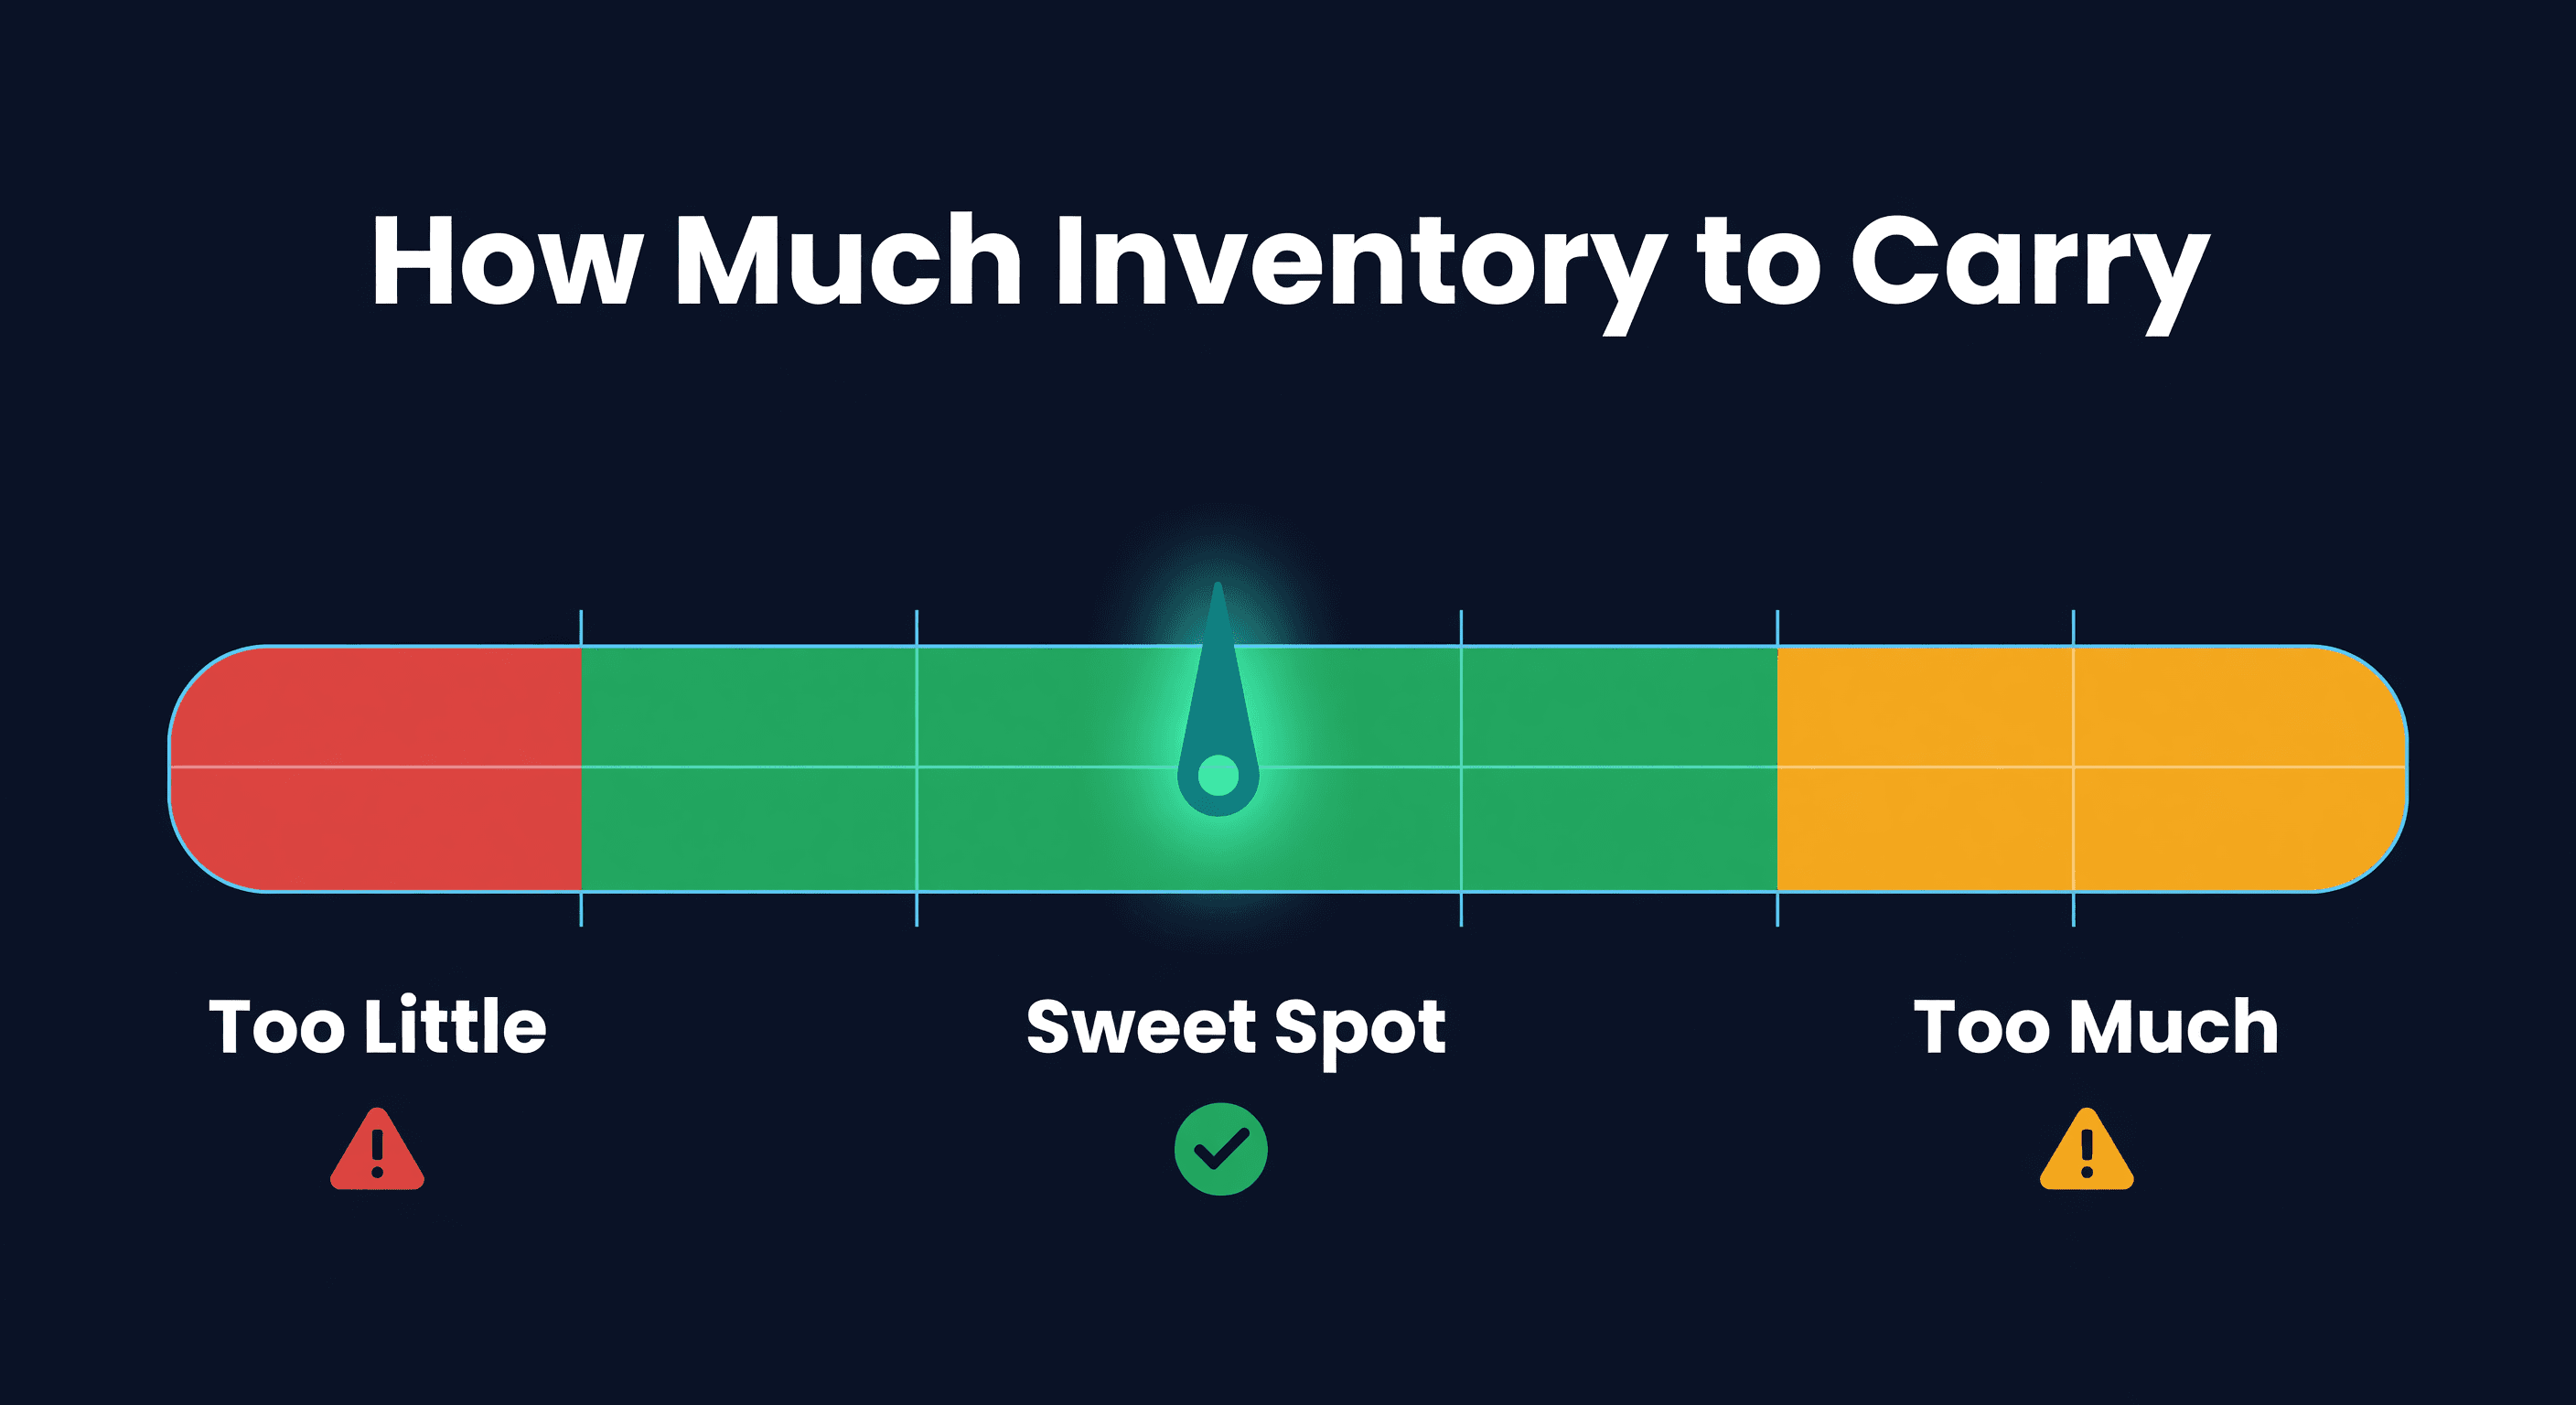
How Much Inventory Should You Carry?
Key takeaway: Carry 4-8 weeks of supply for most SKUs. Below 3 weeks risks stockouts; above 12 weeks locks up too much capital. Calculate your carrying cost (typically 20-30% of inventory value annually) to find the sweet spot.
The Answer Is Not "More"
I spent my first two years in e-commerce carrying way too much inventory. It felt safe. Running out was terrifying - a stockout on Amazon tanks your ranking, and recovering that ranking costs more than the lost sales themselves. So I overcompensated. I ordered big, ordered early, and patted myself on the back for never stocking out.
Then I did the math. I had $180,000 sitting in a warehouse and $9,000 in my bank account. My supplier invoices were due before my Amazon payouts arrived. I was profitable on my P&L and broke in real life.
Too little inventory costs you sales. Too much costs you cash. The real question is: where is the line?
Carrying Cost - The Hidden Tax
Every unit sitting in your warehouse costs you money, even when it is not moving. This is carrying cost, and most sellers underestimate it badly.
The Formula
Annual Carrying Cost = Average Inventory Value x Carrying Cost Rate
The carrying cost rate for a typical e-commerce business falls between 20% and 30% of inventory value per year. Here is what goes into it:
| Component | Typical Range | Notes |
|---|---|---|
| Storage (rent, 3PL fees) | 5-10% | Higher if you use FBA or 3PL |
| Cost of capital | 8-15% | What you would earn or pay on that cash |
| Insurance | 1-2% | Product liability, warehouse coverage |
| Shrinkage and damage | 1-3% | Depends on product type |
| Obsolescence | 2-5% | Fashion/seasonal goods are higher |
| Total | 20-30% | Use 25% if you are unsure |
Let me make that real. If you carry $500,000 in inventory at a 25% carrying rate, you are spending $125,000 per year just to hold those products. That is $10,400 per month before you sell a single unit.
This is money most sellers never see on a line item. It is spread across rent, insurance, opportunity cost, and write-offs. But it is real. I have talked to sellers who agonize over a $200/month software subscription while sitting on $15,000/month in carrying costs they have never calculated.
Weeks of Supply - The Metric That Matters
Forget total units. Forget total dollars. The number you need for every SKU is weeks of supply.
Weeks of Supply = On-Hand Units / Average Weekly Demand
A SKU with 200 units on hand and 25 units/week in demand has 8 weeks of supply. A SKU with 200 units and 5 units/week in demand has 40 weeks of supply. Same units. Wildly different situations.
Target Ranges by SKU Category
Not every SKU deserves the same coverage. Use ABC analysis to segment, then set targets:
| SKU Category | % of Revenue | Target Weeks of Supply | Why |
|---|---|---|---|
| A items (top 20%) | ~80% | 4-6 weeks | High velocity, stockout cost is enormous |
| B items (middle 30%) | ~15% | 6-10 weeks | Moderate velocity, balance cost and availability |
| C items (bottom 50%) | ~5% | 10-16 weeks | Slow movers, order less frequently in larger batches |
These are starting points, not gospel. Your actual targets depend on lead time and demand variability, which we will get to.
Lead Time Sets the Floor
You cannot carry less inventory than your lead time demands. Period.
If a supplier takes 6 weeks to deliver and you sell 30 units per week of a given SKU, you need at least 180 units just to cover the next order cycle. Drop below that number and you will stock out before the next shipment arrives.
Minimum Stock = Lead Time (weeks) x Weekly Demand
That minimum is for a perfect world where demand never spikes and suppliers never ship late. We do not live in that world. You need a buffer on top of it, which is safety stock.
Target Stock = (Lead Time x Weekly Demand) + Safety Stock
A reasonable safety stock for most e-commerce SKUs is 1-3 weeks of additional supply, depending on how variable your demand and lead times are. If your demand swings 30%+ week to week, lean toward 3 weeks. If it is steady, 1 week is fine.
Worked Example - A $500K Inventory Business
Let me walk through this with a real-ish scenario. You carry $500,000 in inventory across 400 SKUs. Your top 80 SKUs (A items) represent $400,000 of that value. Here is the breakdown:
Current State
| Metric | Value |
|---|---|
| Total inventory value | $500,000 |
| Annual carrying cost (25%) | $125,000 |
| Average turnover ratio | 4.5x |
| Average weeks of supply | 11.5 weeks |
Eleven and a half weeks of supply across the board. That sounds moderate, but the average is hiding two problems.
Digging Into the SKU-Level Data
When I see a business like this, I pull the weeks-of-supply distribution. It usually looks something like this:
| Weeks of Supply | # of SKUs | % of Inventory Value |
|---|---|---|
| 0-2 weeks (danger zone) | 35 | 12% |
| 3-6 weeks (healthy) | 95 | 28% |
| 7-12 weeks (could be tighter) | 120 | 25% |
| 13-26 weeks (overstocked) | 100 | 22% |
| 27+ weeks (likely dead stock) | 50 | 13% |
The 11.5-week average was masking $60,000 in inventory that has not sold in months and 35 SKUs about to stock out. This is the most common pattern I see. Sellers are simultaneously overstocked and understocked depending on the SKU.
The Fix
Reallocate. Do not just order more of everything.
-
The 35 danger-zone SKUs - check your reorder points. If they are A items, place an emergency order. If they are C items, maybe let them stock out and consolidate into fewer slow-moving SKUs.
-
The 150 SKUs above 13 weeks - stop reordering until they come down. Run promotions on the worst offenders. Every week a unit sits unsold at 25% carrying cost, it eats 0.48% of its own value. After a year, a quarter of the product's cost has been consumed by carrying costs alone.
-
The 95 SKUs in the 3-6 week range - these are your healthy ones. Make sure their reorder points reflect current lead times so they stay there.
If this business moved from 11.5 weeks average to 7 weeks average, the inventory investment drops from $500,000 to roughly $304,000. That frees up $196,000 in working capital. At a 25% carrying rate, it also saves $49,000 per year in carrying costs.
That is not a theoretical number. That is cash back in the bank.
Demand Variability Changes the Math
The formulas above assume demand is predictable. It is not.
A SKU that sells exactly 50 units every week needs less safety stock than one that sells 20 one week and 80 the next. Both average 50, but the second one will stock you out if you plan for the average.
Standard deviation is how you measure this. (ReplenishRadar calculates this per SKU from your sales history, but if you are doing it in a spreadsheet, use =STDEV() on 12-16 weeks of weekly sales data.) The higher the standard deviation relative to the mean, the more safety stock you need.
I keep it simple with a coefficient of variation (CV) threshold:
CV = Standard Deviation / Average Weekly Demand
- CV under 0.3 - stable demand, 1 week of safety stock is fine
- CV 0.3 to 0.6 - moderate variability, budget 2 weeks
- CV above 0.6 - volatile, budget 3+ weeks or order more frequently
The Real Answer
There is no single "right" amount of inventory. But there is a right process: calculate weeks of supply per SKU, set targets by category, account for lead time and variability, and then measure your actual position against those targets weekly.
Most sellers who go through this exercise for the first time find they can cut 15-25% of their inventory investment without any increase in stockouts. The fat is almost always in the long tail - C items over-ordered months ago that nobody reviewed.
The number that sticks: every $100,000 in excess inventory costs you $25,000 a year in carrying costs, plus the opportunity cost of what you could have done with that capital. Do the math on your own numbers. You will probably not like what you find.
Try ReplenishRadar free for 14 days ->
Related Reading:
Frequently Asked Questions
Get notified when it matters
Amazon and Shopify change the rules constantly. We'll email you when something affects your business.
See what your inventory is really doing
Doing $5M+ in revenue? Talk to our team
Related Posts
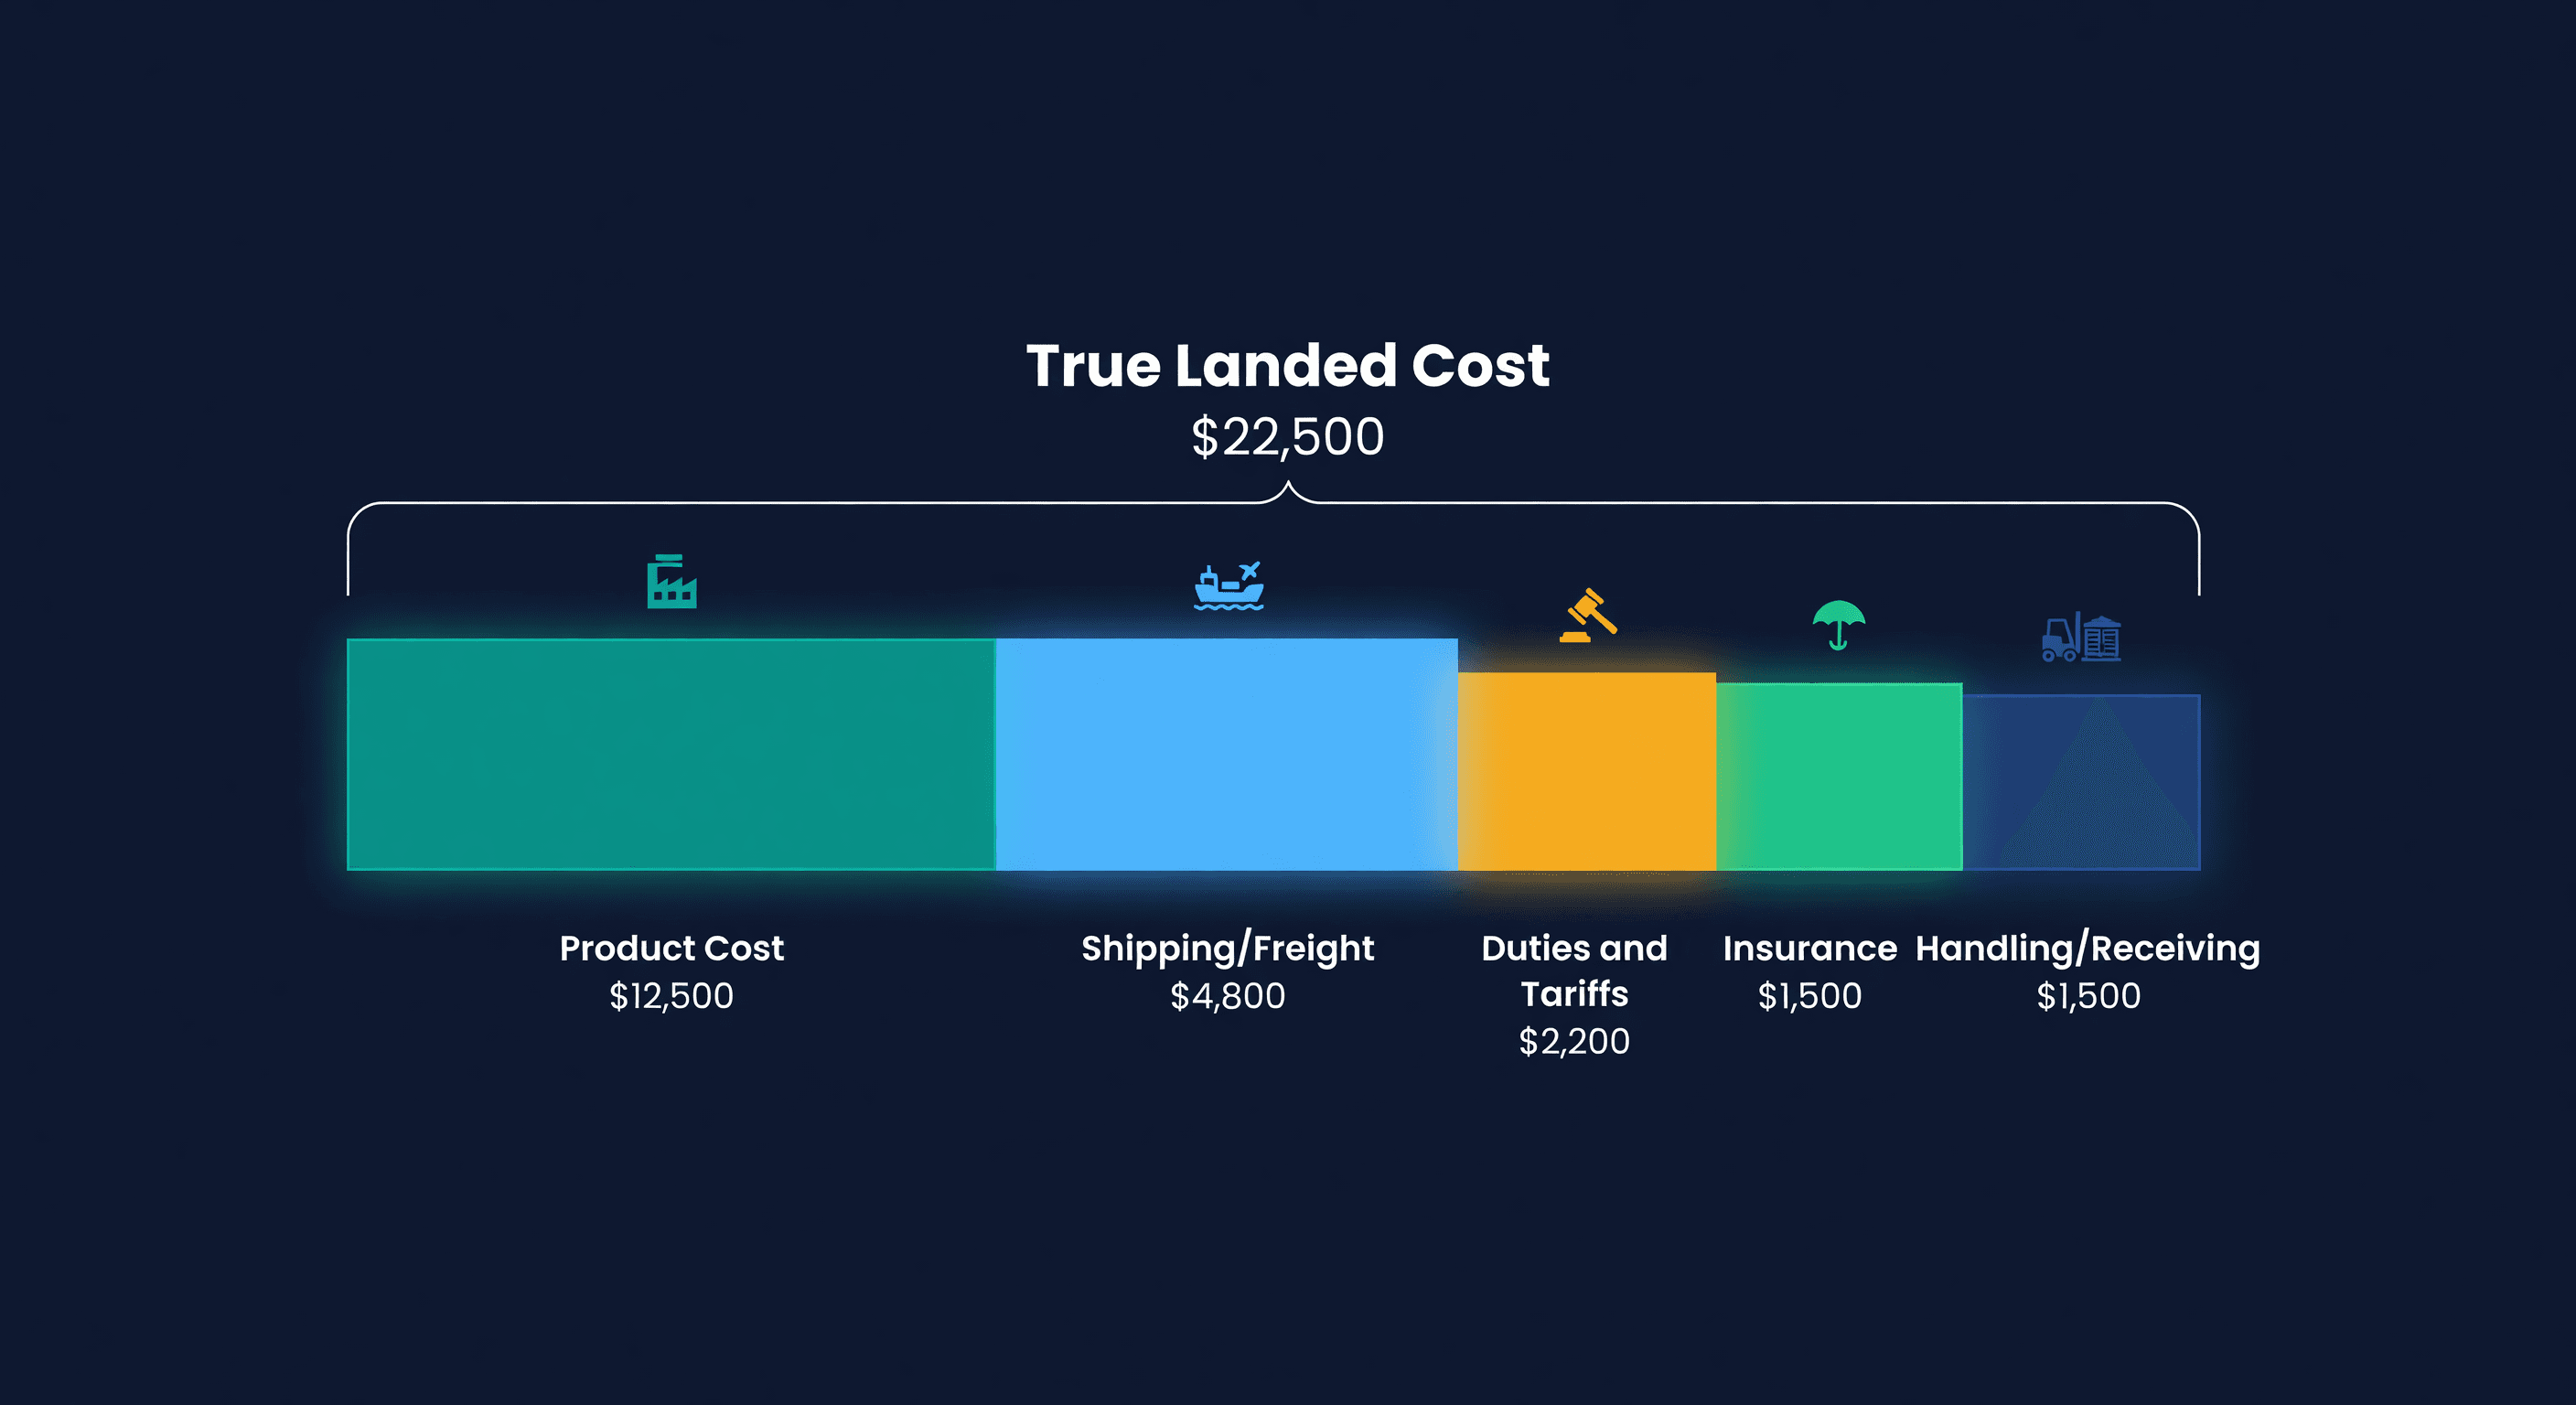
How to Calculate True Landed Cost
Your supplier invoice is not your real cost. Here's the landed cost formula with a worked example showing every hidden expense per unit.
7 Inventory Mistakes That Kill Cash Flow
The 7 most common inventory management mistakes that drain cash. Real numbers on what each one costs and how to fix it.
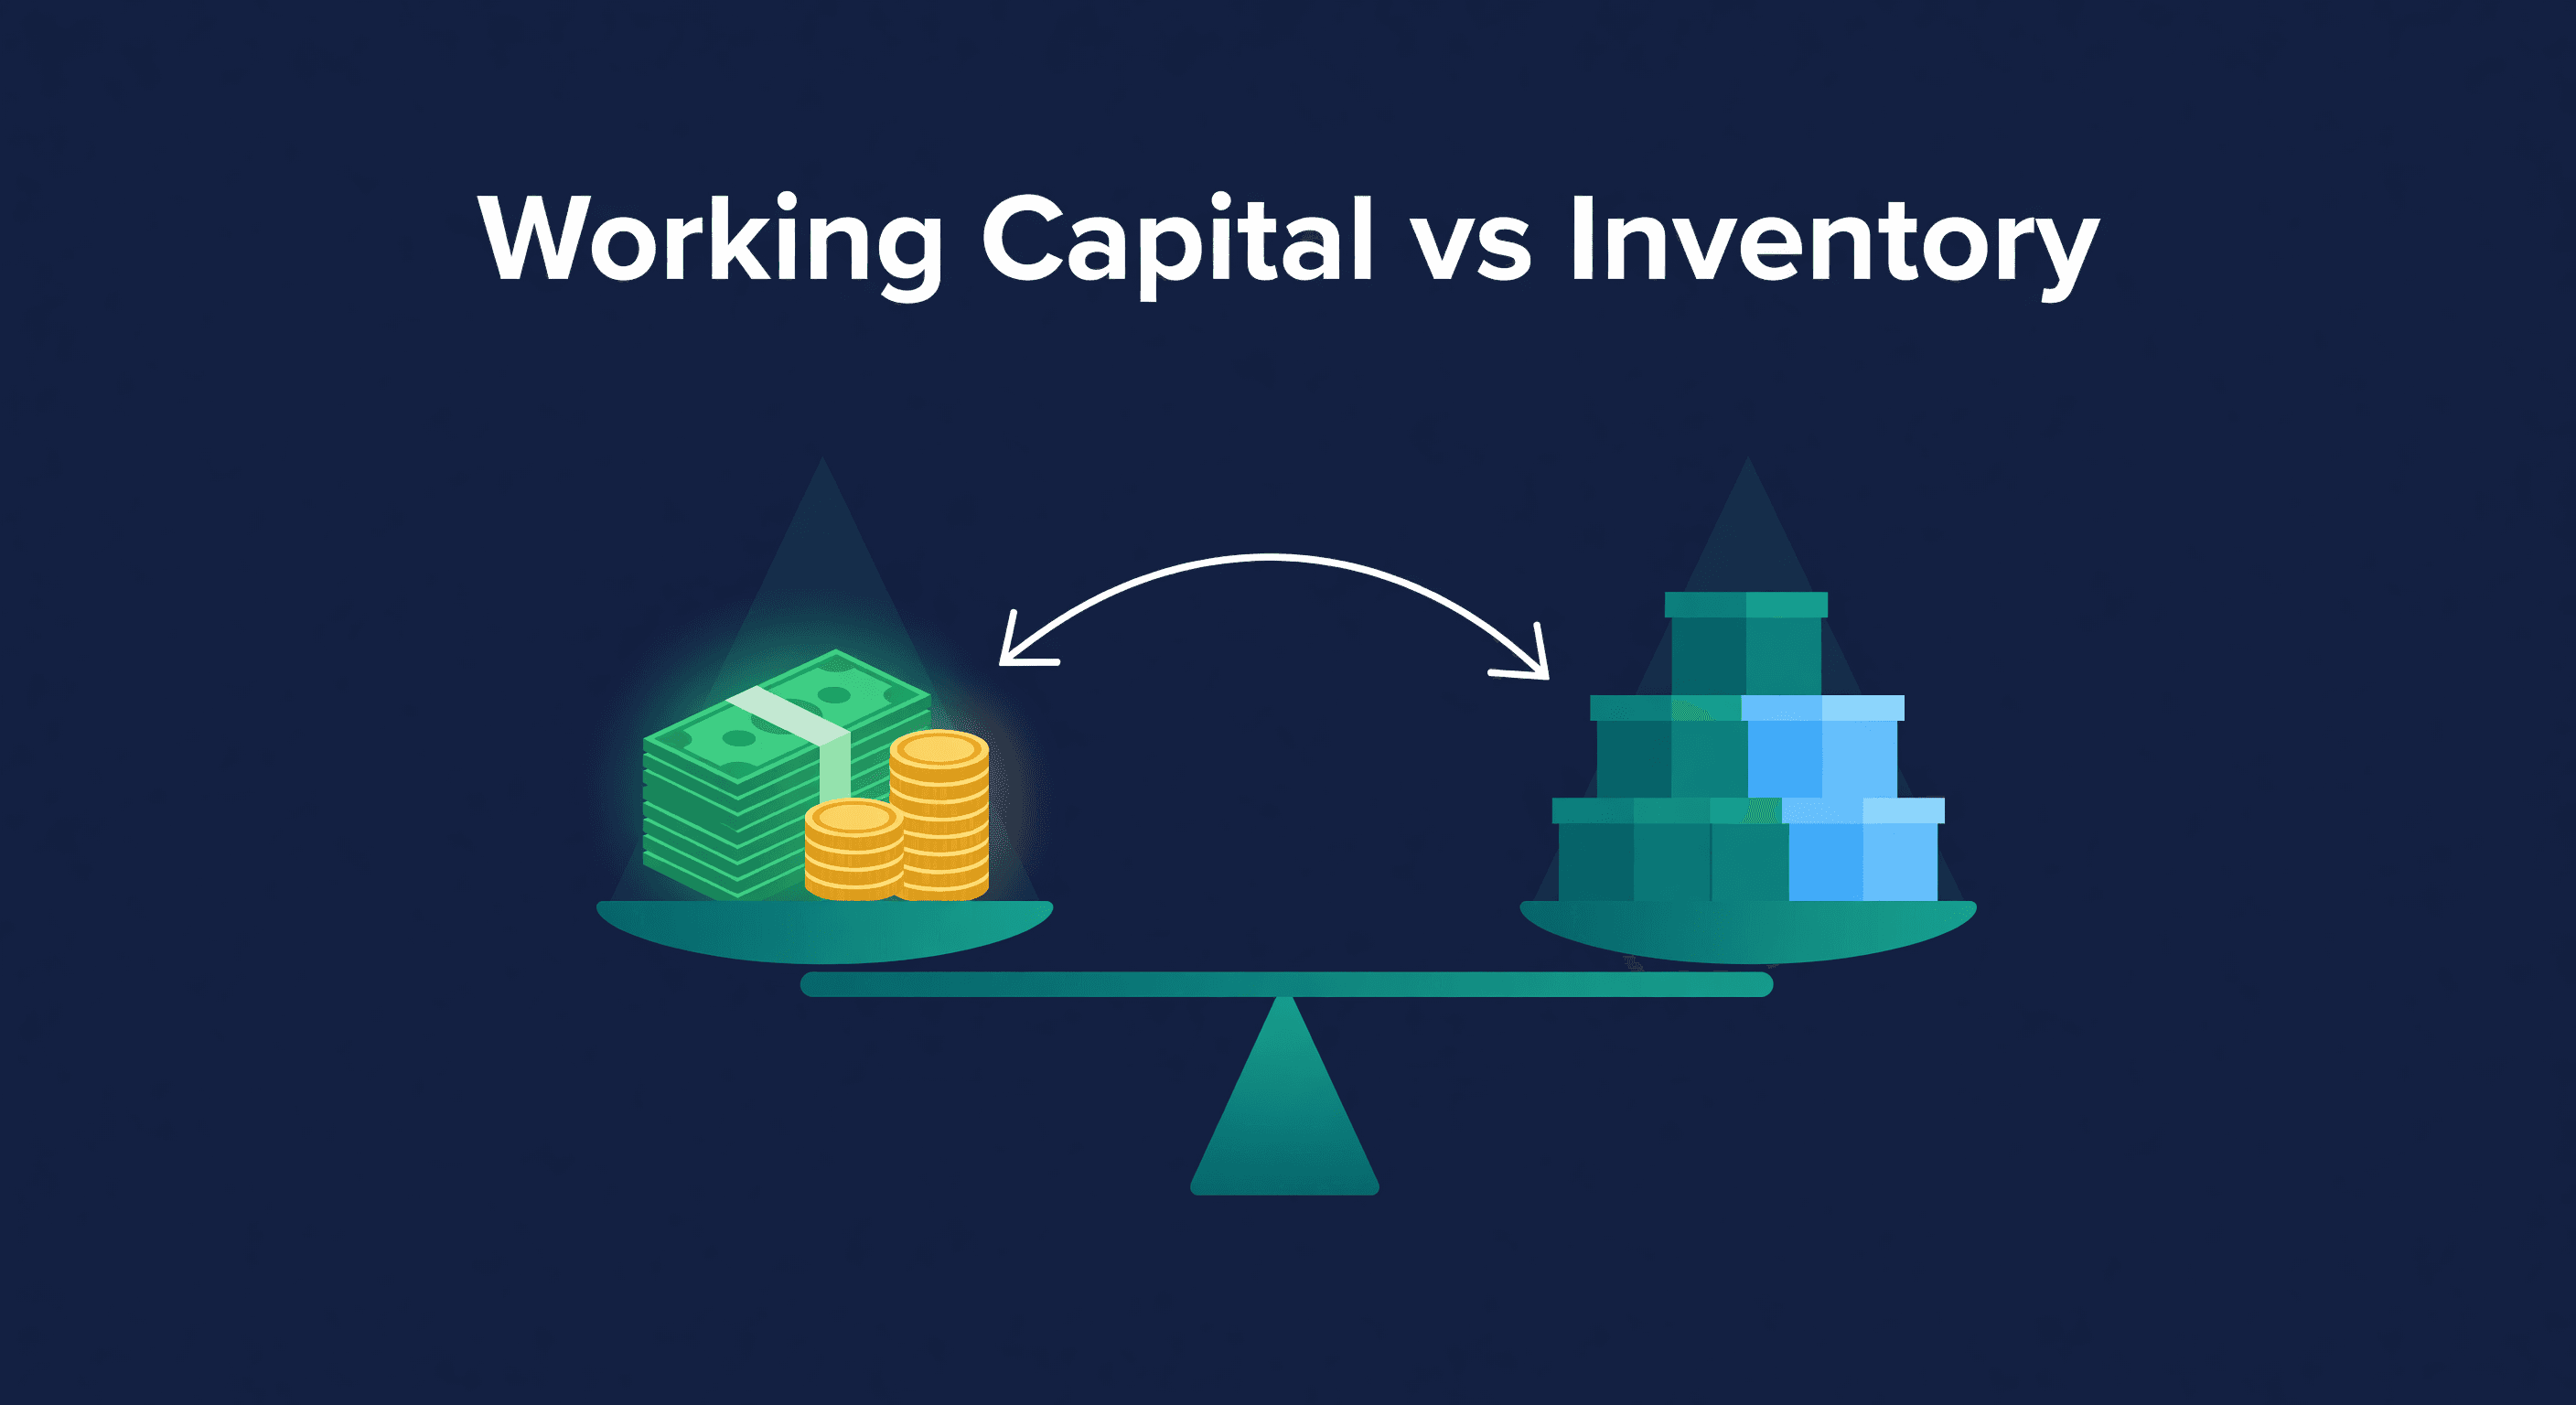
Working Capital and Inventory: Improve E-commerce Cash Flow
How inventory ties up working capital and what to do about it. Reduce tied-up cash while keeping products in stock across Shopify and Amazon.
