Why Your Reorder Points Are Wrong After an Ad Pause
On April 15, thousands of Amazon sellers joined an ad boycott. They paused Sponsored Products, Sponsored Brands, and Sponsored Display across their accounts. Some for a day. Some for a week. A few are still dark.
The boycott got attention. What did not get attention is the inventory math that broke while the ads were off.
I have been thinking about this since the first Reddit threads popped up. Not the boycott itself -- that is a pricing and margin conversation. What concerns me is what happens to reorder points when you yank 30-50% of your demand signal out of the data for a week and then put it back. Because the answer is: your reorder points drop, your next PO is too small, and you stock out six weeks later wondering what happened.
The Problem Nobody Is Talking About
Every reorder point formula uses some version of demand velocity. Units sold per day, per week, however you slice it. The standard formula:
Reorder Point = (Average Daily Velocity × Lead Time) + Safety Stock
Simple enough. The problem is where that "average daily velocity" comes from. For most sellers and most tools, it is a trailing average. The last 14, 30, or 60 days of sales data.
When you pause ads, your sales drop. Not because demand changed. Not because the market shifted. Because you turned off the traffic source that was driving 30-50% of your conversions. The product is still good. Customers still want it. They just cannot find it because it dropped from position 3 to page 4.
Your trailing average does not know any of this. It sees fewer sales. It calculates a lower velocity. It produces a lower reorder point. And that lower reorder point drives your next purchase order.
The Math
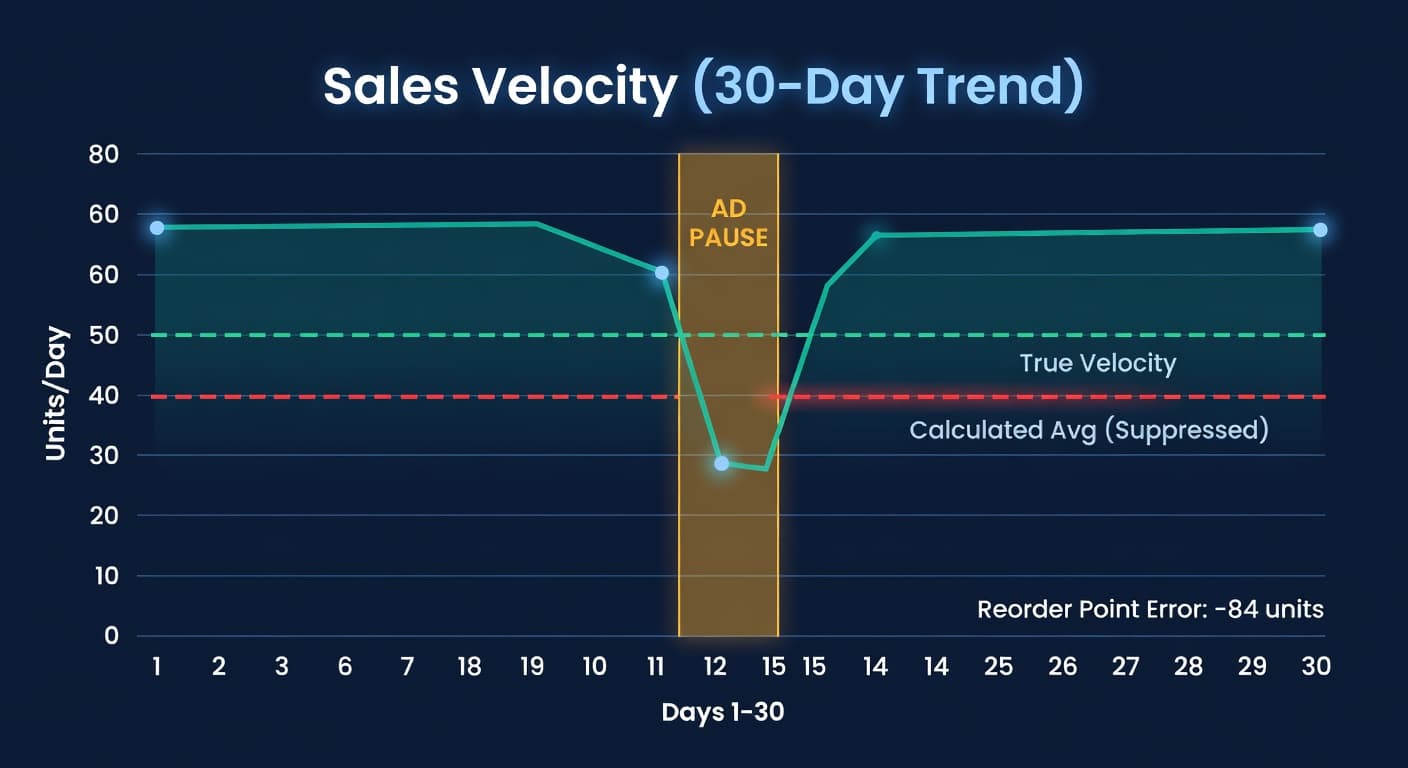
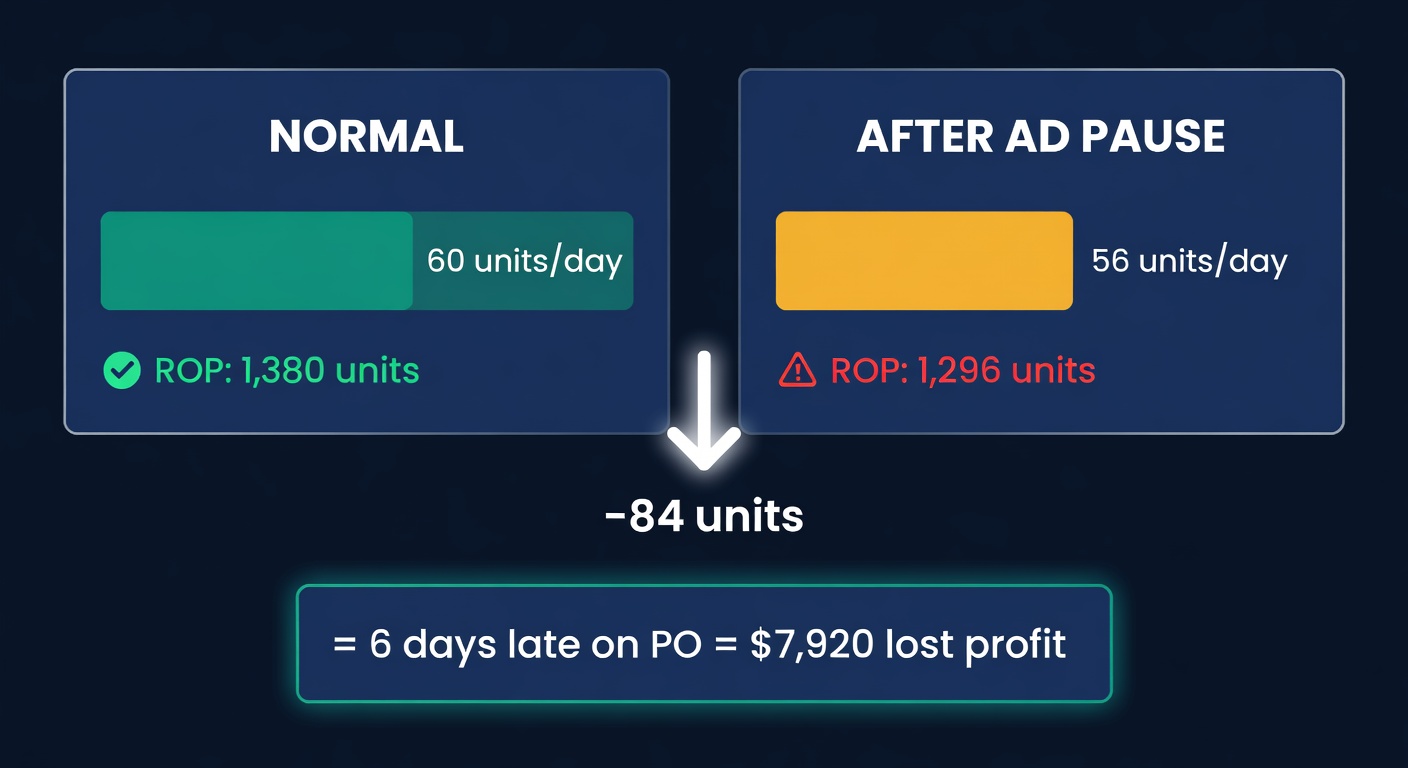
Here is a real scenario. A seller runs a SKU that averages 60 units per day. About 40% of those sales come from Sponsored Products. She uses a 30-day trailing average for her velocity calculations.
Normal 30-day period:
| Metric | Value |
|---|---|
| Daily velocity (with ads) | 60 units |
| 30-day total | 1,800 units |
| 30-day avg daily velocity | 60 units/day |
| Lead time | 21 days |
| Safety stock | 120 units |
| Reorder point | 1,380 units |
She pauses ads for 5 days. During those 5 days, ad-driven sales disappear. Organic sales stay roughly flat.
30-day period including a 5-day ad pause:
| Metric | Value |
|---|---|
| 25 normal days × 60 units | 1,500 units |
| 5 pause days × 36 units (organic only) | 180 units |
| 30-day total | 1,680 units |
| 30-day avg daily velocity | 56 units/day |
| Lead time | 21 days |
| Safety stock | 120 units |
| Reorder point | 1,296 units |
Her reorder point dropped by 84 units. That is a 6% decline from a 5-day pause.
Seems small? It is not. Here is why.
Why 84 Units Matters
Her inventory was at 1,340 units when the pause happened. Under normal math, she would have hit her reorder point of 1,380 units two days ago. The PO would already be placed. The supplier would be packing it.
With the suppressed velocity, her reorder point is now 1,296. She is sitting at 1,340. Above the threshold. No PO triggered. No order placed.
She will not cross 1,296 until four days from now. That is a six-day delay on a purchase order for a SKU with a 21-day lead time. Six days late placing the order means six days of potential stockout on the back end.
At 60 units per day and a $22 margin per unit, that is $7,920 in lost profit. From a 5-day ad pause.
And that assumes she turned ads back on after 5 days. Sellers who paused for the full week or longer? The distortion is proportionally worse.
| Pause Duration | Velocity Drop | ROP Drop | Potential Lost Revenue |
|---|---|---|---|
| 3 days | -4.0% | -50 units | ~$3,960 |
| 5 days | -6.7% | -84 units | ~$7,920 |
| 7 days | -9.3% | -117 units | ~$11,088 |
| 14 days | -18.7% | -235 units | ~$18,480 |
The longer the pause, the deeper the velocity suppression, and the longer the poisoned data sits in your trailing window.
It Gets Worse With Weighted Averages
Some tools use weighted moving averages that put more emphasis on recent data. In normal conditions, that is smart. Recent sales matter more than sales from 25 days ago. During an ad pause, it works against you.
If your tool weights the last 7 days at 40% and the prior 23 days at 60%, a 5-day pause during the recent window tanks your velocity harder than a simple average would:
| Method | Calculated Velocity | ROP |
|---|---|---|
| Simple 30-day avg | 56.0 units/day | 1,296 |
| Weighted (recent-heavy) | 53.1 units/day | 1,235 |
| True demand | 60.0 units/day | 1,380 |
The weighted average drops your reorder point by 145 units below the true level. Almost twice the distortion of the simple average.
I wrote about the mirror image of this problem in flash sale outlier detection. A flash sale inflates velocity. An ad pause deflates it. Same root cause: your demand data contains noise that does not represent real, ongoing demand. The formula does not know the difference.
What to Do About It
Three options, from manual to automated.
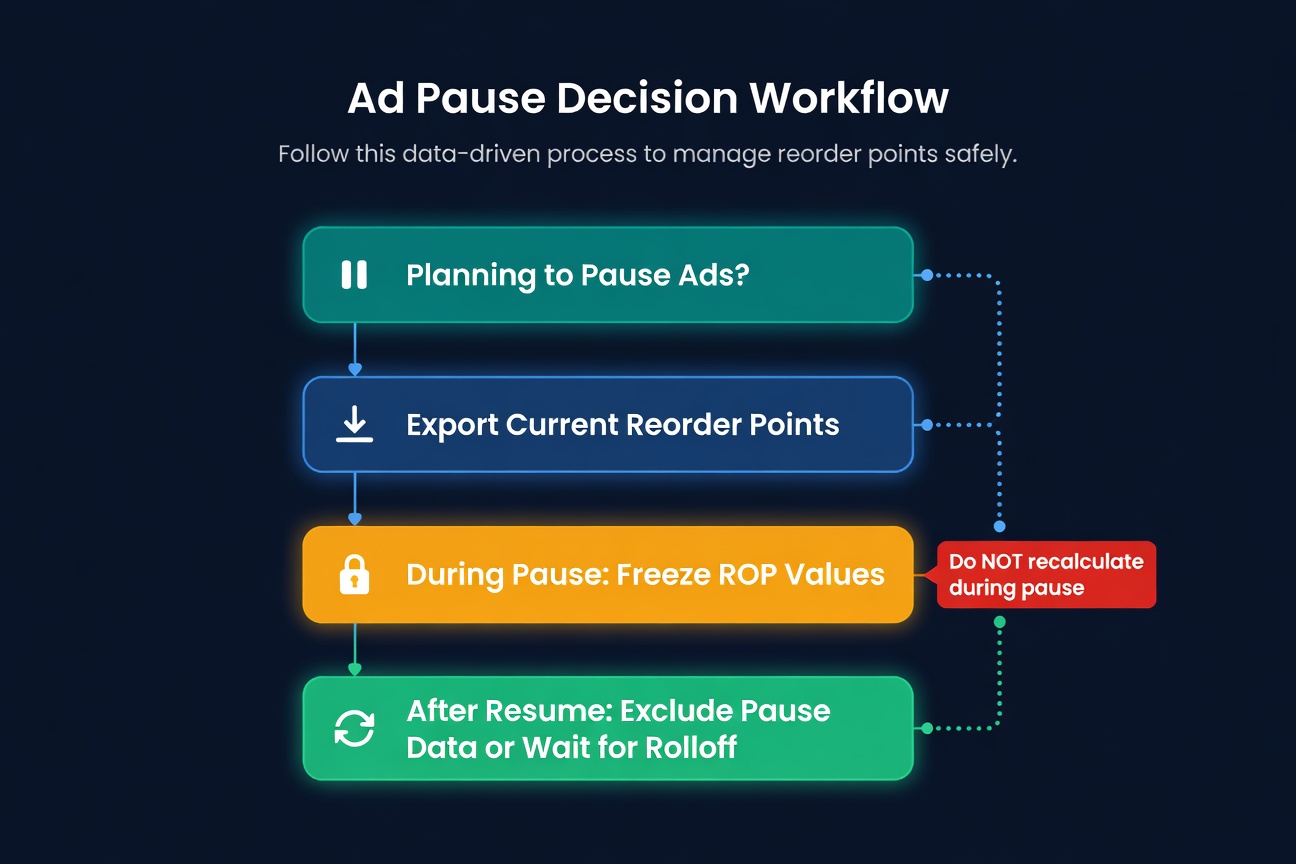
Option 1: Freeze your reorder points before pausing.
If you know you are pausing ads (for a boycott, budget cut, or seasonal strategy), screenshot or export your current reorder points before you turn anything off. Do not let your tool or spreadsheet recalculate during the pause window. Use the frozen values for PO decisions until the pause data rolls out of your trailing window.
This is crude. It works.
Option 2: Manually exclude pause-period data.
After the pause ends, go into your velocity calculations and replace the pause-period sales with your pre-pause daily average. If you were doing 60 units/day before the pause, overwrite those 5 low days with 60 each. Then let the formula run.
This takes 15-30 minutes per SKU if you are in spreadsheets. For a 200-SKU catalog, you are looking at a full day of data cleanup. Which is why most sellers will not do it. Which is why most sellers will under-order.
Option 3: Use a tool with outlier detection.
This is the approach that actually scales. The same pre-processing that catches flash sale spikes can catch ad-pause dips, if the tool knows to look in both directions. A demand data point that is 2+ standard deviations below the norm gets flagged the same way a spike does.
The key difference: most tools only look for upward outliers. A 5x spike is obvious. A 40% dip looks like it could be a real demand shift. Maybe the product fell out of favor, maybe a competitor launched, maybe the category is cooling. Distinguishing "I turned off ads" from "demand actually dropped" requires either explicit user input or pattern recognition that correlates the timing with ad spend data.
The Timing Trap
The worst part of this problem is when it hits. You do not feel it during the ad pause. You feel it 4-8 weeks later, when the undersized PO runs out before the next shipment arrives.
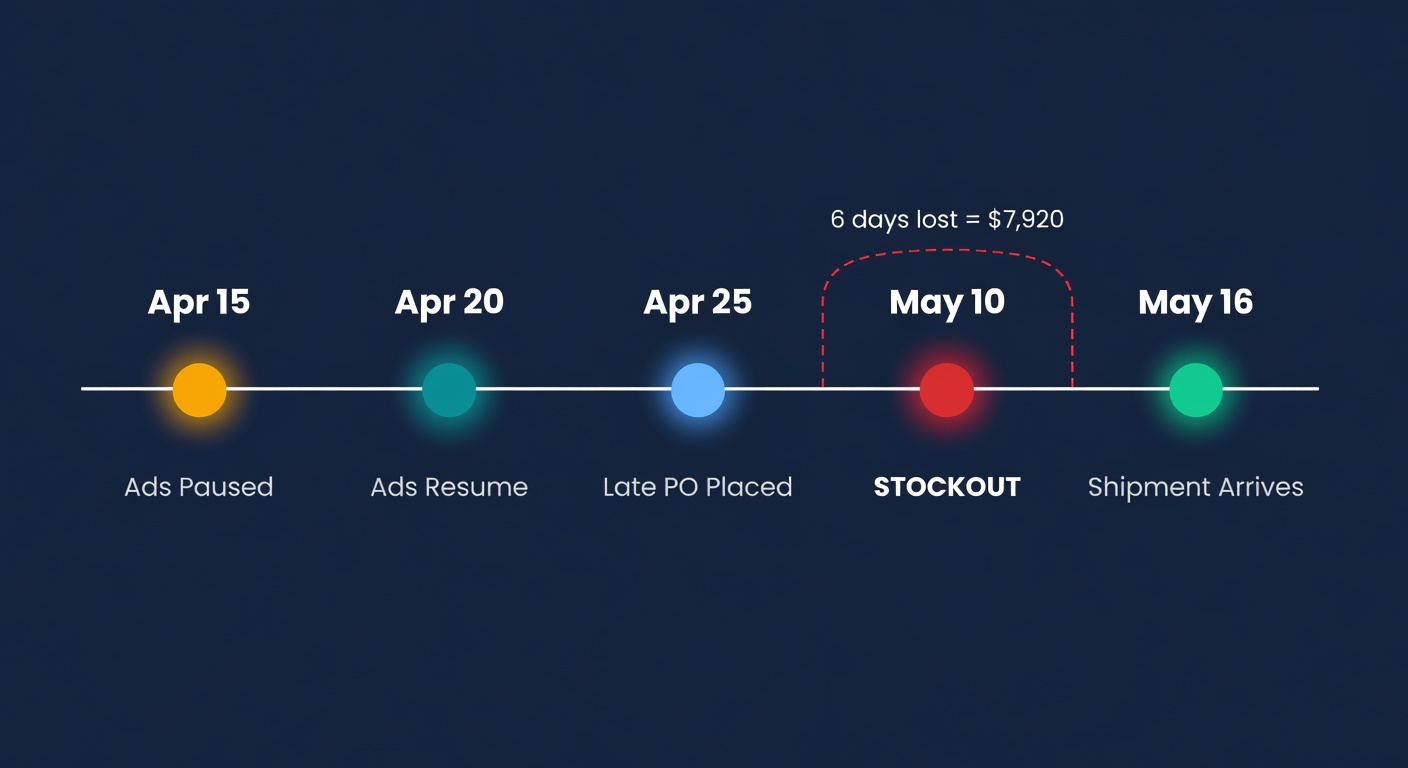
Here is the timeline for our example seller:
- April 15: Pauses ads for the boycott.
- April 20: Resumes ads. Sales return to normal within 48 hours.
- April 22: Reorder point recalculates based on trailing 30 days. Still suppressed because 5 days of low data are in the window.
- April 25: Inventory crosses the suppressed ROP (1,296). PO placed. Four days later than it should have been.
- May 16: Shipment arrives. But she needed 6 more days of coverage. She stocks out May 10-16.
- May 10-16: Six days of zero sales on a SKU doing $1,320/day in revenue. Amazon's ranking algorithm notices.
The boycott was in April. The stockout is in May. By the time she connects the two, the damage is done.
Who Gets Hit Hardest
Not everyone is equally exposed. The sellers most at risk:
High ad dependency. If ads drive 50%+ of your unit sales, a pause cuts your measured velocity in half. Sellers with strong organic rankings (30%+ organic) have more cushion.
Long lead times. A 7-day supplier can recover from a late PO. A 45-day supplier from China cannot. If your lead time is over 21 days, the PO delay from a velocity dip almost certainly creates a stockout window.
Thin safety stock. If your safety stock covers 3-4 days, a 6-day PO delay blows right through it. Sellers running 10+ days of safety stock have a buffer. Most sellers in this revenue range carry 5-7 days. Not enough.
Concentrated catalogs. A 15-SKU seller gets hit harder than a 500-SKU seller because each SKU's reorder point matters more. There is no "other products" covering the revenue gap.
ReplenishRadar and Ad-Pause Data
We built our forecasting engine with a pre-processing layer that catches statistical anomalies before they reach the demand model. The same mechanism that prevents a flash sale from inflating your forecast also flags unusual demand dips.
When your sales drop 40% overnight and snap back 5 days later, that pattern does not look like a trend change. It looks like a temporary disruption. The system flags it, and your reorder point calculations use cleaned demand data instead of raw data that includes the dip. No spreadsheet surgery. No manual overrides.
The timing matters here. You do not want to discover the problem when the PO lands short. You want to catch it while there is still time to adjust the order.
Try ReplenishRadar free for 14 days ->
The Broader Pattern
This is not just an ad boycott problem. It is a demand signal contamination problem. Anything that temporarily suppresses or inflates your sales without reflecting real demand change will poison your reorder points:
- Ad pauses (the current one)
- Platform outages (Amazon had a 6-hour checkout outage in Q1)
- Listing suspensions (your detail page goes down for 3 days)
- Seasonal promotions ending (post-Prime Day crash)
- Competitor stockouts (your sales spike, then normalize when they restock)
Every one of these injects noise into your velocity data. Every one of them shifts your reorder point in a direction that does not reflect actual demand. The sellers who build systems to filter this noise make better purchasing decisions. The ones who do not keep getting surprised by stockouts that "came out of nowhere."
They did not come out of nowhere. They came out of dirty data.
Related Reading:
Frequently Asked Questions
Get notified when it matters
Amazon and Shopify change the rules constantly. We'll email you when something affects your business.
See what your inventory is really doing
Doing $5M+ in revenue? Talk to our team
Related Posts
How to Set Up Multi-Location Inventory (Without an ERP)
Managing inventory across warehouses, FBA, and stores doesn't require an ERP. Learn how to set up multi-location tracking that actually works.
Amazon GWD: Fee Math, Pipeline Risk, and Who It Fits
Amazon's new Global Warehousing and Distribution program stores inventory in Shenzhen. Here's the real cost breakdown and what sellers should watch for.
Amazon's New 3.5% FBA Surcharge: Per-Unit Math
Amazon adds a 3.5% surcharge to FBA fulfillment fees starting April 17, 2026. Here's what it costs per unit and how it changes your reorder math.