Consolidating Multiple Amazon Accounts Into One View
Key takeaway: Running multiple Amazon accounts without consolidated visibility wastes 8-15% per unit in missed volume discounts and costs hours per week in manual report reconciliation. A unified dashboard eliminates duplicate work and improves supplier negotiation leverage.
The Login Problem Nobody Talks About
Here is what managing two Amazon seller accounts looks like at 8 AM on a Monday:
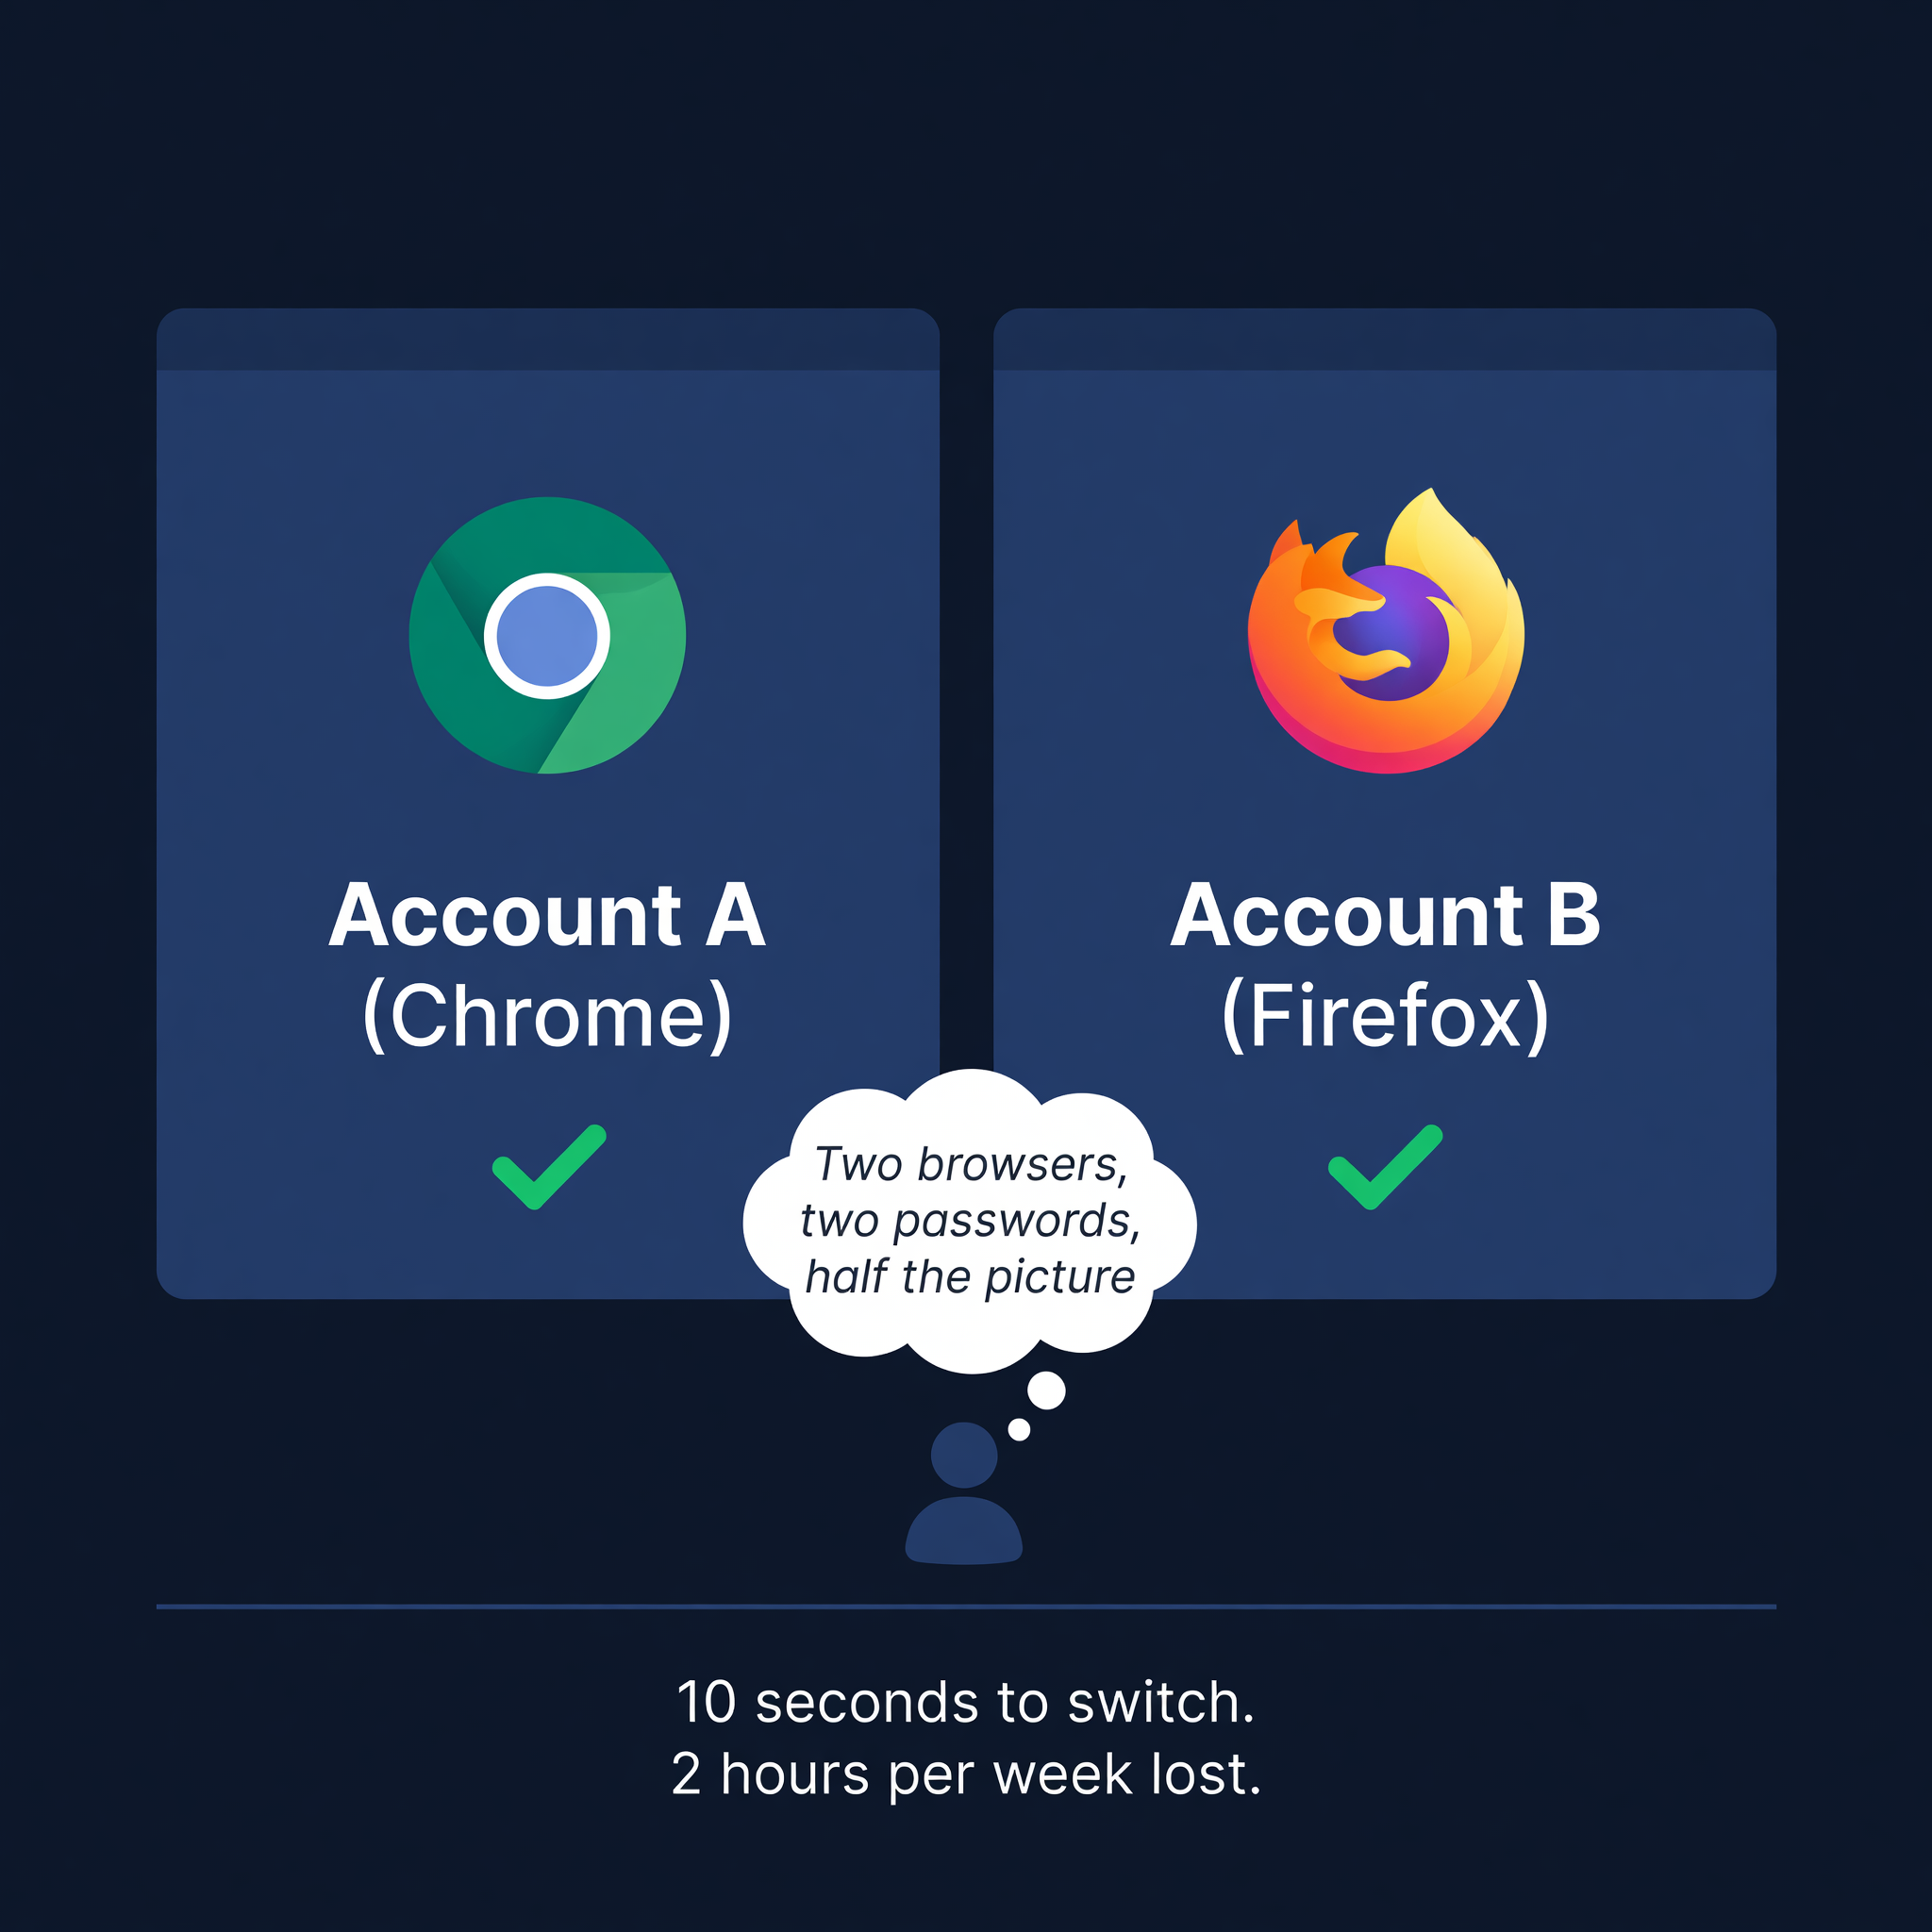
Log into Account A. Check inventory health. Export the restock report. Open a new browser window (not just a new tab -- Seller Central's session management fights you). Log into Account B. Check inventory health. Export that restock report. Open both CSVs side by side. Try to figure out what to order from suppliers who serve both accounts.
I know sellers who keep two entirely separate browsers installed -- Chrome for Account A, Firefox for Account B -- because Seller Central's cookies collide. One seller told me she uses incognito windows and has the passwords muscle-memorized so she can switch in under 10 seconds. She was proud of this. She should not have to be.
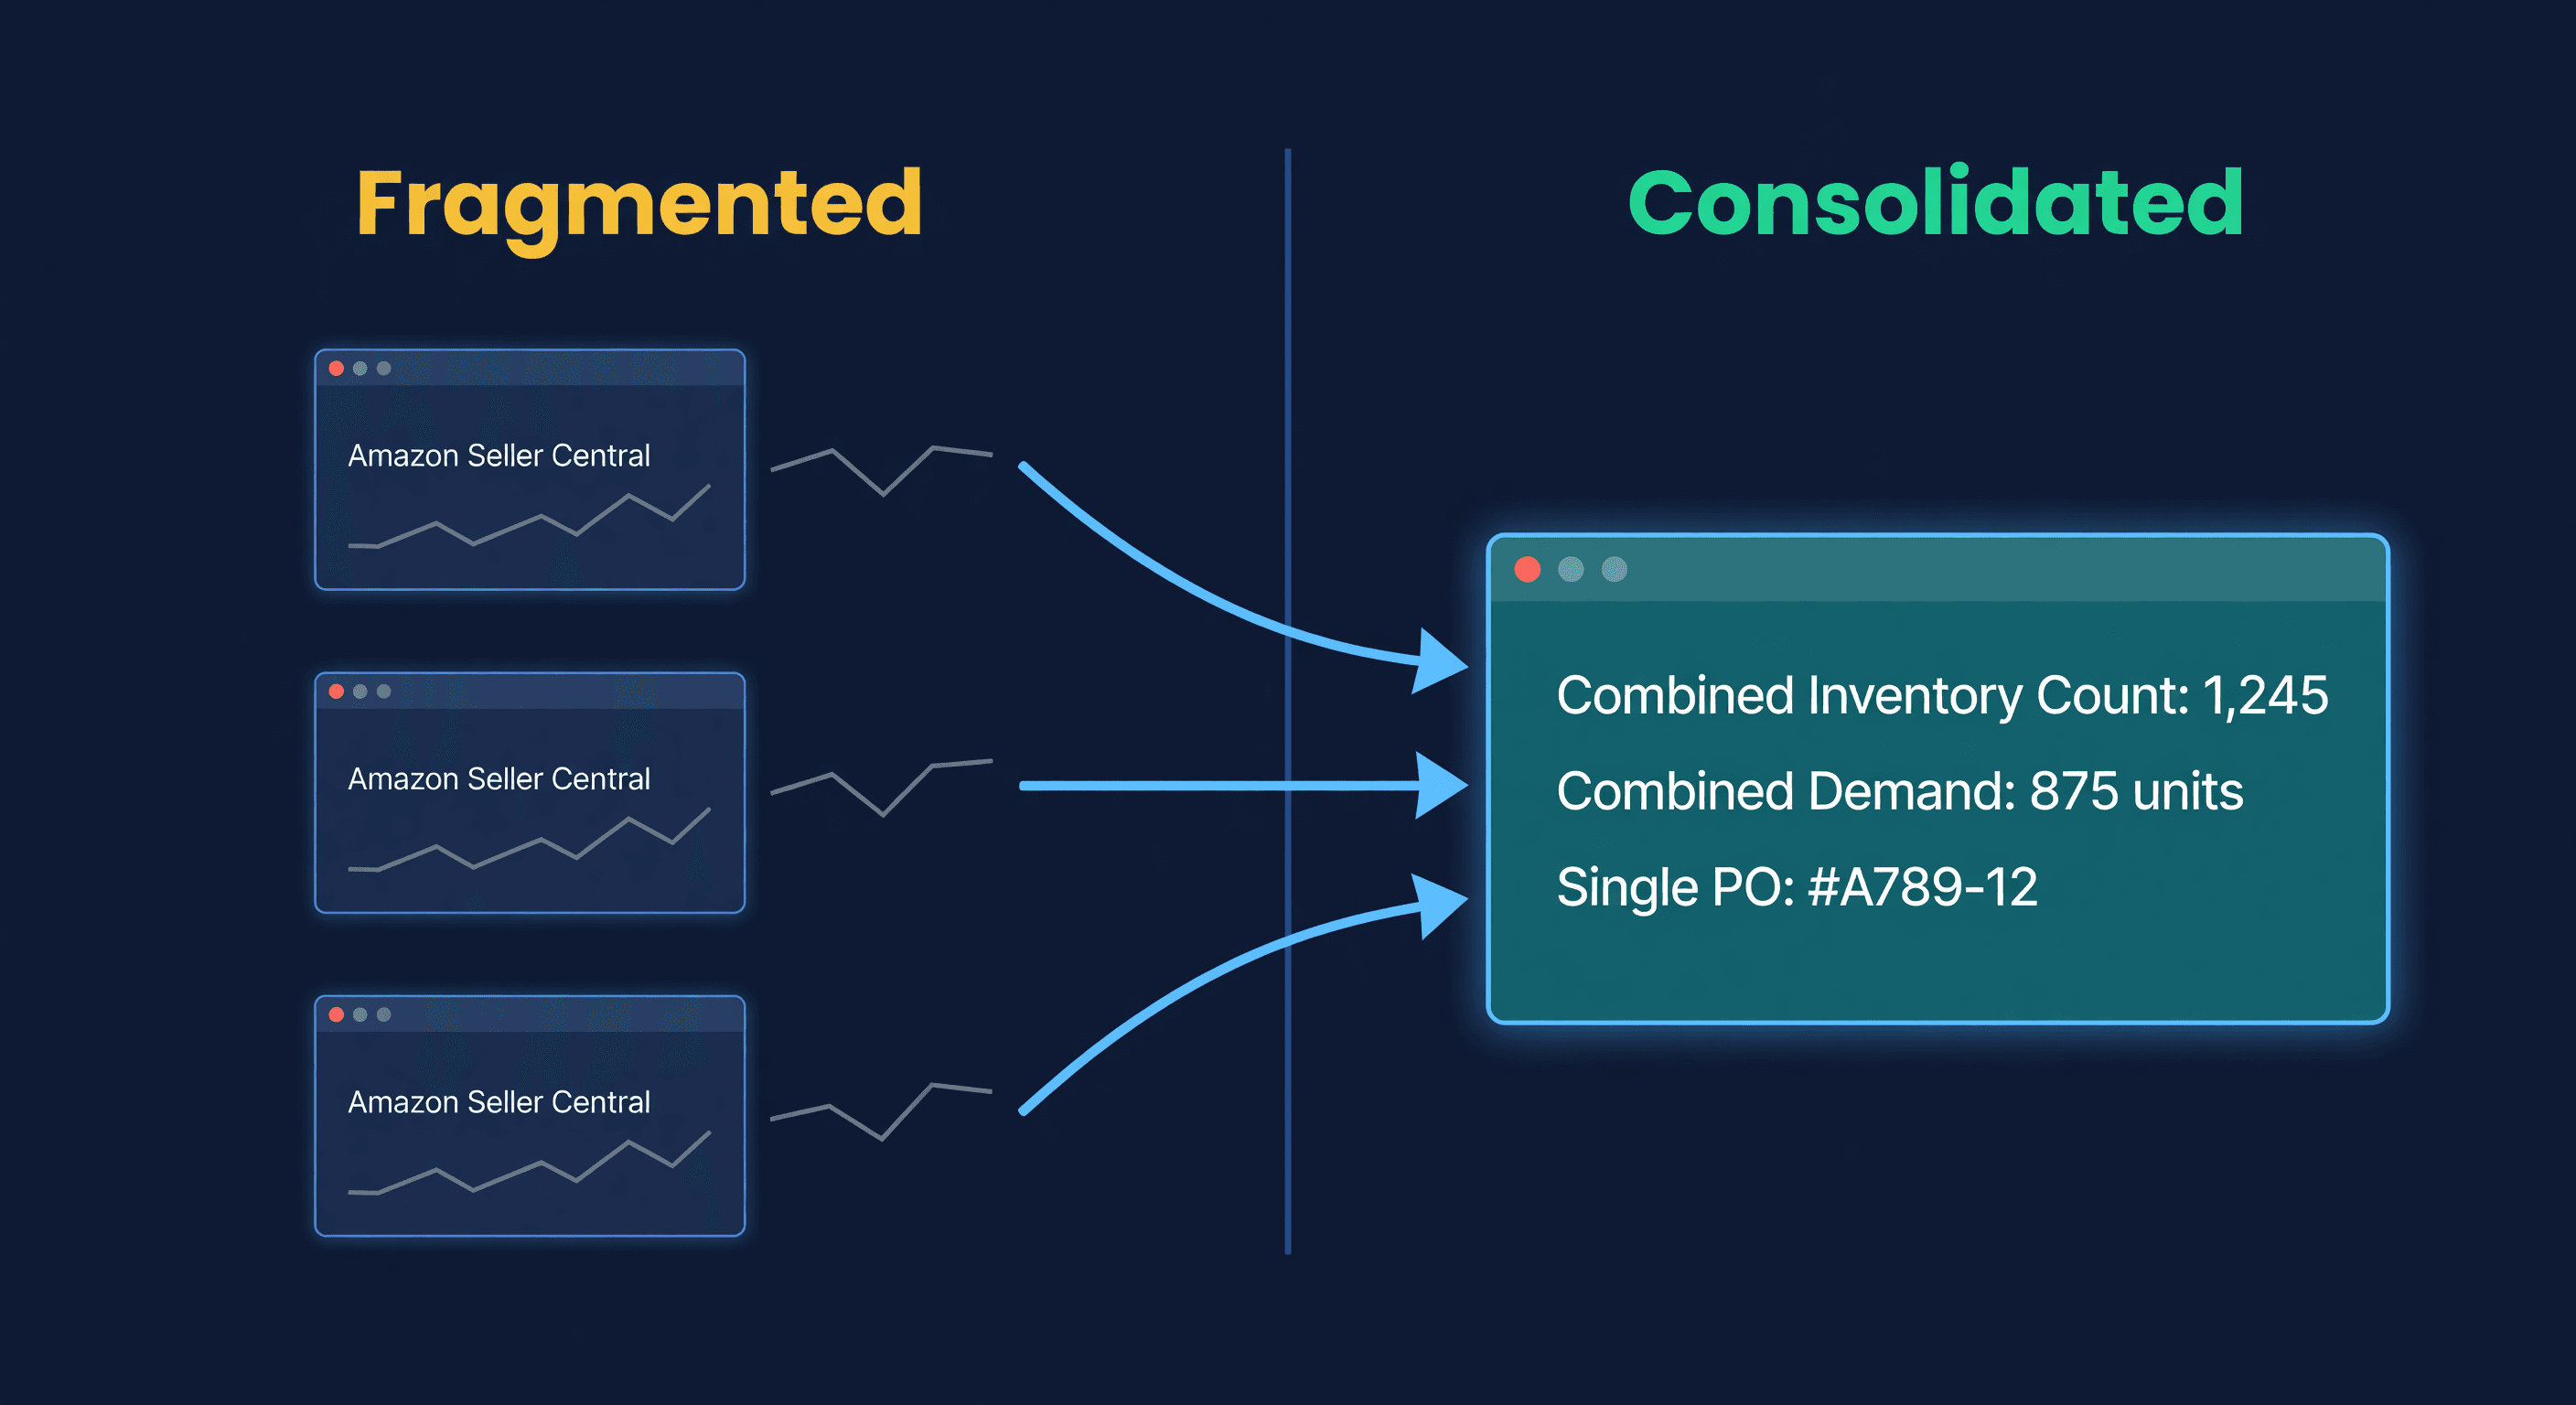
The problem is not the login. The problem is that after you log in, you see half the picture. Your supplier does not have two accounts. Your warehouse does not have two accounts. Your cash is one pool. But Amazon shows you two isolated worlds and asks you to do the mental math to connect them. If you run multiple stores across platforms, the fragmentation only gets worse.
Fragmented vs. Consolidated: A Side-by-Side
I am going to walk through two sellers with identical total volume. One keeps accounts separate. The other consolidates. The numbers tell the story.
The Setup
Both sellers run two Amazon accounts -- a US account and a UK account. Both sell fitness equipment. Same product catalog, same supplier in Guangdong.
| Metric | Both Sellers |
|---|---|
| Total active SKUs | 180 |
| Shared SKUs (sold on both accounts) | 120 |
| US-only SKUs | 40 |
| UK-only SKUs | 20 |
| Annual revenue (combined) | $2.4 million |
| Primary supplier lead time | 42 days (sea freight) |
Same business. Different approach to managing it.
The Fragmented Seller
This is Raj. He manages each account as if it were a separate company. Separate restock planning. Separate supplier negotiations. Separate forecasts.
What Raj's Week Looks Like
Monday: Review US account health, IPI score, stranded inventory. Export US sales and inventory reports.
Tuesday: Same process for UK account. Different currency, different fee structure, different FBA network.
Wednesday: Calculate restock quantities for US FBA. Build the US purchase order for Supplier Chen.
Thursday: Calculate restock quantities for UK FBA. Build a separate UK purchase order for the same Supplier Chen.
Friday: Submit two POs to Supplier Chen. Two invoices. Two wire transfers. Two sets of shipping documents.
That is five days of inventory work for what is fundamentally one supply chain.
Raj's Annual Purchasing Cost
| Line Item | US Account | UK Account | Total |
|---|---|---|---|
| Annual supplier spend | $420,000 | $260,000 | $680,000 |
| Price tier (Supplier Chen) | $50K-100K bracket | $25K-50K bracket | -- |
| Per-unit average | $8.40 | $8.90 | $8.59 (blended) |
| POs per year | 14 | 12 | 26 |
| Freight shipments | 14 | 12 | 26 |
| Freight cost (sea + last mile) | $16,800 | $14,400 | $31,200 |
Raj pays $8.90 per unit for his UK orders because the order sizes are smaller. He is in a lower price bracket with the same supplier for the same products.
Raj's FBA Restock Gaps
Because Raj forecasts each account independently, he cannot see total demand. His US forecast for a popular resistance band set says 800 units per month. His UK forecast says 350 per month. He orders accordingly -- separately.
What he misses: the combined 1,150 units per month would qualify for a different production run at the factory, with a lower setup cost per unit. Supplier Chen has told Raj about this. Raj keeps ordering separately anyway because his systems are separate.
The Consolidated Seller
This is Priya. Same two accounts. Same products. Same supplier. She consolidated her inventory view two years ago.
What Priya's Week Looks Like
Monday: Open her inventory dashboard. Review combined stock position across both accounts. Check which SKUs are approaching reorder points based on combined demand.
Tuesday: Review the system-generated PO suggestion. One PO to Supplier Chen for the combined quantity. Adjust any quantities based on upcoming promotions, then approve.
Wednesday: Supplier Chen confirms the order. One invoice. One wire transfer.
Thursday and Friday: Priya works on product development, listing optimization, and marketing. Because she is not spending two and a half days on inventory logistics.
Priya's Annual Purchasing Cost
| Line Item | Consolidated |
|---|---|
| Annual supplier spend | $680,000 |
| Price tier (Supplier Chen) | $100K+ bracket |
| Per-unit average | $7.80 |
| POs per year | 14 |
| Freight shipments | 14 |
| Freight cost | $19,600 |
Same $680,000 annual spend. But Priya pays $7.80 per unit instead of Raj's blended $8.59. On 80,000+ units per year, that is $63,200 saved in unit cost alone.
Her freight costs are lower too -- 14 shipments instead of 26. She ships everything to a UK-based 3PL that forwards to both Amazon US (via transatlantic container) and Amazon UK FBA. The consolidated shipments fill containers more efficiently.
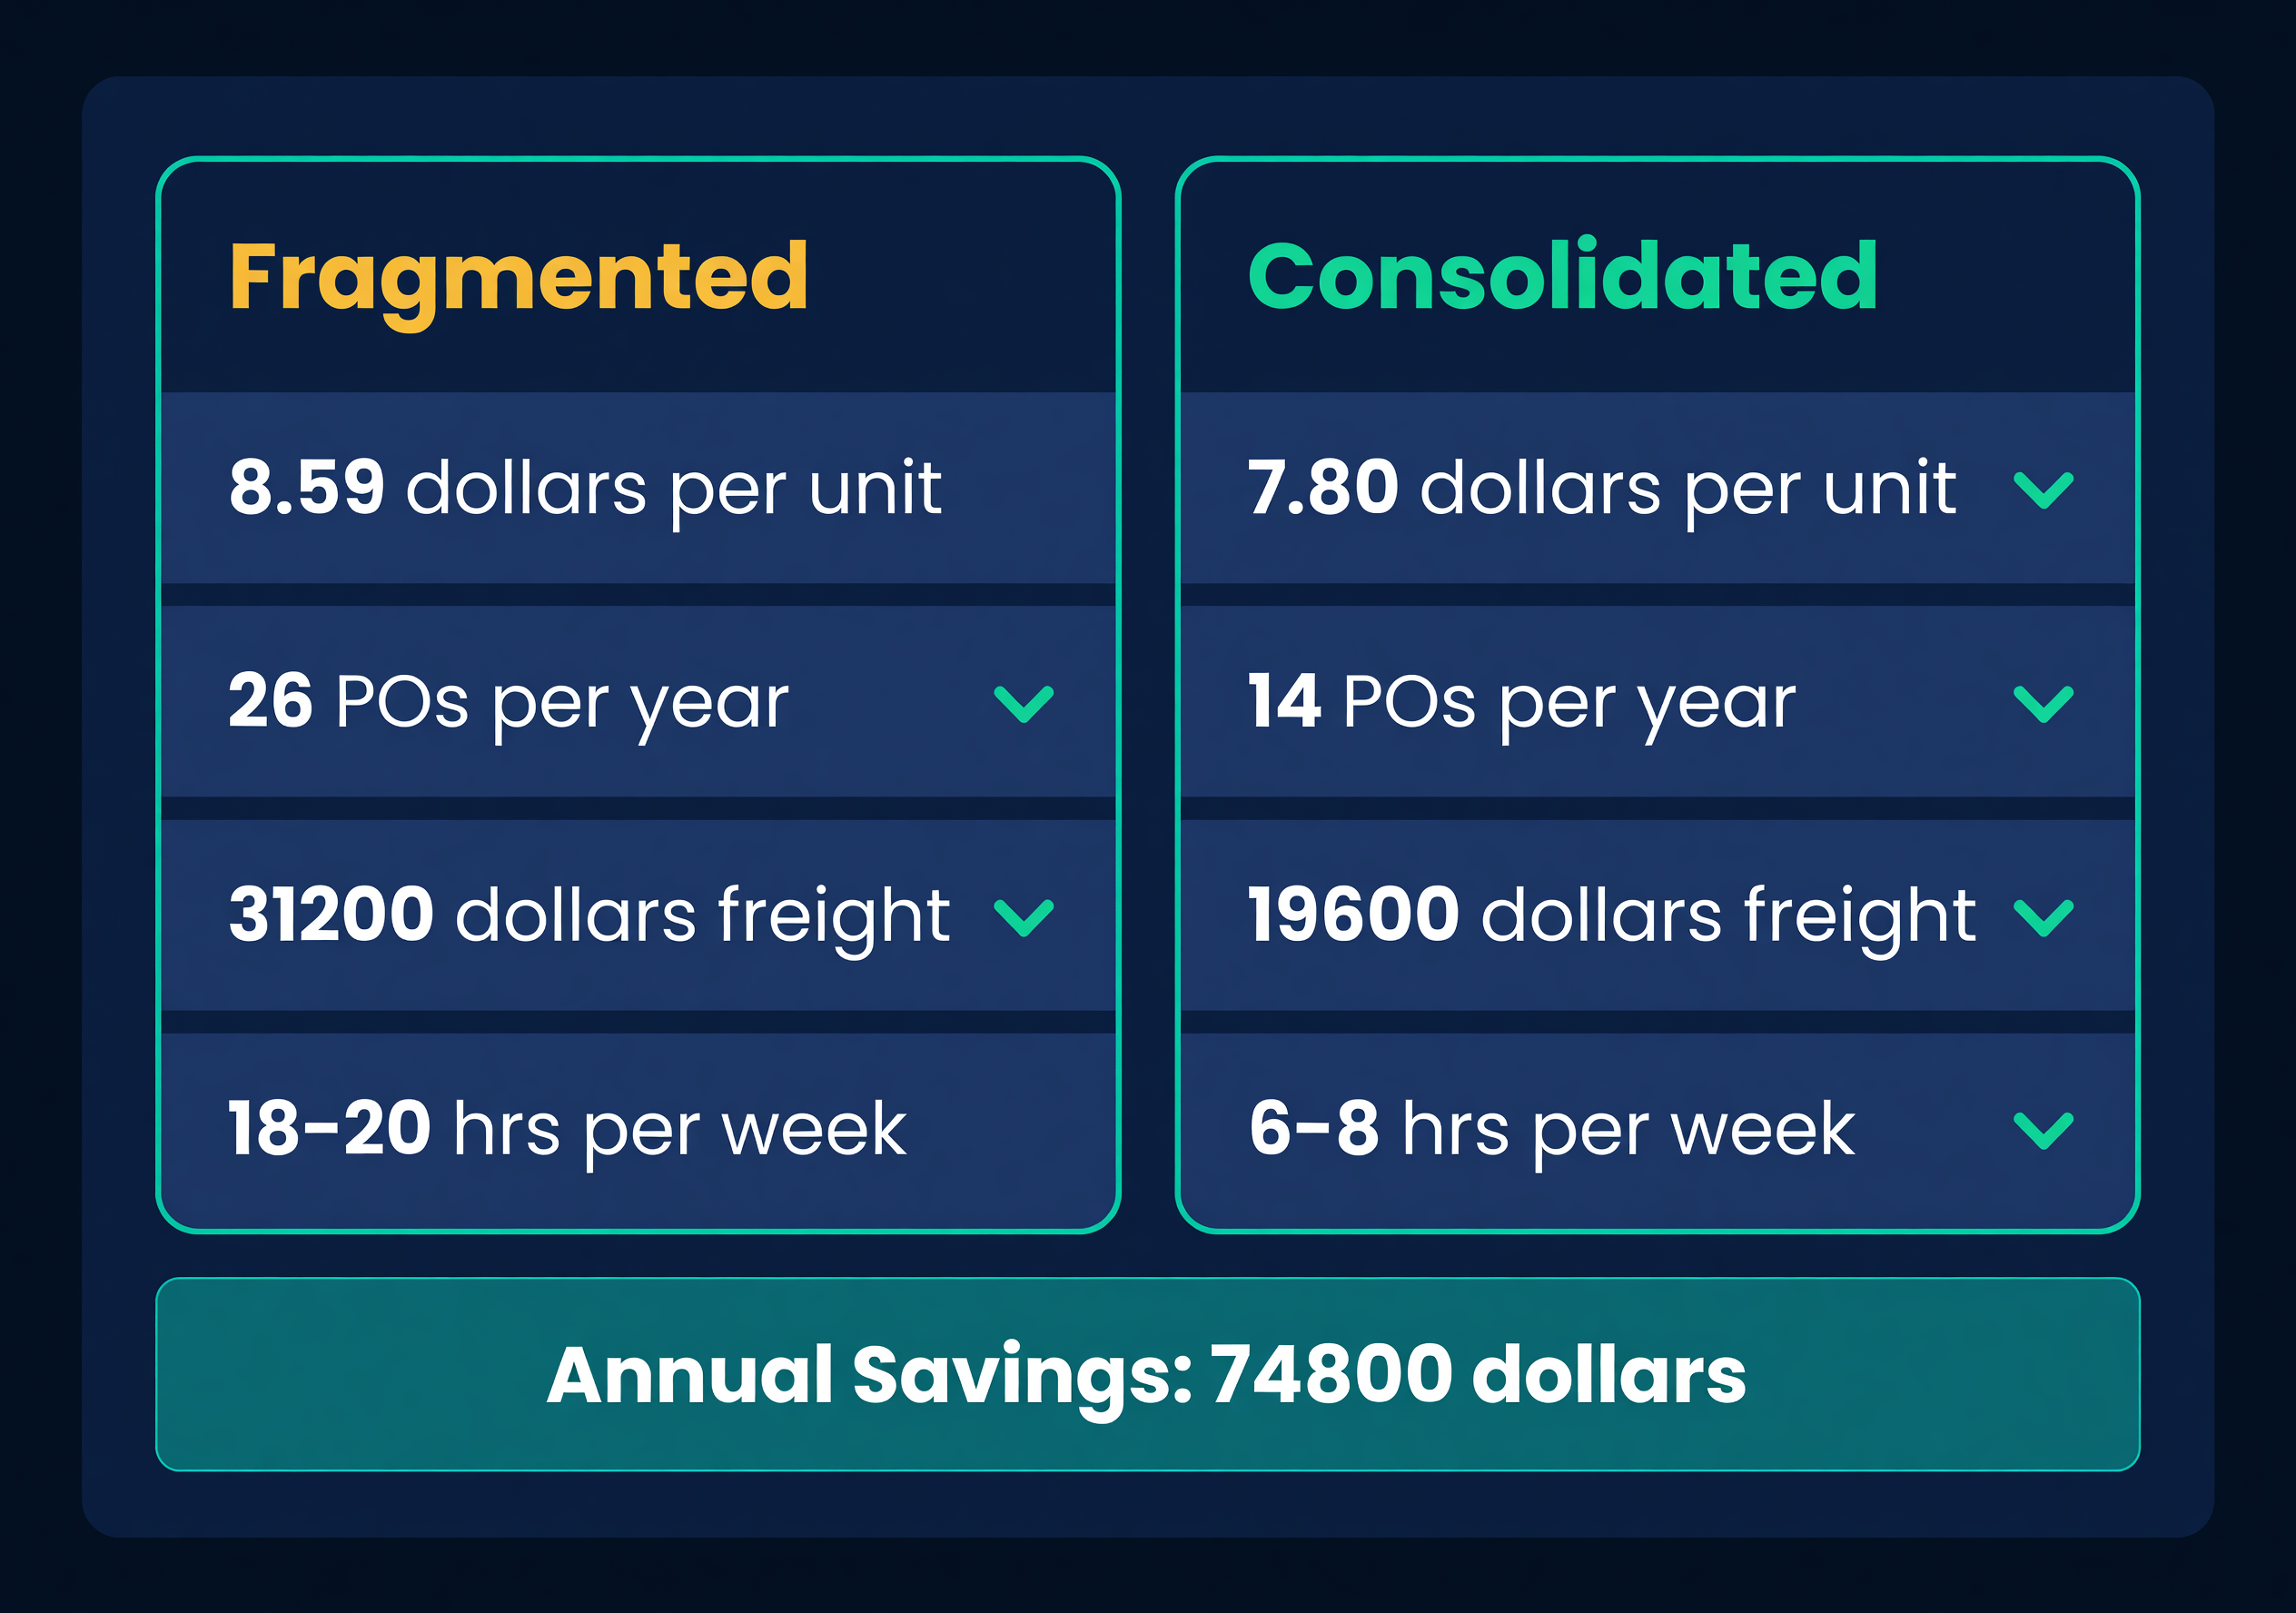
The Scorecard
| Metric | Raj (Fragmented) | Priya (Consolidated) | Difference |
|---|---|---|---|
| Unit cost | $8.59 | $7.80 | -$0.79/unit |
| Annual unit cost savings | -- | -- | $63,200 |
| POs per year | 26 | 14 | 12 fewer |
| Freight cost | $31,200 | $19,600 | $11,600 saved |
| Hours/week on inventory ops | 18-20 | 6-8 | 12 hrs saved |
| Forecast accuracy | Per-account only | Combined + per-account | Better |
| Total annual savings | -- | -- | $74,800+ |
Priya saves $74,800 per year and gets her Thursdays and Fridays back. Same revenue. Same products. Same supplier. Different approach to connecting the data.
Where Consolidation Gets Tricky
It is not all savings and free Fridays. Multi-account Amazon consolidation has real complications.
FBA Inventory Stays Separate
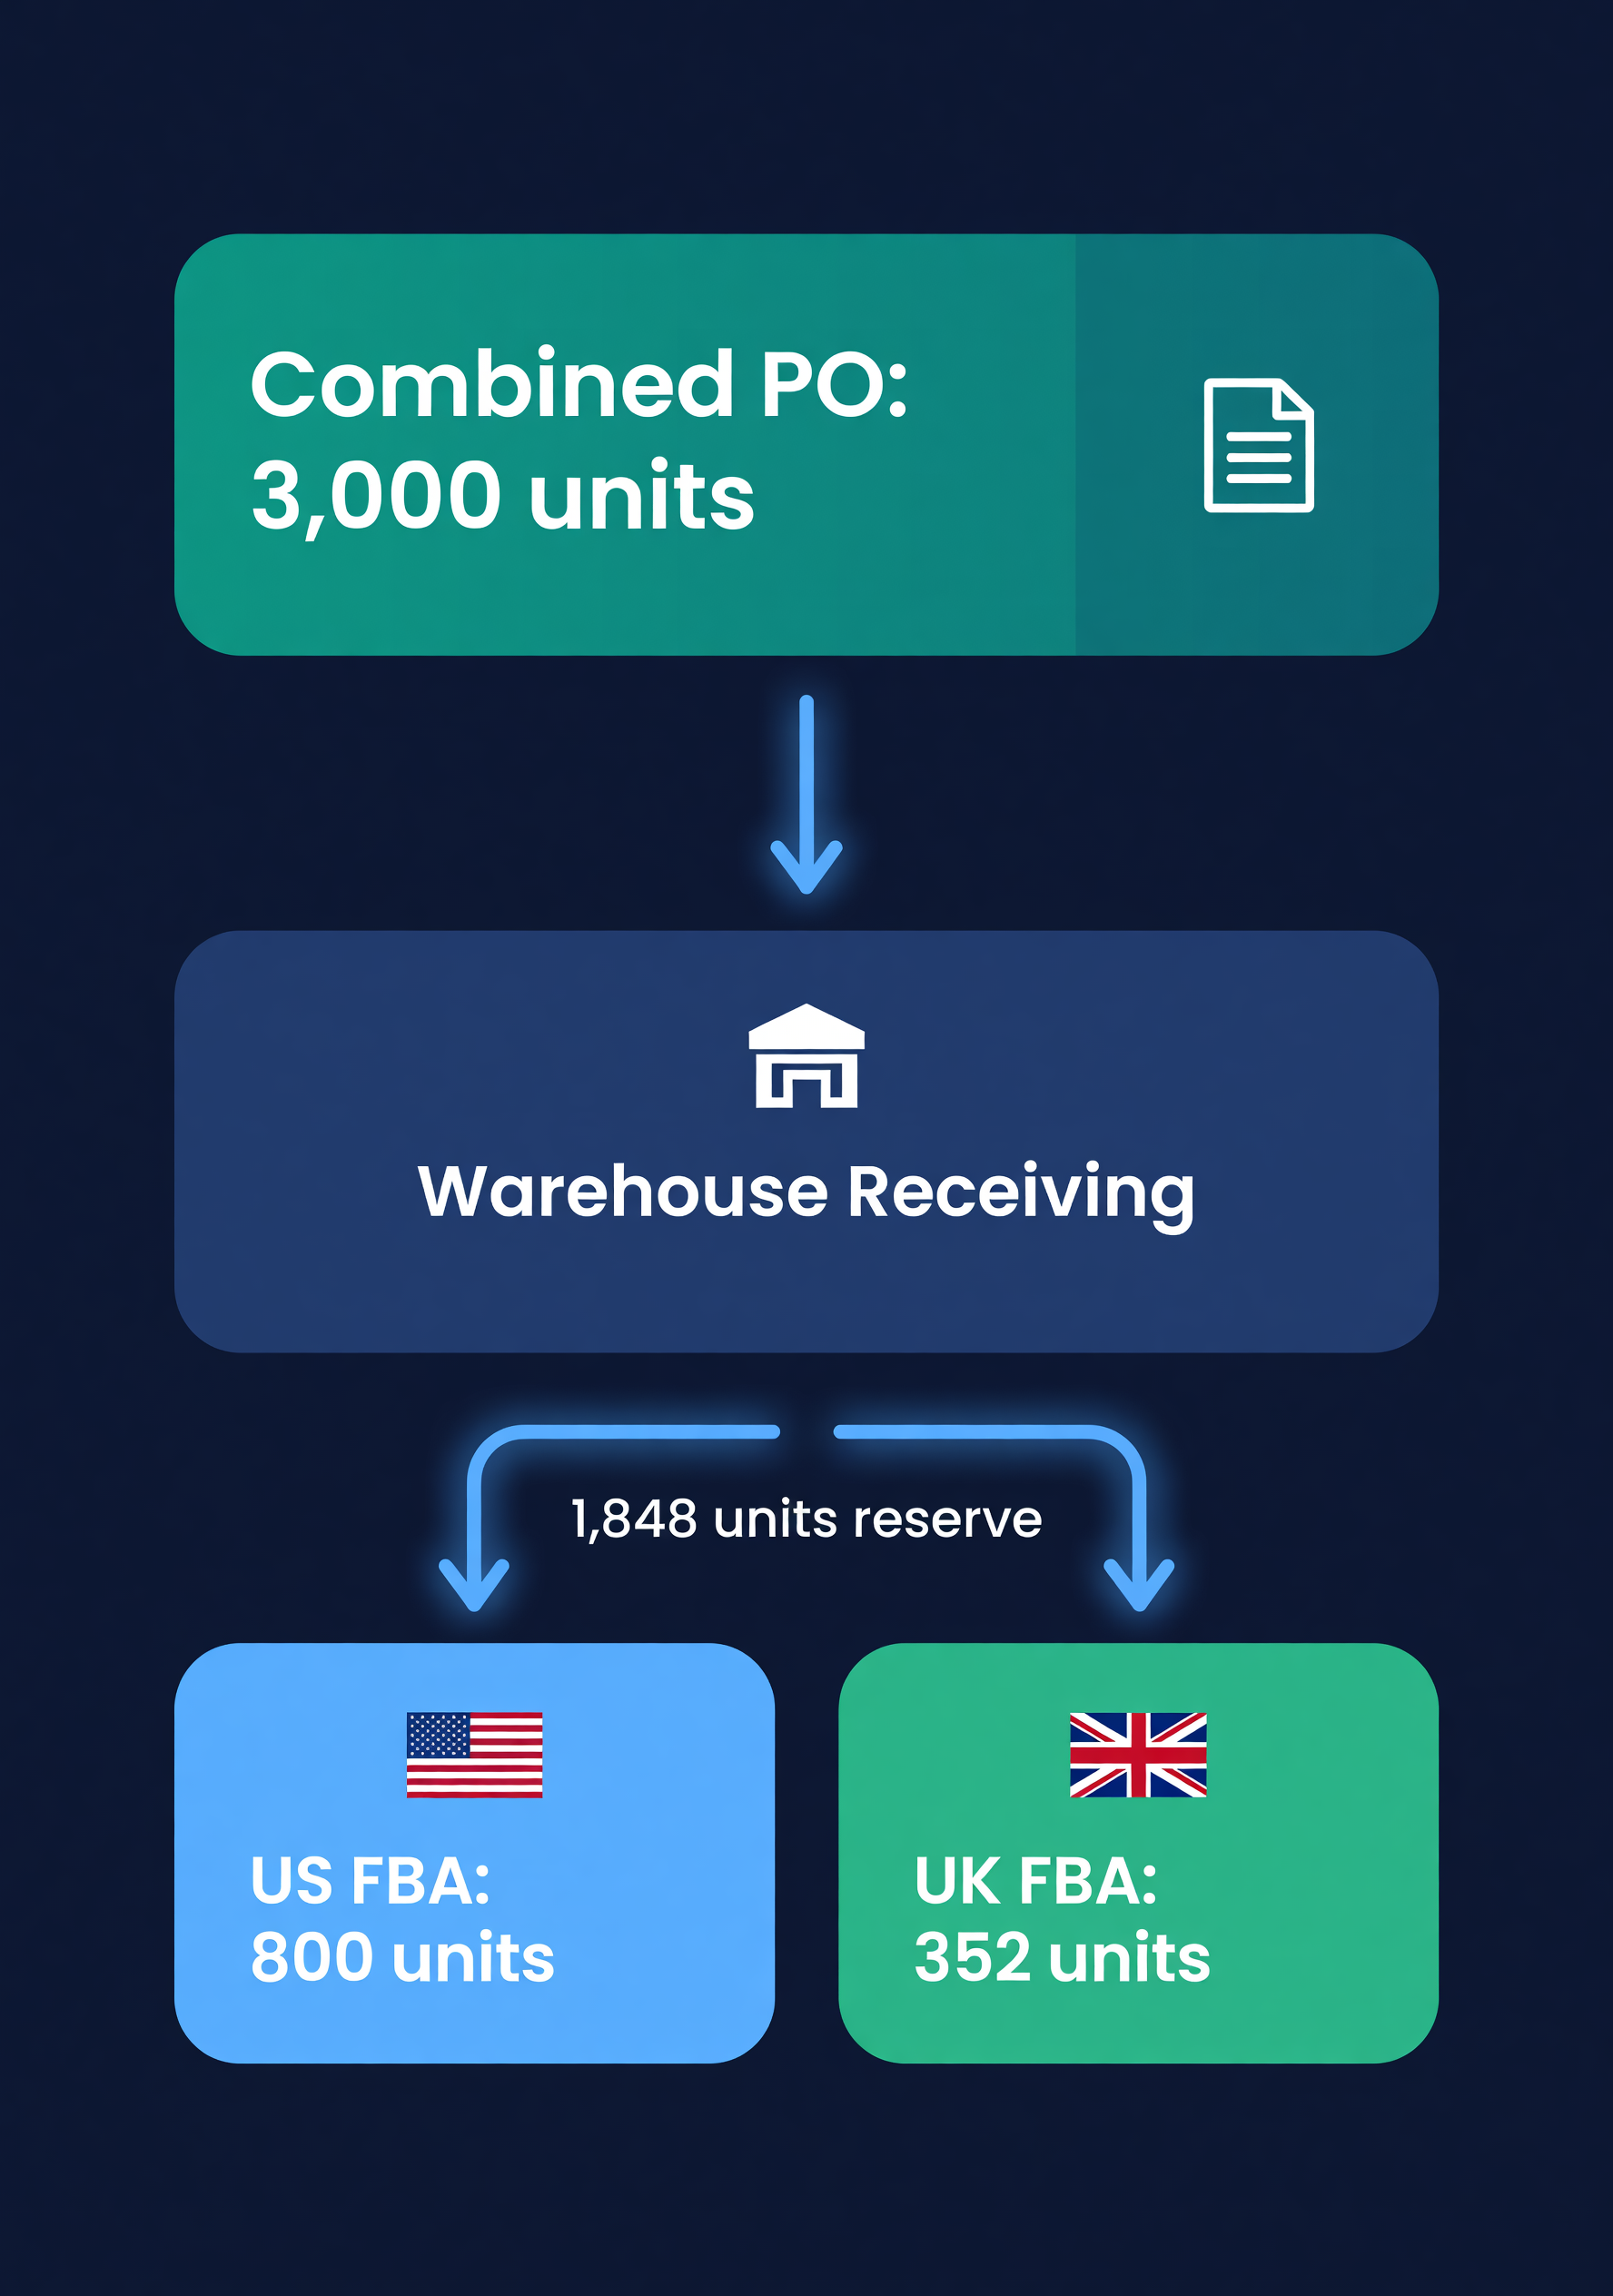
You can consolidate purchasing. You cannot consolidate FBA. Each account's FBA inventory is a separate pool in a separate fulfillment network. After a combined PO arrives at your warehouse, you split the received units into per-account FBA shipments.
This means you still need per-account demand forecasts to calculate FBA restock quantities. Combined demand drives supplier ordering. Per-account demand drives FBA restocking.
Combined PO received: 3,000 units of SKU RESIST-BAND-SET

US account FBA demand: 200 units/week
UK account FBA demand: 88 units/week

US FBA shipment: 200 x 4 weeks = 800 units
UK FBA shipment: 88 x 4 weeks = 352 units
Warehouse reserve: 3,000 - 800 - 352 = 1,848 units
The warehouse reserve feeds the next round of FBA restocks. One PO, split into two FBA flows.
IPI Scores Are Per-Account
Each account has its own IPI score and its own storage limits. An 520 IPI on your US account and a 380 on your UK account are two different realities. You cannot average them. You cannot move FBA stock between accounts.
Plan FBA shipments per account based on each account's constraints. But order from suppliers based on total demand. These are two separate decisions that happen to share the same product and supplier.
Currency and Fees Differ by Marketplace
UK sales are in GBP. US sales are in USD. Your supplier invoices in USD (or CNY). Your landed cost calculation for the UK account includes exchange rate exposure that your US account does not.
I have seen sellers get burned by ignoring FX. A $50,000 PO placed when GBP/USD was 1.27 looks very different when the goods arrive and GBP/USD is 1.22. That 4% swing costs $2,000 on the UK allocation alone. Build a 3-5% FX buffer into your landed cost for cross-currency accounts.
Amazon's Rules About Multiple Accounts
Amazon requires prior approval to operate multiple seller accounts. They approve them for legitimate reasons -- separate brands, different marketplaces, acquired businesses. But the accounts are linked in Amazon's system, and a serious policy violation on one account can affect all linked accounts.
Keep each account in good standing independently. Do not consolidate your inventory management and then neglect one account's health metrics. The operational efficiency of consolidation is real, but so is the compliance risk of connected accounts.
What You Need to Consolidate
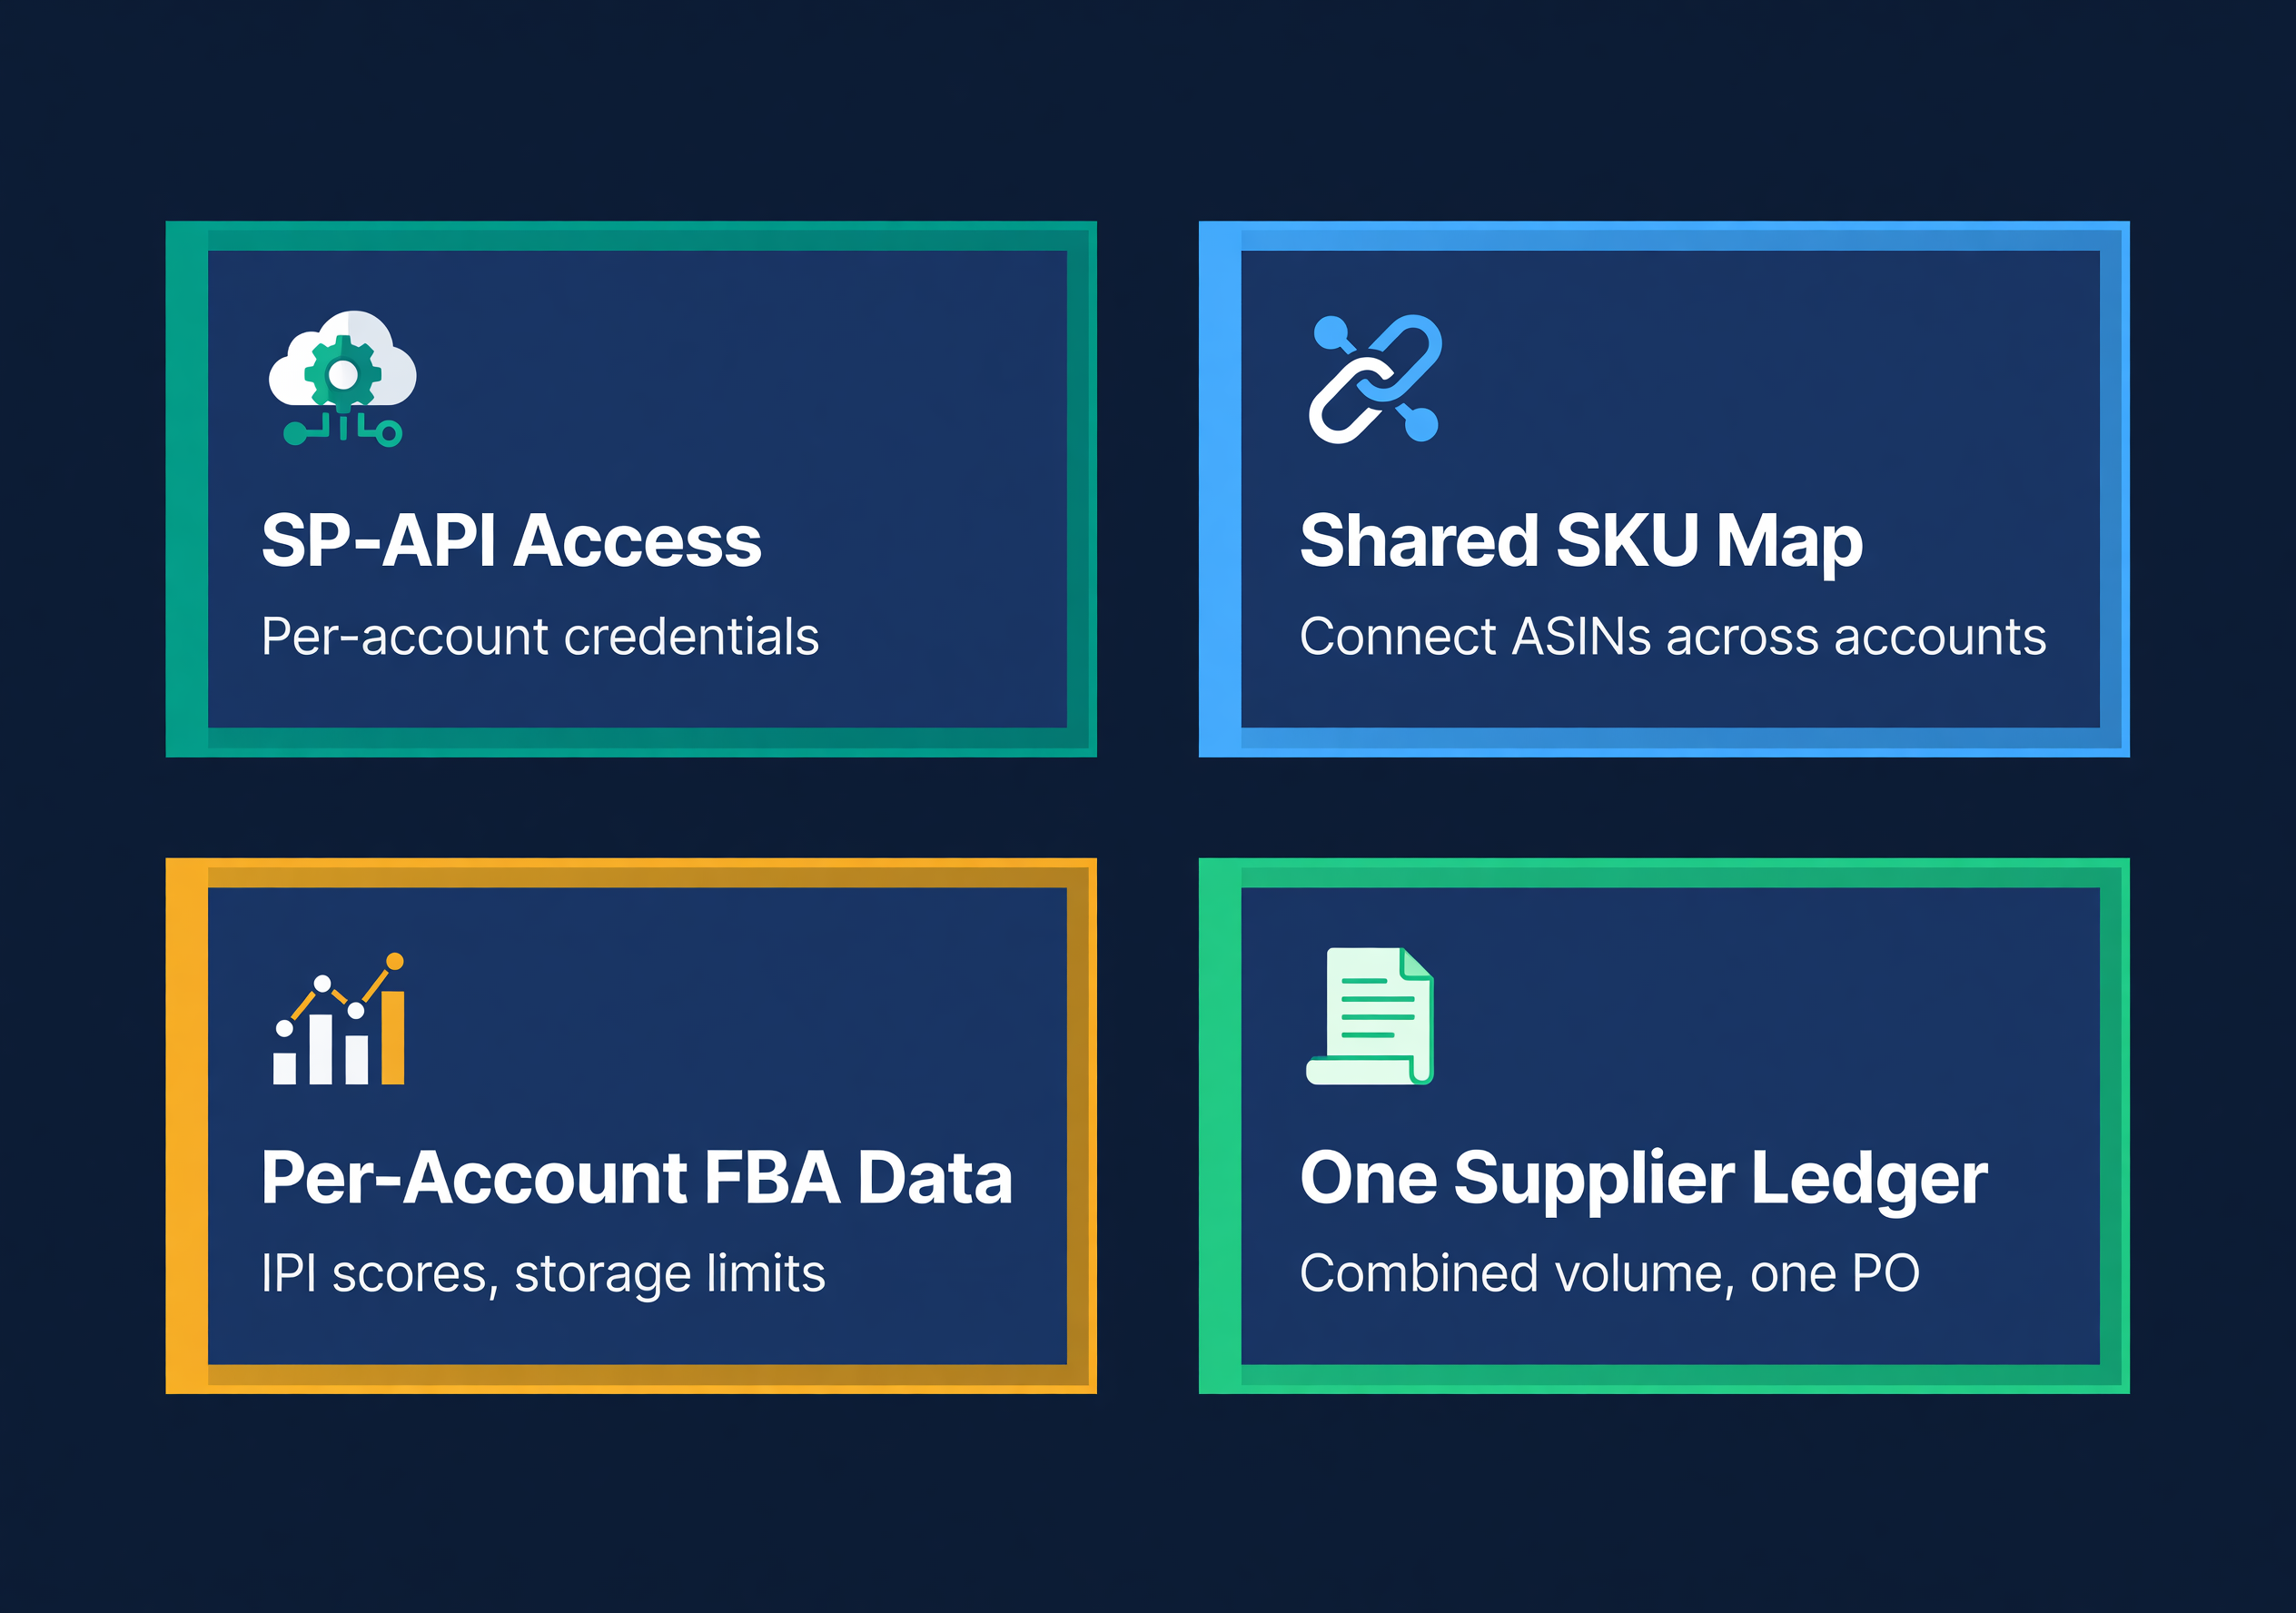
The technical requirements are straightforward:
API access to each account. Amazon's SP-API allows third-party tools to pull inventory, sales, and order data from multiple seller accounts. You need API credentials (LWA client ID and secret) for each account. Screen-scraping Seller Central is fragile and against terms of service.
A shared SKU map. If the same physical product has different ASINs across accounts (common when the same product is listed in US and UK catalogs), you need a mapping that connects them. Without this, your system sees two unrelated products instead of one product sold in two places.
Per-account FBA data. IPI scores, storage capacity, receiving times, fee structures -- all of this stays per-account even after you consolidate the demand view. Your tool needs to track this separately.
One supplier ledger. This is where the savings come from. One relationship with Supplier Chen, one volume negotiation, one PO cadence. The per-account split happens after goods arrive at your warehouse.
How ReplenishRadar Connects Multiple Amazon Accounts
We connect to each Amazon account through the SP-API -- real API access, not browser automation. Each account syncs independently on a schedule that depends on your plan. The inventory levels, sales data, and FBA metrics flow into one dashboard where you see total stock position, combined demand velocity, and per-account FBA health side by side.
The forecasting engine runs two layers. Per-account forecasts tell you how much to send to each account's FBA. Combined forecasts tell you how much to order from your suppliers. When the system generates a suggested PO for Supplier Chen, the quantity is based on total demand across all your accounts. When it generates FBA restock suggestions, those are per-account, respecting each account's IPI limits and storage capacity. You order once, ship to your warehouse, then split for FBA. The spreadsheet that used to connect those dots is gone.
Raj's setup costs him $74,800 a year and two and a half days a week. Same products, same supplier, same revenue. The only difference is that his data lives in two disconnected accounts. Try ReplenishRadar free for 14 days ->
Related Reading:
Frequently Asked Questions
Ready to prevent stockouts?
Related Posts
Dead Stock: How to Identify, Prevent, and Liquidate Unsold Inventory
Dead stock ties up cash and warehouse space. Learn how to identify it, prevent it from accumulating, and liquidate what you already have.
Managing Inventory Across Multiple Shopify Stores
The operational reality of running 2+ Shopify stores from one warehouse. Workflows, team coordination, and what breaks at scale.
OpenClaw Can Manage Your Inventory. Should It?
OpenClaw has Shopify skills, inventory alerts, and demand forecasting plugins. Here's where an AI agent works and where purpose-built inventory software wins.