Managing Inventory Across Multiple Shopify Stores
Key takeaway: Multi-store Shopify operations need one central warehouse workflow and a single system connecting all stores. Operating stores in parallel without unified inventory tracking compounds errors—oversells, misallocated stock, and missed reorder points.
Every Store Is a Full-Time Job
The first Shopify store took all my time. The second one was supposed to take 20% more. It took 80%.
Not because of marketing or customer service or product development. Because of inventory. Two admin panels means two places to check stock, two places to update counts, two places where a new SKU needs to be created with the right variant names, the right images, the right prices. Every operational task that was once a quick check now requires opening a second browser tab, finding the same product, and hoping the data matches.
At three stores, I stopped hoping. I started accepting that something was always wrong somewhere.
This post is about the operational side of multi-store Shopify inventory -- the daily workflows, team coordination problems, and the specific points where the whole thing falls apart. I have a separate post on the allocation math if you want the formulas. This one is about running the operation.
Meet the Three-Store Seller
I will thread a real scenario through this post. Names changed, numbers real.
David runs three Shopify stores from a single 4,000-square-foot warehouse:
| Store | Purpose | SKUs | Monthly Revenue |
|---|---|---|---|
| Store A | Premium DTC brand | 340 | $180,000 |
| Store B | Wholesale/B2B portal | 280 | $95,000 |
| Store C | Outlet store (overstock + seconds) | 150 | $35,000 |
About 200 SKUs overlap between stores. All three ship from the same warehouse. David has two warehouse employees and one operations manager.
His problems are not theoretical. They are happening right now, every day, on repeat.
The Morning Chaos
David's operations manager, Amy, starts every morning with the same routine:
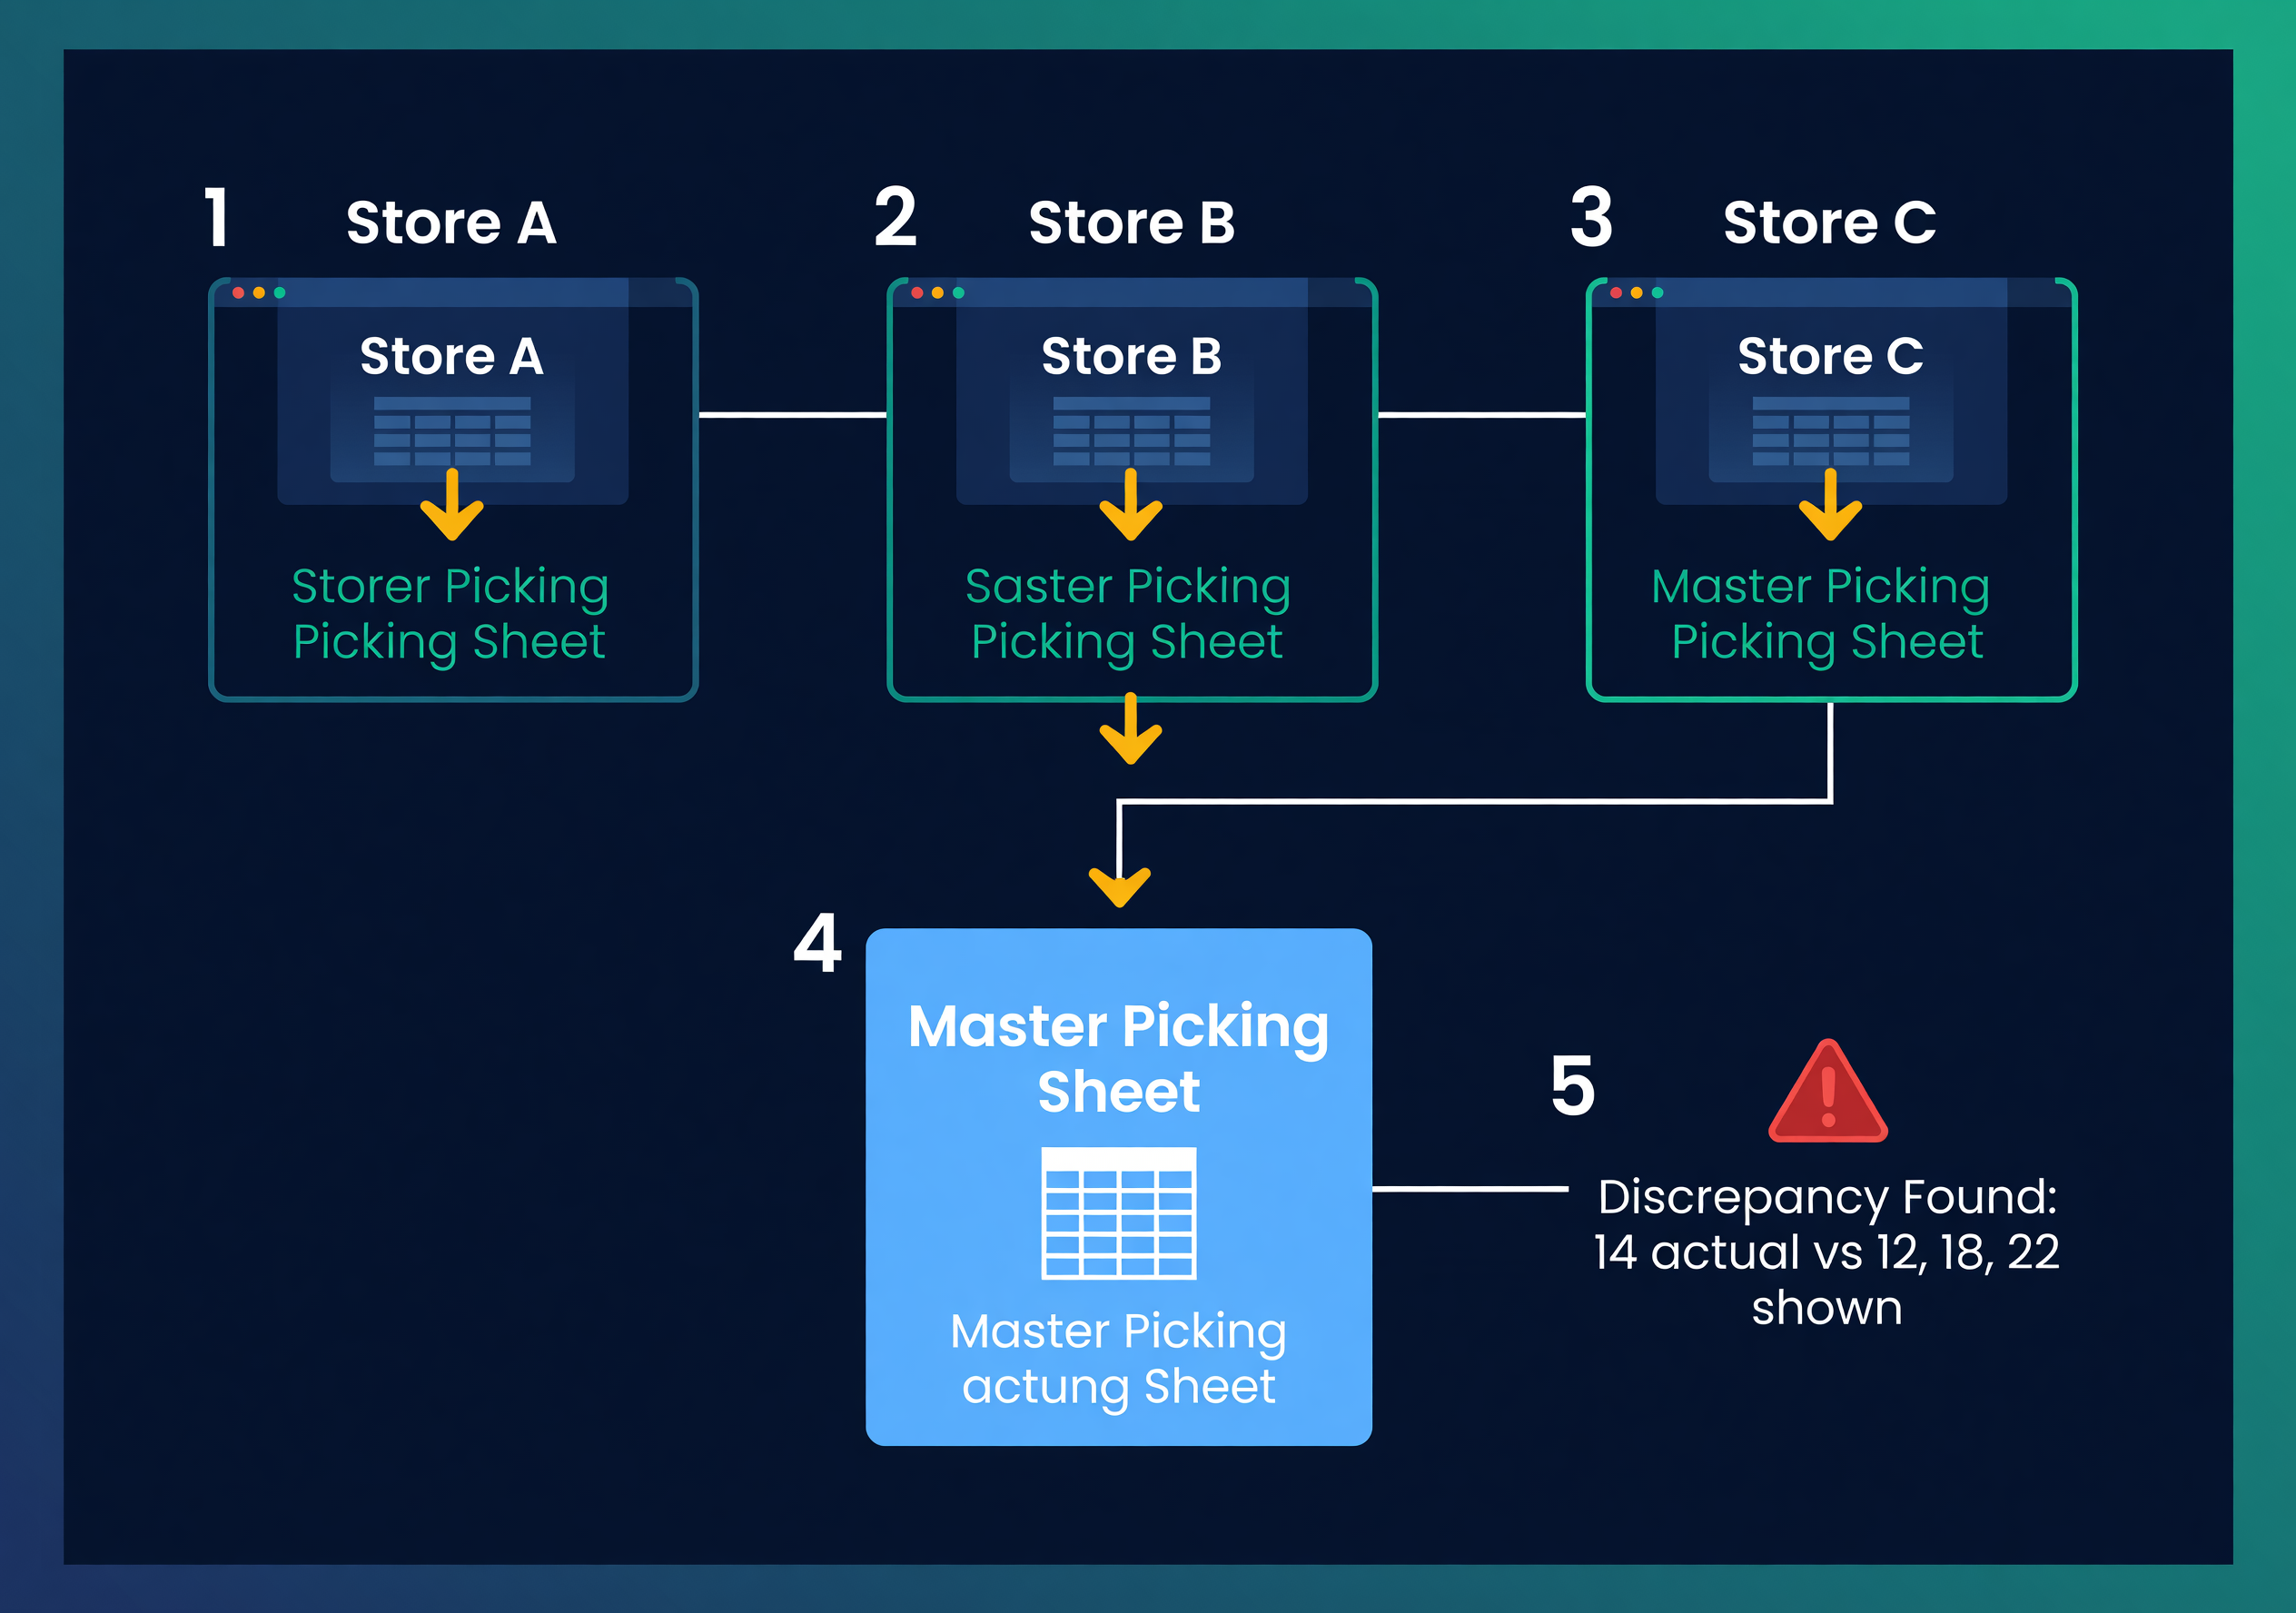
- Open Store A admin. Export unfulfilled orders. Copy to the master picking sheet.
- Open Store B admin. Export unfulfilled orders. Add to the same sheet.
- Open Store C admin. Export unfulfilled orders. Add to the sheet.
- Sort by SKU so the warehouse team can pick efficiently.
- Check inventory levels across all three stores. Find discrepancies. Fix them manually.
Step 5 is where the morning goes sideways.
Yesterday, Store A showed 12 units of SKU BLK-HOODIE-XL. Store B showed 18. The warehouse had 14. Why the mismatch? Because Amy updated Store A on Friday after a physical count but forgot Store B. Store C was not even checked -- it still showed 22 from a count she did two weeks ago.
Fourteen units exist. Three stores disagree on how many. This is not a technology problem. It is an information coordination problem, and it scales linearly with the number of stores.
Five Operational Breakdowns (and What They Cost)
1. The Fulfillment Bottleneck
Every order from every store lands in one warehouse. The pick-pack-ship process should not care which store the order came from. But without a unified order queue, warehouse staff flip between admin panels.
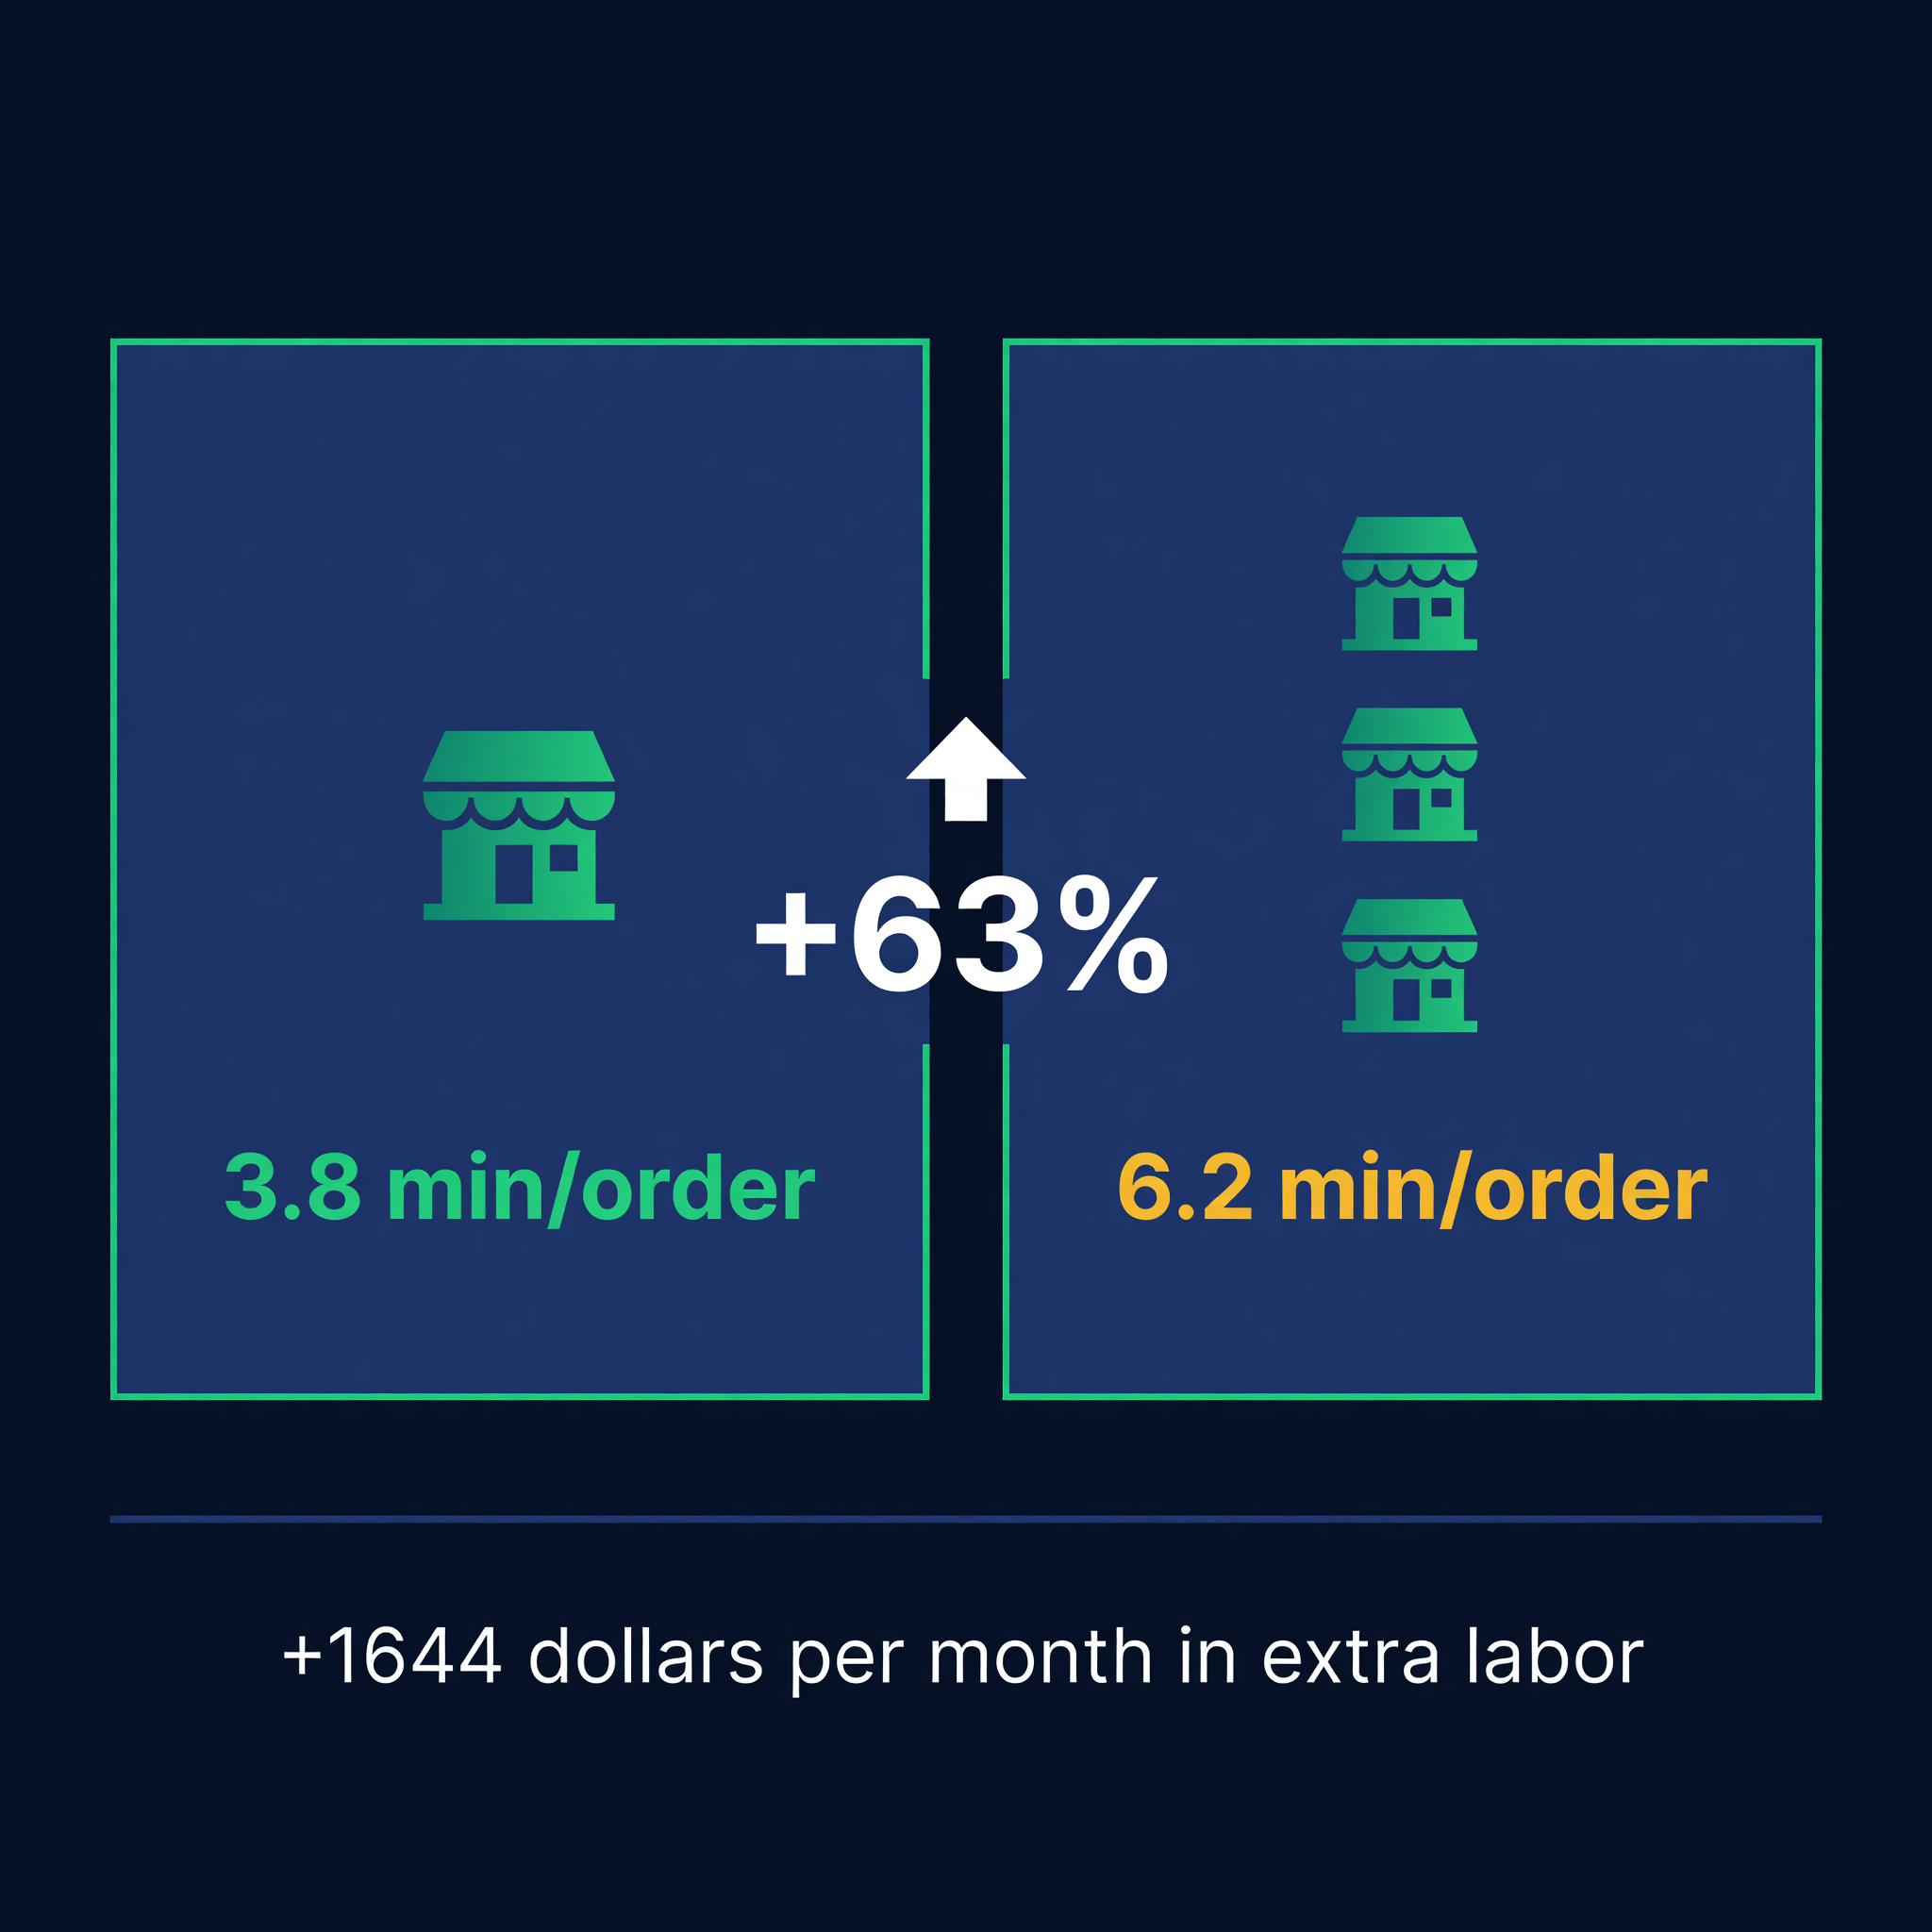
David's team averages 6.2 minutes per order when pulling from three dashboards. Comparable single-store operations average 3.8 minutes. That is 63% slower.
| Metric | Single-Store Ops | Three-Store Ops | Difference |
|---|---|---|---|
| Orders per day | 85 | 85 | Same volume |
| Time per order | 3.8 min | 6.2 min | +63% |
| Total fulfillment hours | 5.4 hrs | 8.8 hrs | +3.4 hrs |
| Monthly labor cost at $22/hr | $2,614 | $4,258 | +$1,644 |
That is $1,644 per month in extra labor for the same number of orders. Not because demand grew, but because the workflow is fragmented.
2. The Phantom Stock Problem
When inventory counts disagree between stores, somebody is selling something that does not exist. David's worst month had 23 canceled orders from overselling -- products that one store showed as available but the warehouse did not have.
Twenty-three cancellations at an average order value of $67: $1,541 in lost revenue. Plus refund processing costs, customer service time, and on Amazon (if he ever expands there) potential account health hits. Shopify is more forgiving, but customers are not.
3. The Purchasing Black Hole
Amy calculates reorder needs by looking at Store A velocity, Store B velocity, and Store C velocity separately. She adds them up in a spreadsheet.
The problem: she does it on Monday morning. By Wednesday, the numbers are stale. By Friday, Store C ran a flash sale she forgot to account for. The PO she sent Monday was short by 200 units on three SKUs.
I wrote about the math behind consolidated reorder points in a separate post. The operational point here is different: the math is only as good as the data feeding it, and three stores means three sources of data going stale at three different rates.
4. Staff Permissions Chaos
David has different people managing different stores. His brand manager updates Store A products. A wholesale coordinator handles Store B pricing and orders. Store C is Amy's side project.
When the brand manager adjusts a price on Store A, nobody tells the wholesale coordinator. When Amy marks something as discontinued on Store C, it is still active on Store A and B. There is no single source of truth for product status.
This is not about Shopify's staff permissions -- those work fine within a single store. It is about the fact that Shopify does not connect stores. Each store has its own staff, its own permissions, its own idea of what is happening.
5. Reporting in Three Tabs
David cannot answer "How much did we sell of SKU BLK-HOODIE-XL this month?" without exporting reports from three stores and adding them up.
Total revenue? Three exports. Top-selling products? Three exports, then a manual rank. Slow movers? Three exports, filtered, cross-referenced. Every question that should take 30 seconds takes 15 minutes.
I watched Amy build a "weekly performance report" once. She had 11 browser tabs open. It took 90 minutes. The report was a Google Sheet.
What Actually Works: The Unified Operations Playbook
I have seen sellers fix this in stages. Here is what works and what order to do it in.
Stage 1: One SKU Map, Enforced
Before anything else, every product needs one canonical identifier that all three stores recognize. Shopify does not enforce consistent SKU naming across stores. You have to.
David's mapping table:
| Canonical SKU | Store A | Store B | Store C |
|---|---|---|---|
| BLK-HOODIE-XL | BLK-HOODIE-XL | HOODIE-BLK-XL | HOOD-BLK-XL-2NDS |
| RED-TEE-M | RED-TEE-M | TEE-RED-M-BULK | RT-M-OUTLET |
This mapping is the foundation of everything. Without it, no tool or process can connect the dots. Audit it monthly -- new products, renamed variants, and retired SKUs create drift faster than you think.
Stage 2: One Inventory Count
Pick one source of truth for stock levels. Usually that is the warehouse. Not Store A, not Store B, not the average across stores. The physical count in the warehouse is reality. Everything else is a derived allocation.
Update cadence matters. David's team does a rolling cycle count: 50 SKUs per day, full catalog every 6 days. That count updates the master record. Allocations to each store are calculated from that master.
If you are doing this manually, the formula is straightforward. Total warehouse stock minus allocated stock equals available to allocate. Per-store allocation uses trailing 14-day sales velocity as the weight. I covered the detailed allocation math separately.
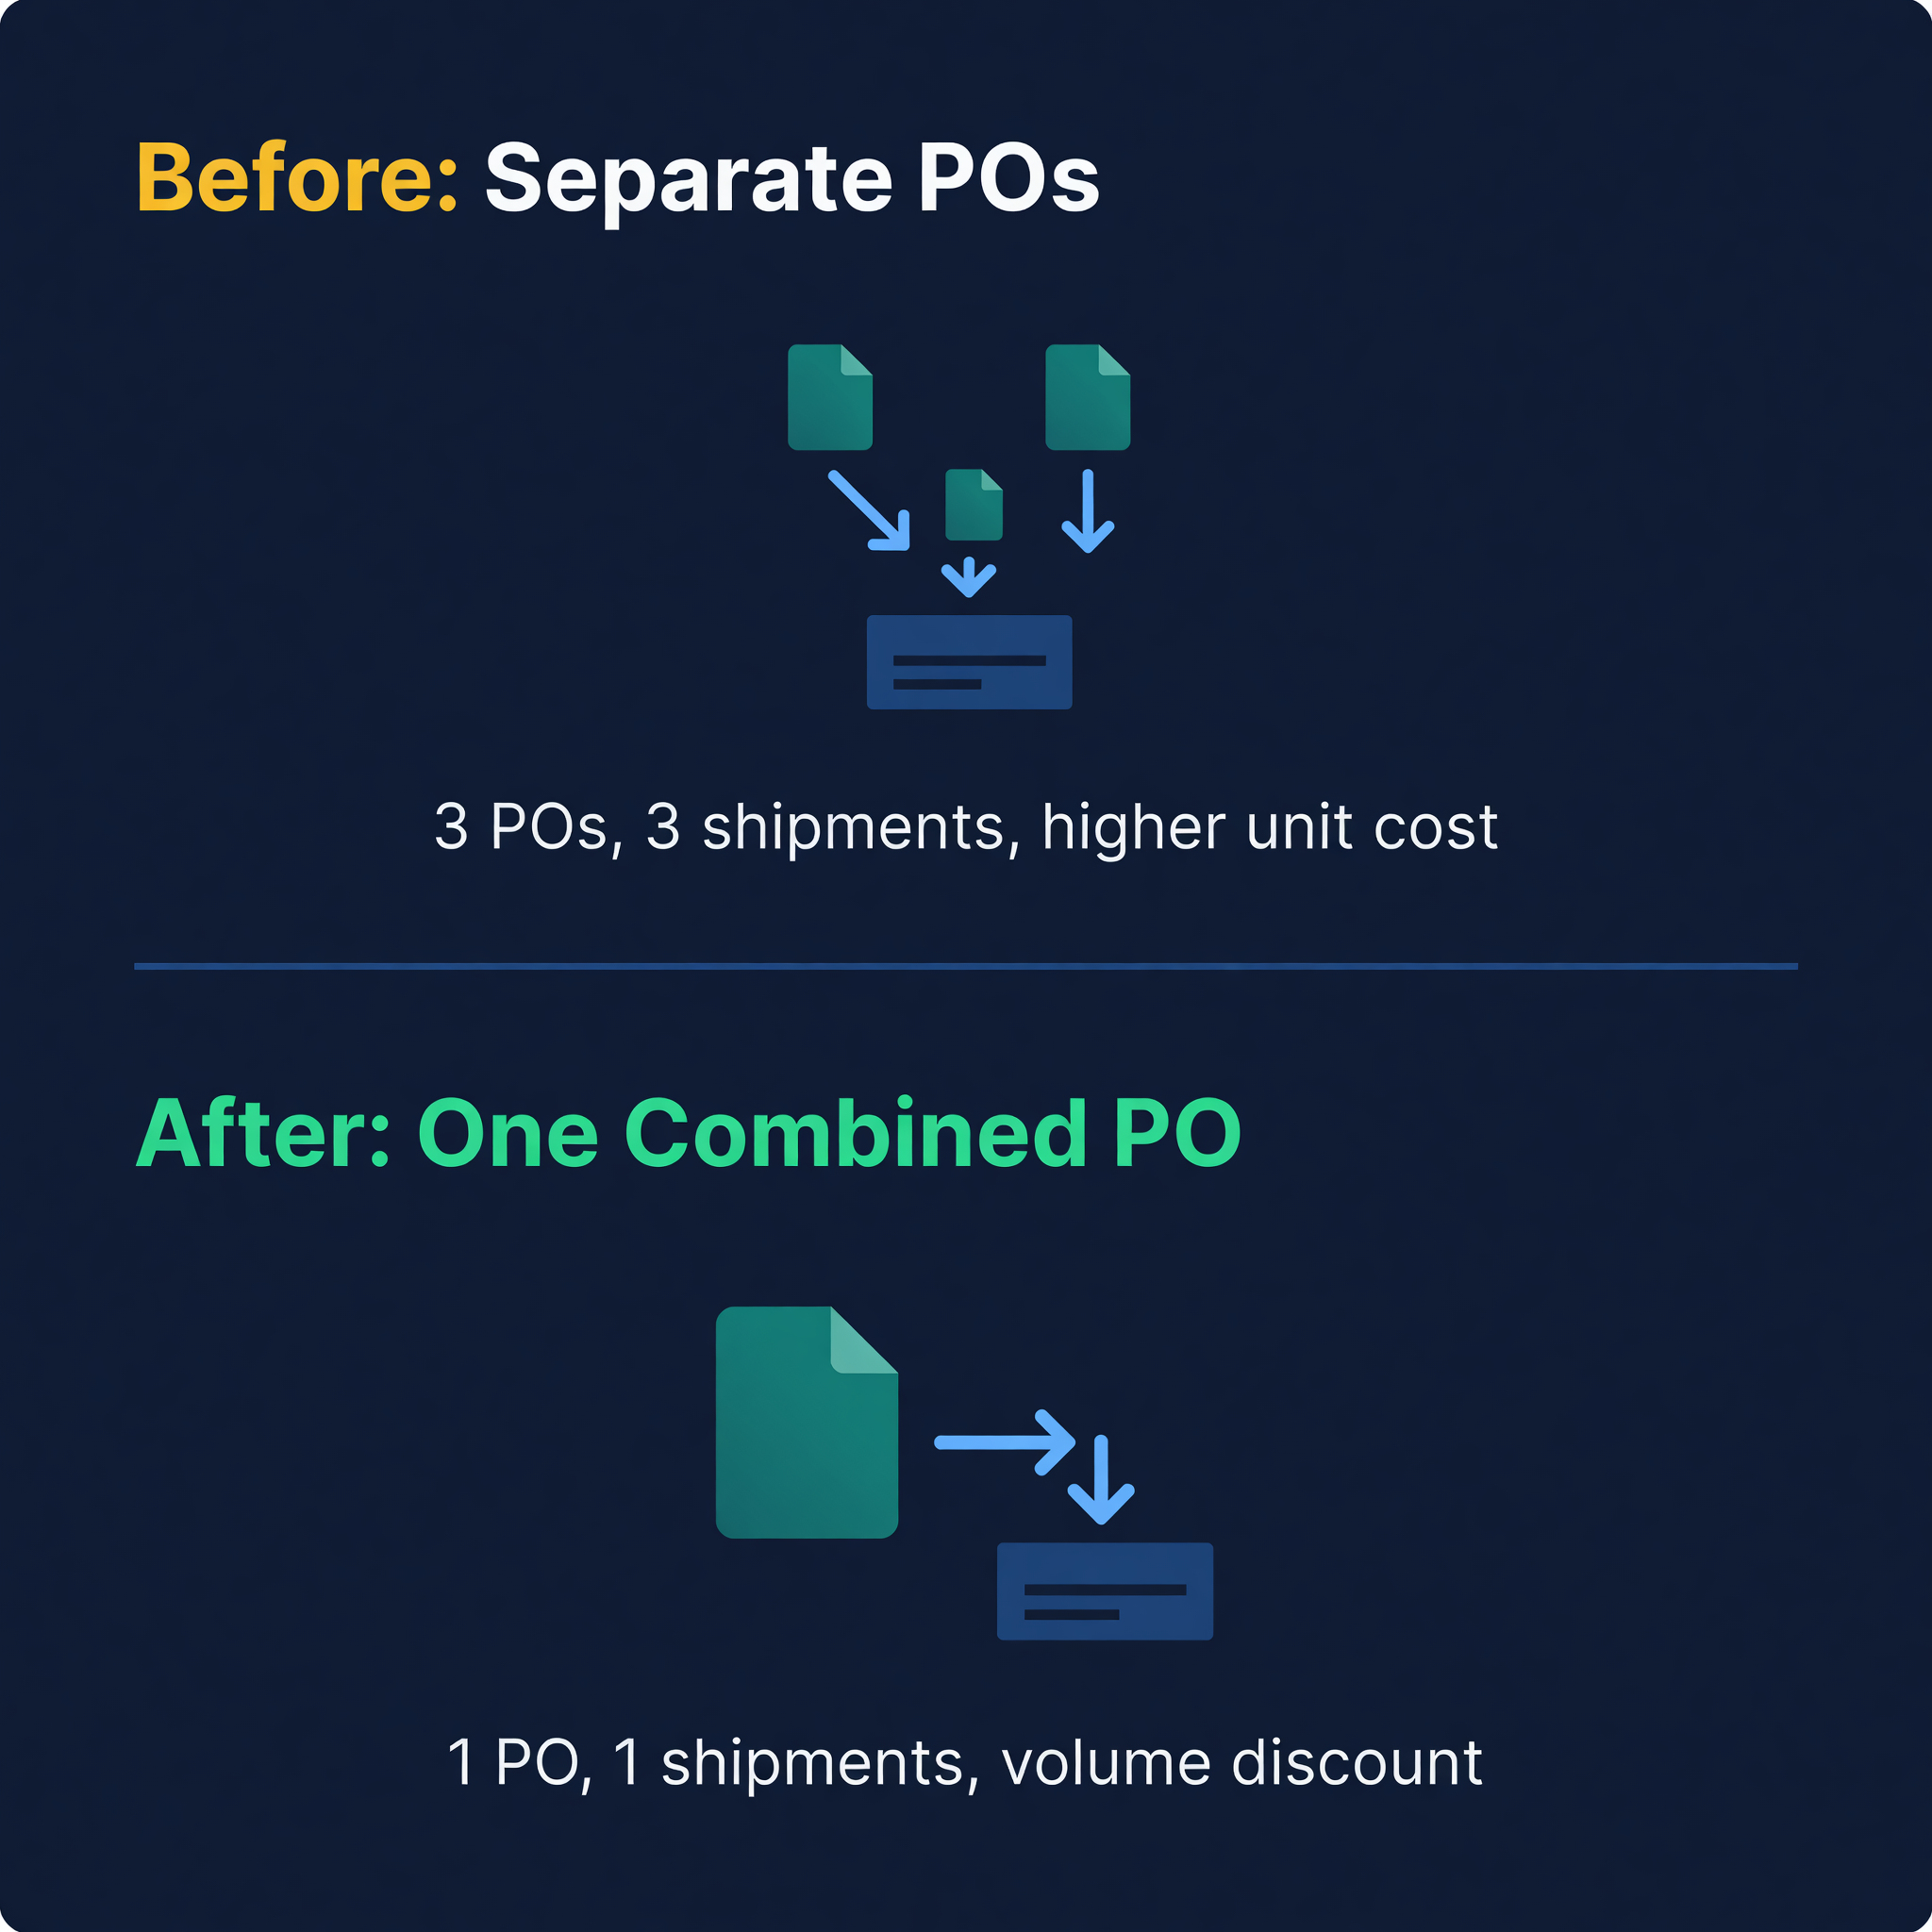
Stage 3: One PO Per Supplier
This is where the real savings show up. David was placing separate POs for Store A needs and Store B needs from the same supplier. He was paying shipping twice and missing volume price breaks.
Combined purchasing from a single demand picture:
Store A weekly demand for SKU BLK-HOODIE-XL: 35 units
Store B weekly demand: 12 units
Store C weekly demand: 8 units
Combined weekly demand: 55 units

Supplier lead time: 28 days
Safety stock: 2 weeks = 110 units
Reorder point: (55/7 x 28) + 110 = 330 units
One PO, one shipment, one receiving event. The supplier gives David better per-unit pricing on the combined volume, and Amy spends her time on one PO instead of two or three. See how to create a purchase order for the full PO workflow.
Stage 4: One Dashboard
This is where manual processes hit their ceiling. You can maintain a SKU map in a spreadsheet. You can do cycle counts and update allocations by hand. But doing it across three stores, 340+ SKUs, with daily velocity changes? That is a full-time job.
David spent six months trying to make Google Sheets work. The spreadsheet approach has a known shelf life -- it breaks somewhere between 100 and 500 SKUs. With three stores, David hit the wall at about 150 shared SKUs.
The Time Audit
I asked Amy to track her multi-store inventory tasks for one week. Here is where her time went:
| Task | Hours/Week | Could Be Automated |
|---|---|---|
| Order export and consolidation | 3.5 | Yes |
| Inventory count reconciliation | 4.0 | Partially |
| Reorder calculations | 2.5 | Yes |
| SKU mapping maintenance | 1.0 | Partially |
| Cross-store reporting | 2.0 | Yes |
| Discrepancy investigation | 1.5 | No |
| Total | 14.5 | 10+ hours |
14.5 hours a week. That is 36% of a full-time position spent on coordination overhead that exists only because the stores are disconnected. At $55,000 salary, the multi-store tax is roughly $20,000 a year.

From Three Admin Panels to One
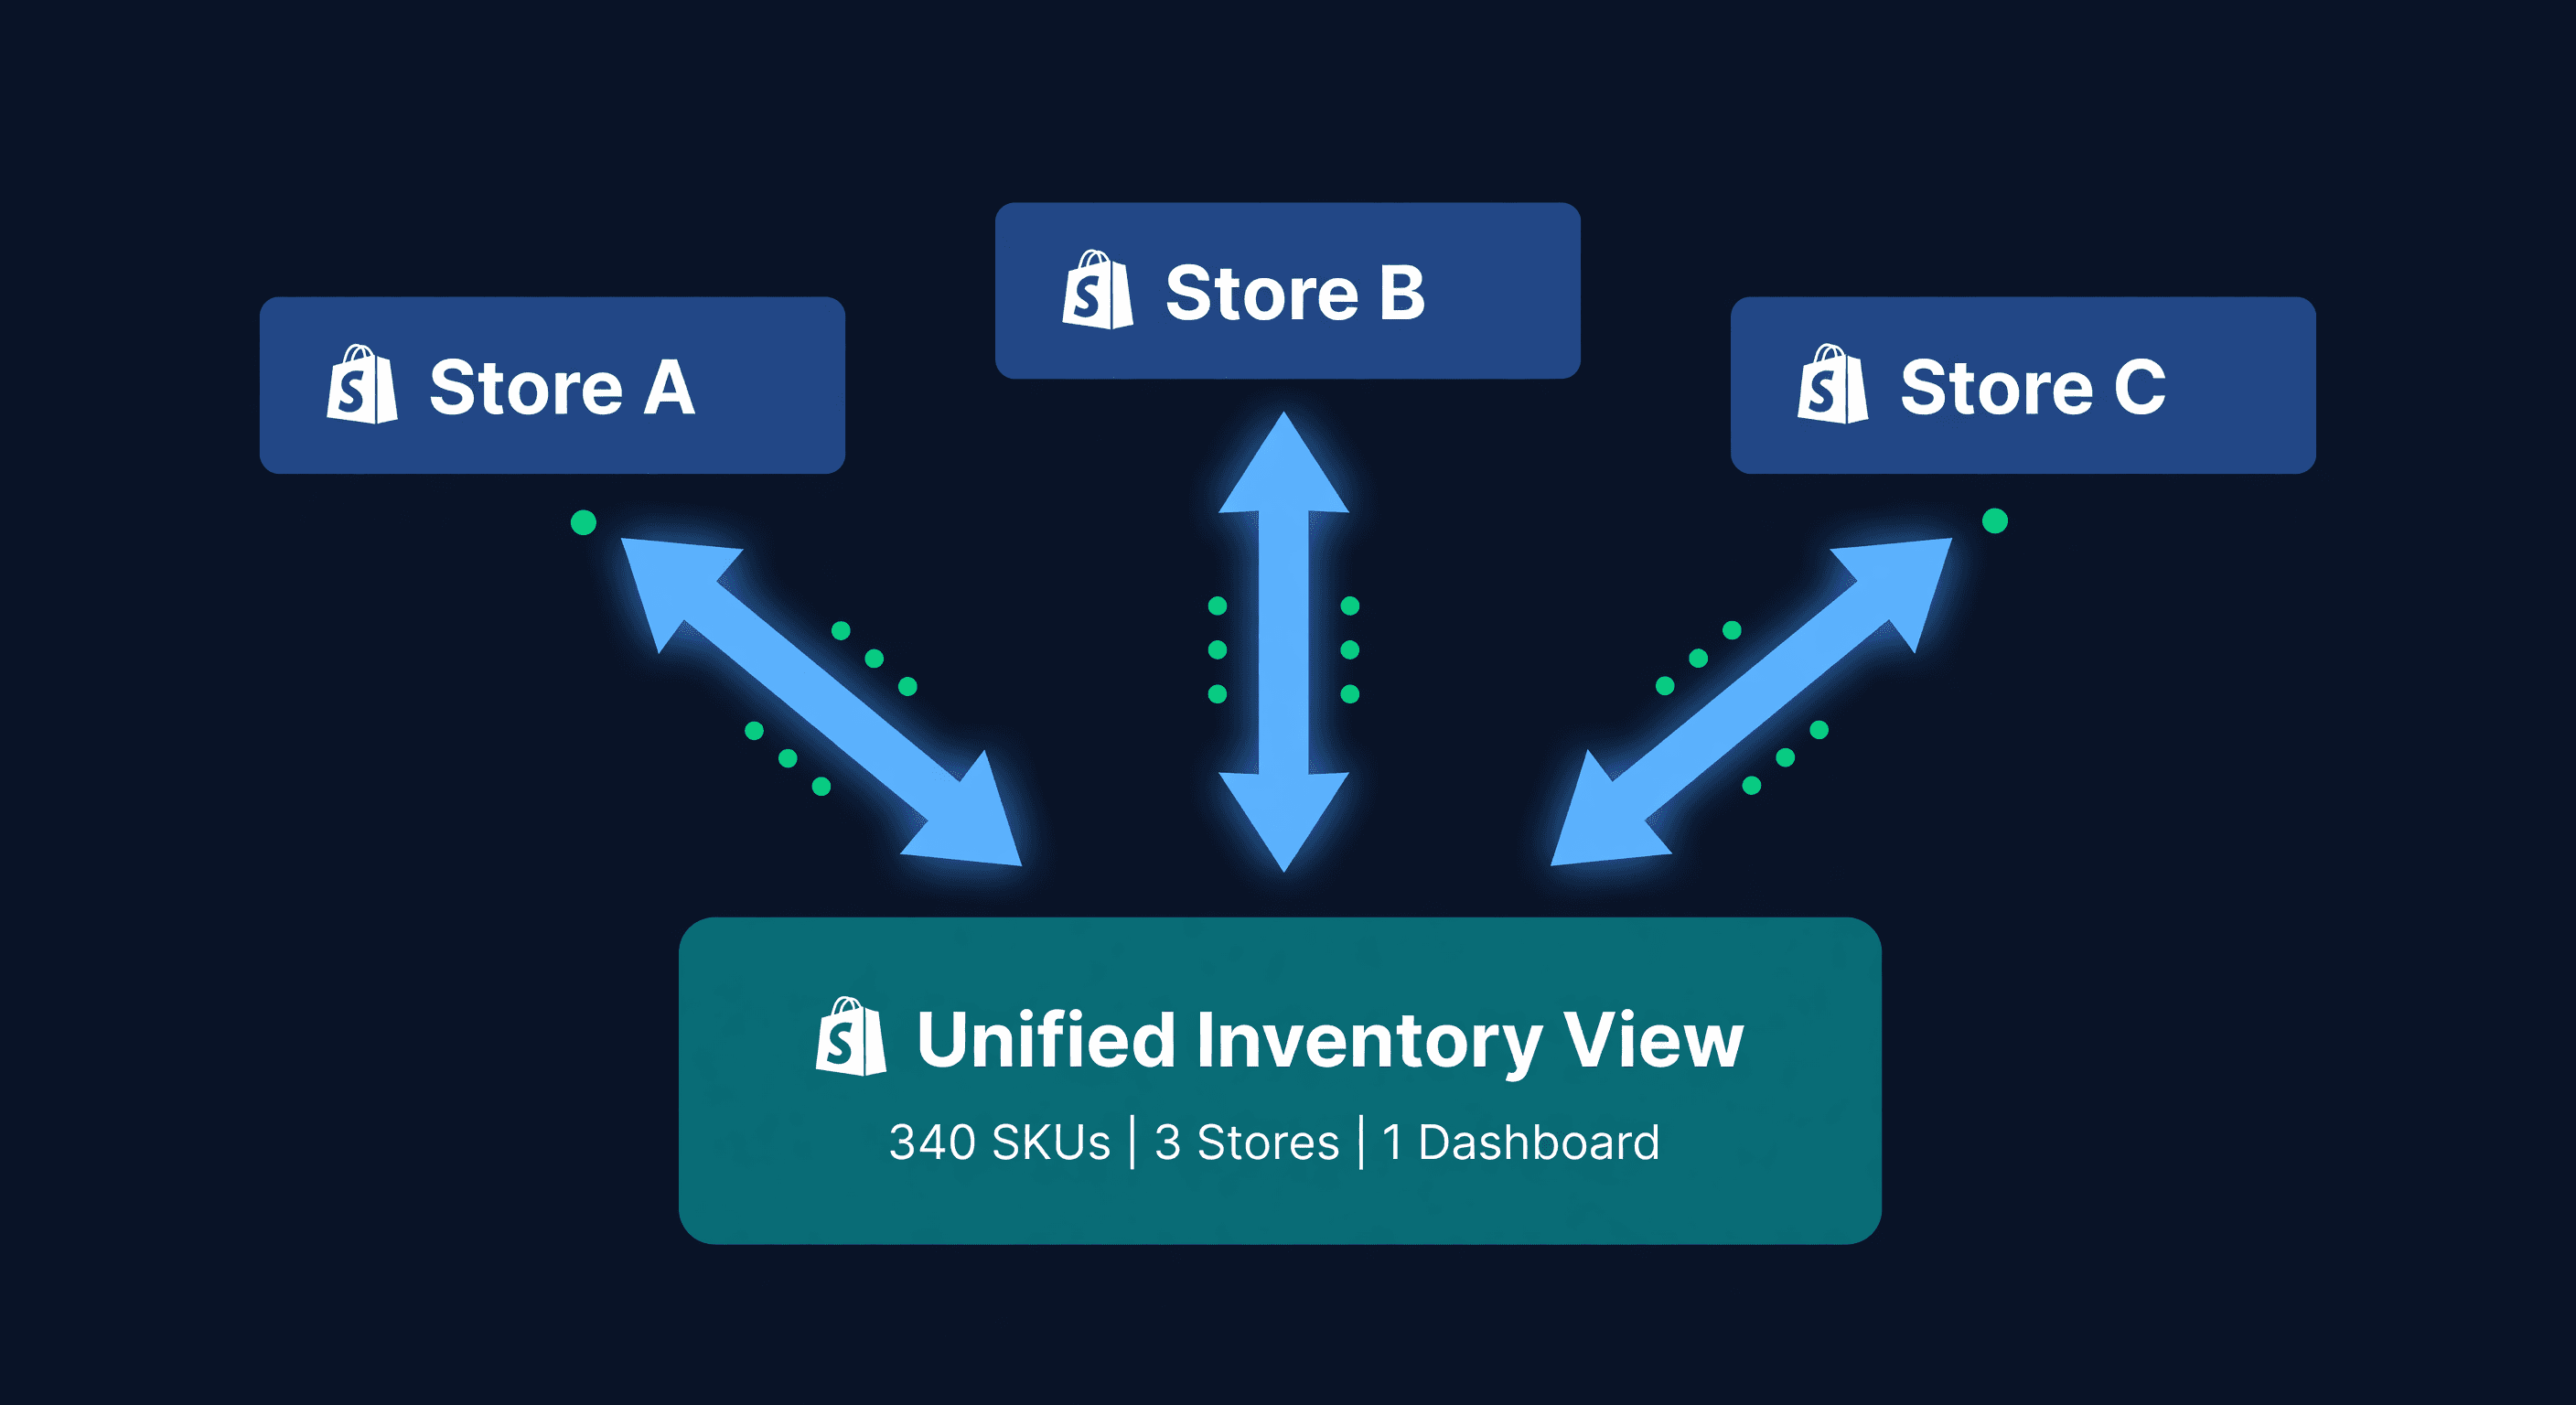
We built ReplenishRadar to collapse this exact problem. Connect all your Shopify stores -- two on Standard, five on Growth, ten on Scale -- and the system pulls inventory, orders, and product data from each store into a single view. One inventory position per SKU, calculated from actual warehouse stock. One demand forecast that combines velocity across all stores. PO suggestions that use combined demand, not per-store guesses.
Amy's 14.5-hour weekly ritual? Most of it disappears. The order consolidation happens automatically. The inventory reconciliation runs on every sync. The reorder calculations update as sales data flows in. She still investigates discrepancies and maintains the SKU map, but those 3-4 hours are genuinely useful work. The other 10 hours were just moving data between browser tabs.
Three Shopify stores, 14 hours a week in coordination overhead, $20,000 a year in labor on tasks that software should handle. Try ReplenishRadar free for 14 days ->
Related Reading:
Frequently Asked Questions
Ready to prevent stockouts?
Related Posts
Dead Stock: How to Identify, Prevent, and Liquidate Unsold Inventory
Dead stock ties up cash and warehouse space. Learn how to identify it, prevent it from accumulating, and liquidate what you already have.
Consolidating Multiple Amazon Accounts Into One View
How to unify inventory, demand data, and purchasing across multiple Amazon seller accounts -- and what you lose by keeping them separate.
OpenClaw Can Manage Your Inventory. Should It?
OpenClaw has Shopify skills, inventory alerts, and demand forecasting plugins. Here's where an AI agent works and where purpose-built inventory software wins.