Amazon IPI Score: What It Is and How to Fix It
450 Is the Number That Controls Your FBA Business
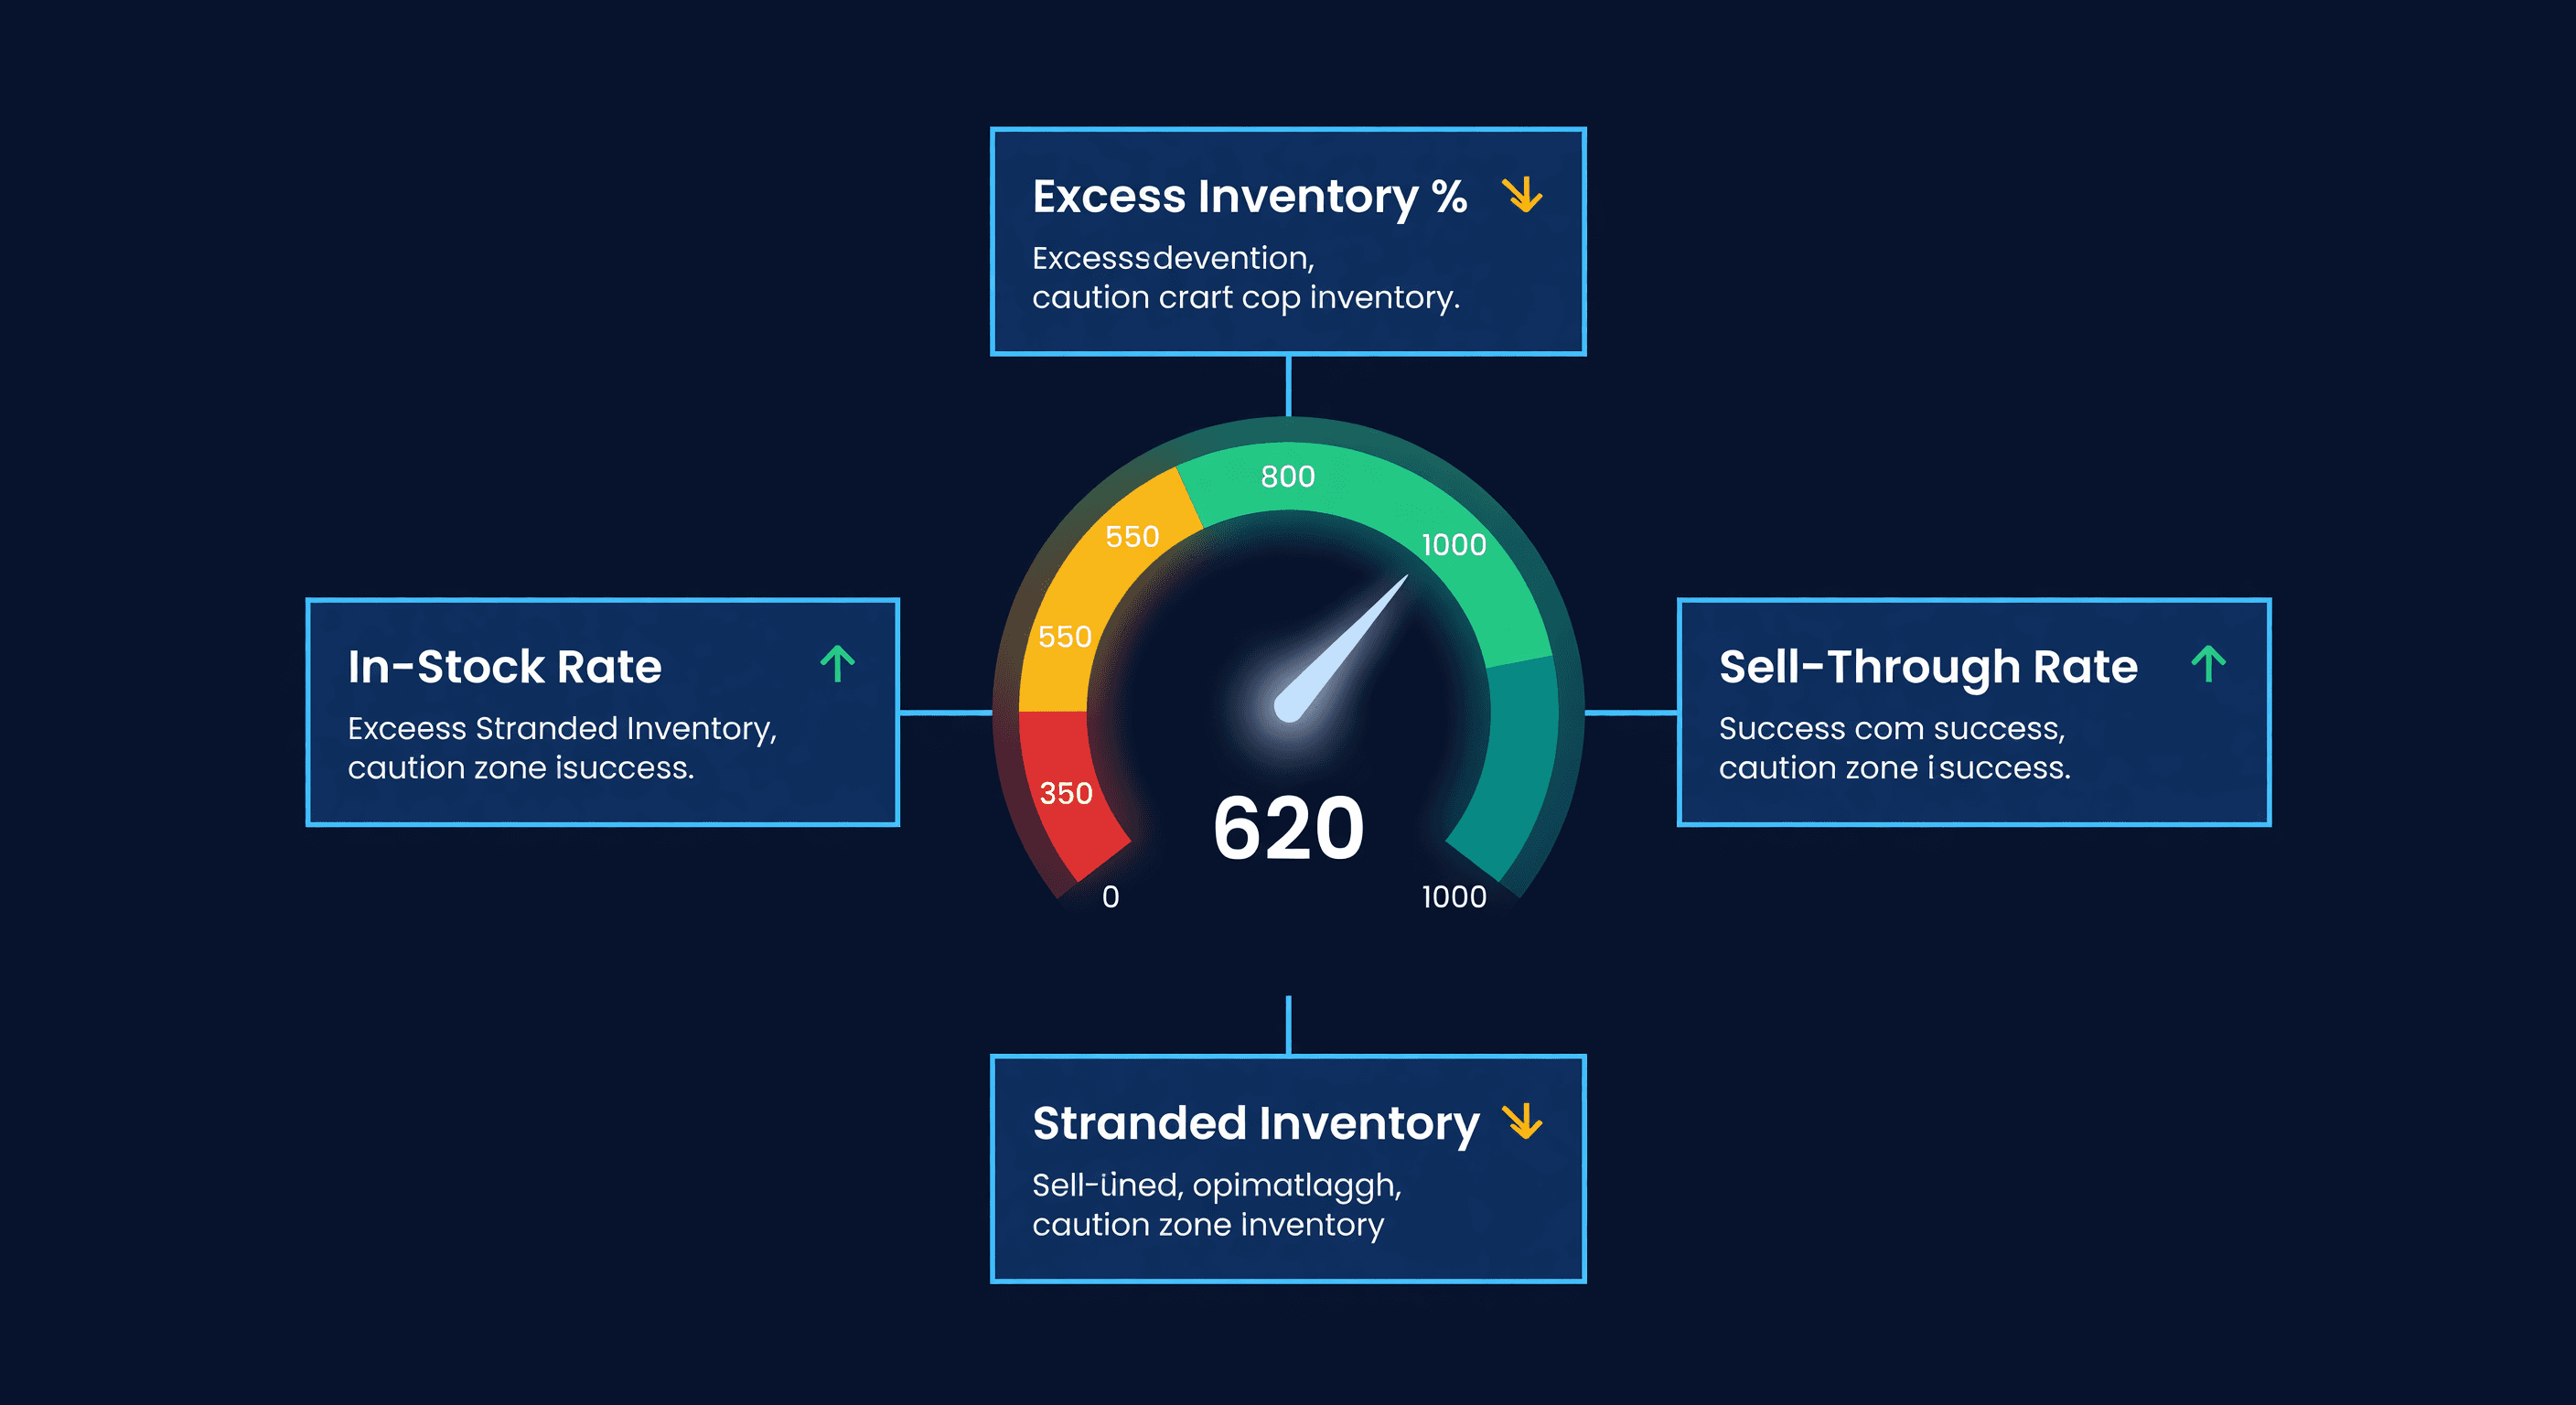
Your Amazon IPI score is a single number between 0 and 1,000 that determines how much inventory you are allowed to store at FBA. Drop below Amazon's threshold - which has hovered between 350 and 450 in recent quarters - and Amazon caps your storage volume for the next quarter. You cannot send in new shipments until you clear space.
I had a seller reach out last year who had an IPI of 380. They could not restock their best-selling product for 11 weeks because they had used their storage capacity on 200 SKUs that were selling 1-2 units per month. Their top product went out of stock on Amazon for nearly three months. That is not a storage problem. That is a revenue problem.
The Four Factors (and What Amazon Is Actually Measuring)
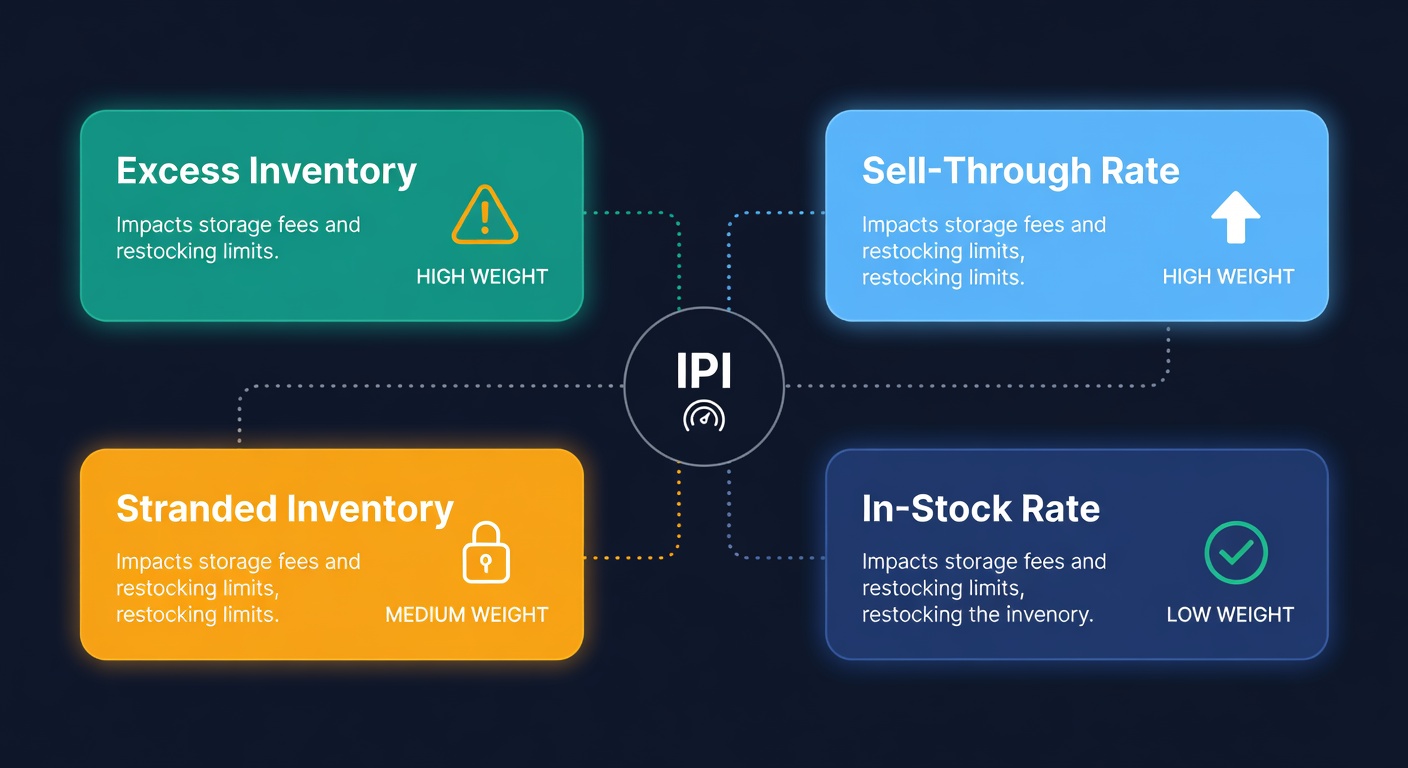
Amazon says IPI is based on four factors. They do not publish the weights. But after watching hundreds of seller accounts, I can tell you which ones actually shift the score and which ones are mostly noise.
Excess Inventory Percentage
This is the big one. Amazon flags units as "excess" when your current inventory exceeds what the algorithm estimates you will sell in the next 90 days. The calculation uses your recent sales velocity, not your opinion about future demand.
The threshold is roughly: if FBA units on hand > (90-day average daily sales x 90), those extra units count as excess.
A product selling 3 units per day should have roughly 270 units or fewer at FBA. Send 500 because you got a bulk deal from your supplier, and Amazon flags 230 units as excess. Your IPI takes the hit even though you had a perfectly rational reason for the overship.
How to fix it:
- Pull the Excess Inventory report in Seller Central (Inventory > Inventory Planning)
- Sort by estimated excess units, highest first
- For each ASIN, decide: run a promotion, create a removal order, or adjust your pricing
- Target getting excess inventory percentage below 5%. Under 3% is where it stops dragging your score down
Sell-Through Rate
Sell-through rate = units sold and shipped over the last 90 days / average units on hand during that period. Amazon wants to see you moving product, not warehousing it.
| Sell-Through Rate | What It Means |
|---|---|
| Above 7.0 | Excellent. Inventory is turning fast. |
| 3.0 - 7.0 | Healthy. Most profitable sellers land here. |
| 1.0 - 3.0 | Sluggish. You probably have dead stock mixed in. |
| Below 1.0 | Red flag. More inventory than demand by a wide margin. |
This metric is a trailing indicator. You cannot change it overnight. But every unit of dead stock sitting at FBA pushes this number down.
The fastest way to improve sell-through: remove your worst performers. Seriously. Pull the 10 ASINs with the lowest sell-through, create removal orders, and your overall rate jumps within 2-3 weeks. I have seen sellers go from 2.1 to 4.8 by removing 15% of their FBA SKU count. The products they removed were not selling anyway.
Stranded Inventory Percentage
Stranded inventory is stock at FBA with no active listing. The product is in the warehouse, Amazon is charging you storage fees, and there is zero chance of a sale because the listing is suppressed, deleted, or incomplete.
Common causes:
- Listing suppressed for missing category information
- ASIN deleted or merged by Amazon's catalog team
- Hazmat review pending with no resolution
- Intellectual property complaint took the listing down
This factor has a simple fix: go to Inventory > Fix Stranded Inventory in Seller Central. Amazon shows you every stranded ASIN and usually tells you why. Fix the listing issue or create a removal order. There is no middle ground. Stranded units are pure cost with zero revenue potential.
I check this report weekly. Takes 5 minutes. If you have more than 0.5% stranded inventory, that is too much. We built alerts for this in ReplenishRadar because it is the kind of thing that festers quietly - you do not notice 12 units stranded here, 8 there, until the total is 200 units across 30 ASINs and your IPI has been sliding for weeks.
Target: 0% stranded inventory. Not "low." Zero.
Read our full guide on fixing stranded inventory if this is a recurring problem.
In-Stock Rate
Amazon tracks how often your FBA-replenishable ASINs are actually in stock. This is the one factor where sellers get confused because it seems like it should reward you for sending more inventory. It does, sort of. But it only applies to products Amazon has identified as "replenishable" - products with consistent recent sales that Amazon expects you to keep stocked.
The nuance: stocking up on slow movers does not help your in-stock rate. Amazon does not count ASINs selling 1 unit per month as replenishable. The factor tracks your top performers - the products that matter.
If you stock out on your best ASINs regularly, this factor drags your score. The fix is better restock planning with realistic lead times. Most stockouts I see happen because the seller used Amazon's default restock recommendation, which assumes faster replenishment than most sellers can actually achieve.
This factor carries less weight than excess inventory and sell-through. I would not sacrifice the other two to boost in-stock rate.
How the Factors Interact
Here is what trips people up. These four factors pull in opposite directions.
Sending more inventory to FBA improves your in-stock rate but risks increasing excess inventory percentage. Removing slow movers improves sell-through and excess inventory but might lower your in-stock rate if you remove a replenishable ASIN. The game is balance, and the scale tips differently depending on your catalog.
My rule of thumb: fix stranded first (no downside), reduce excess second (biggest IPI weight), and only worry about in-stock rate after the first two are clean. Sell-through improves naturally when you stop diluting it with dead products.
Score Thresholds and What They Mean
| IPI Score Range | Storage Impact | What to Do |
|---|---|---|
| 700+ | Maximum capacity allocation | Maintain. You are in great shape. |
| 550-699 | No restrictions | Comfortable zone. Focus on keeping it here. |
| 450-549 | Borderline | Amazon may or may not restrict. Do not gamble. |
| 350-449 | Storage volume limits applied | Aggressive cleanup needed. 4-6 week fix. |
| Below 350 | Severe limits, possible overage fees | Emergency mode. Remove excess, fix stranded, immediately. |
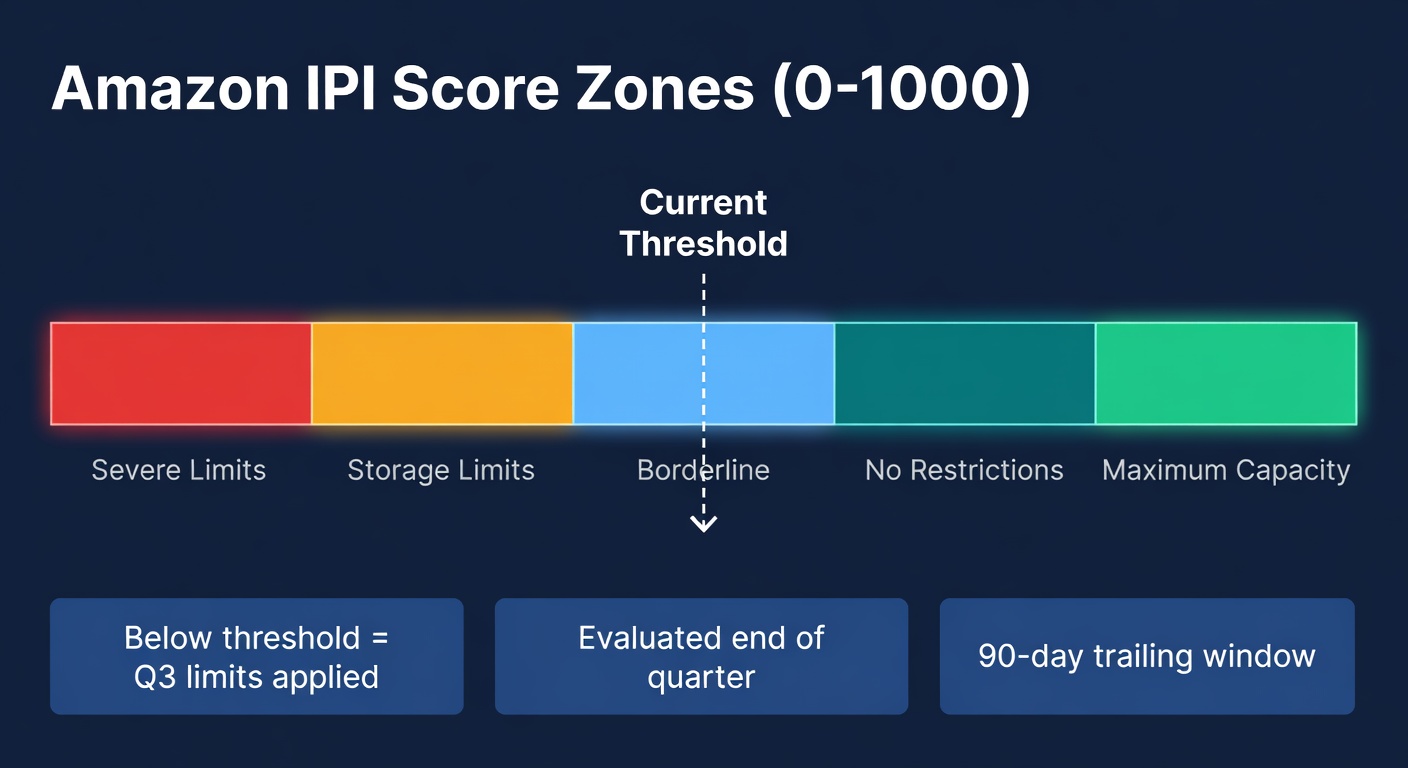
Amazon evaluates your score at the end of each quarter (around week 13) and applies the result to the following quarter. A bad Q2 score restricts your Q3 storage. That is particularly painful because Q3 is when you need to build inventory for Q4.
The lag is the real danger. Your IPI today reflects the last 90 days. Decisions you made 3 months ago are grading you now.
The IPI-Storage Limit Connection
When your IPI drops below threshold, Amazon assigns a storage volume limit in cubic feet. This is not per-ASIN. It is a total cap across all your FBA inventory.
Here is what that looks like in practice. Say your limit is 120 cubic feet and you are currently using 115. You need to send in 200 units of your best seller, which takes up 15 cubic feet. You cannot. You are 10 cubic feet over the limit before that shipment even goes out. Meanwhile, 40 cubic feet of that 115 is dead stock you should have pulled months ago.
The fix is never "send less of good products." It is always "remove bad products to make room for good ones."
A Practical IPI Improvement Plan
If your score is below 500, here is what I would do in order. This is the sequence, not a menu of options.
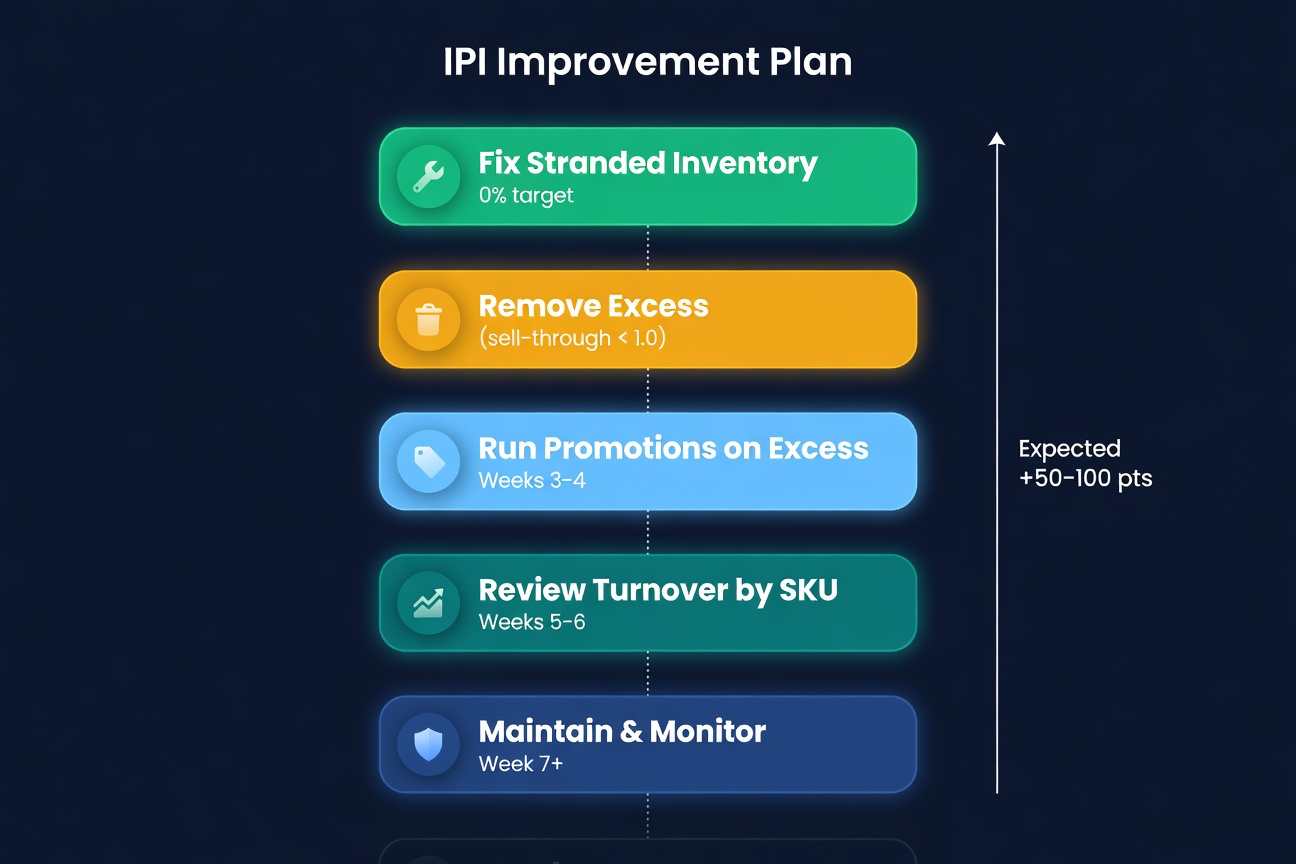
Week 1: Fix all stranded inventory. Every unit. This is the fastest factor to change and the easiest to get to 0%. Check the Fix Stranded Inventory page and resolve or remove everything.
Week 2: Pull the Excess Inventory report. Sort by estimated storage cost. Create removal orders for anything with a sell-through below 1.0 and no upcoming seasonal demand. Yes, you are taking a loss. The loss is smaller than 3 more months of storage fees plus the IPI penalty.
Week 3-4: Run promotions on excess inventory that has decent sell-through (1.0-3.0) but too many units at FBA. Coupons, Lightning Deals, price reductions. The goal is to bring units in line with 90-day demand, not to liquidate everything.
Week 5-6: Review your inventory turnover by SKU. Any product turning less than twice a year at FBA should either get a smaller send-in allocation or move to merchant-fulfilled.
Week 7+: Maintain. Check stranded inventory weekly. Review the excess report biweekly. Adjust send-in quantities to match actual demand, not optimistic forecasts.
Most sellers see a 50-100 point improvement within 6 weeks using this sequence.
Tracking IPI Factors in ReplenishRadar
This is why we built dead stock identification and sell-through tracking into ReplenishRadar. The system flags products with declining velocity before they become excess inventory in Amazon's eyes. Stranded inventory alerts catch listing issues within hours of Amazon suppressing an ASIN, not weeks later when you notice the IPI drop. And because the reorder engine factors in your current FBA capacity alongside demand, it recommends send-in quantities that keep your inventory limits in check rather than blowing past them.
Try ReplenishRadar free for 14 days -> and see which SKUs are dragging your IPI down.
The Score Is a Symptom
A low IPI score is not the disease. It is the fever telling you something is wrong with how you manage FBA inventory. The fix is never gaming the metric. It is fixing the underlying problems: too much slow inventory, not enough fast inventory, neglected listings, and reactive restocking.
Every point of IPI improvement above 450 gives you more storage room, which gives you more flexibility, which lets you stock more of what actually sells. That flywheel works in both directions. Let it spin the wrong way and you end up locked out of FBA during your busiest quarter.
Related Reading:
Frequently Asked Questions
Get notified when it matters
Amazon and Shopify change the rules constantly. We'll email you when something affects your business.
See what your inventory is really doing
Doing $5M+ in revenue? Talk to our team
Related Posts
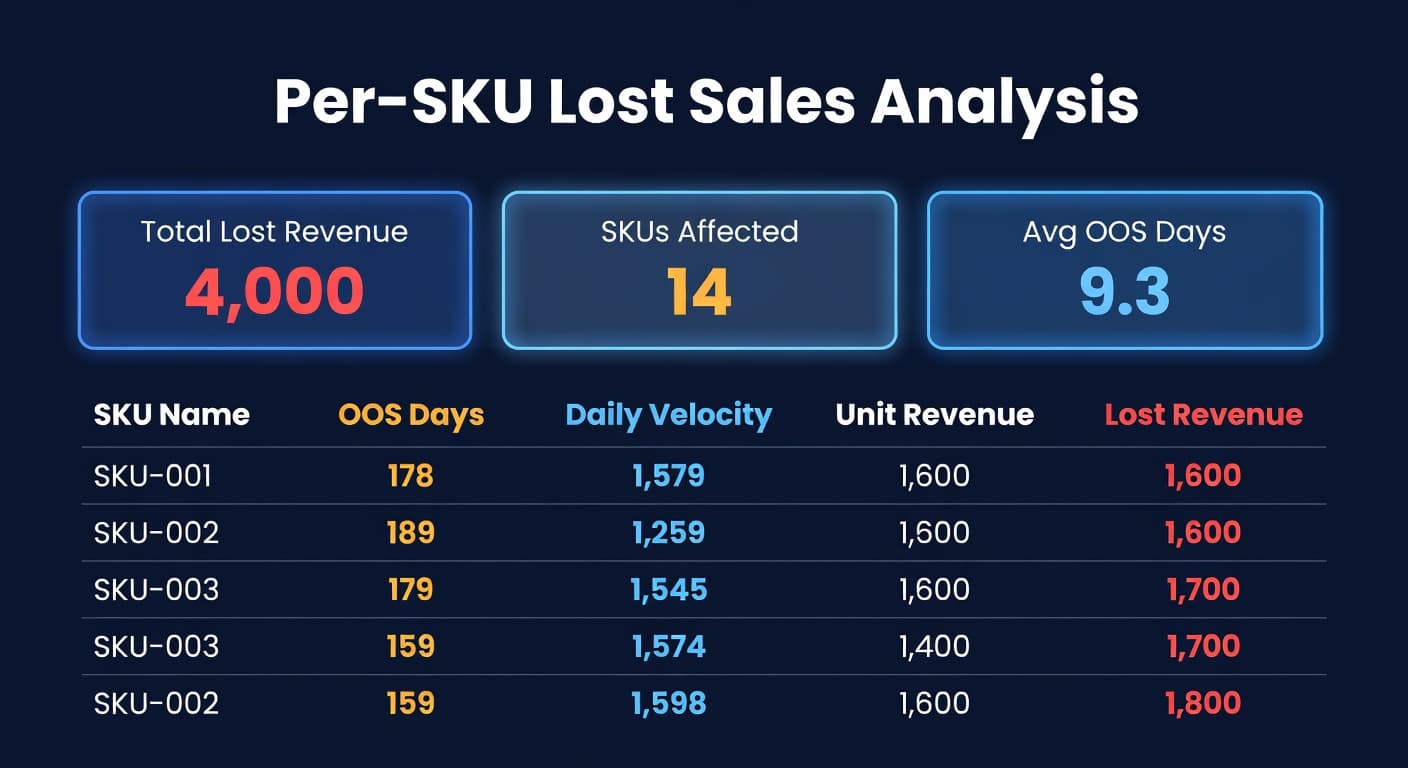
What Your Stockouts Actually Cost (Per-SKU)
Most sellers track what sold but not what didn't. Per-SKU lost sales analysis reveals the exact revenue each stockout costs.
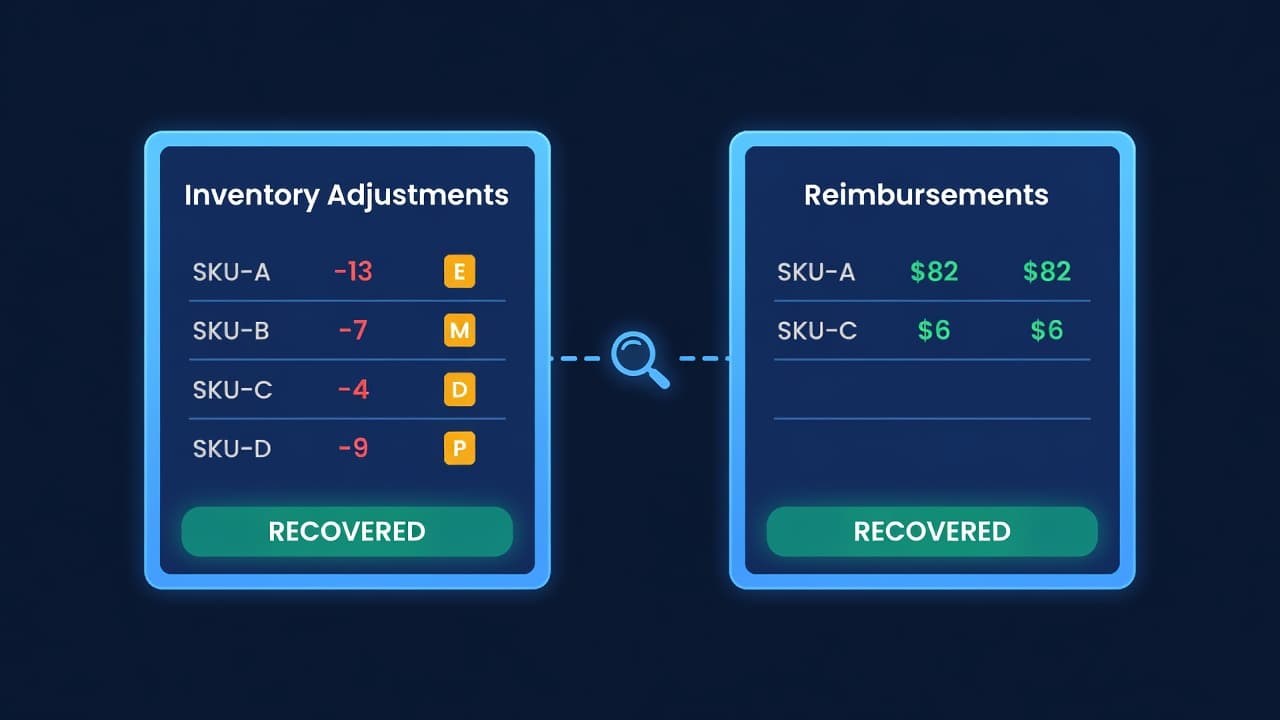
Amazon Lost Inventory: How to Get Reimbursed
How to find lost or damaged FBA inventory, file reimbursement claims with Amazon, and stop leaving 1-3% of your FBA revenue on the table.
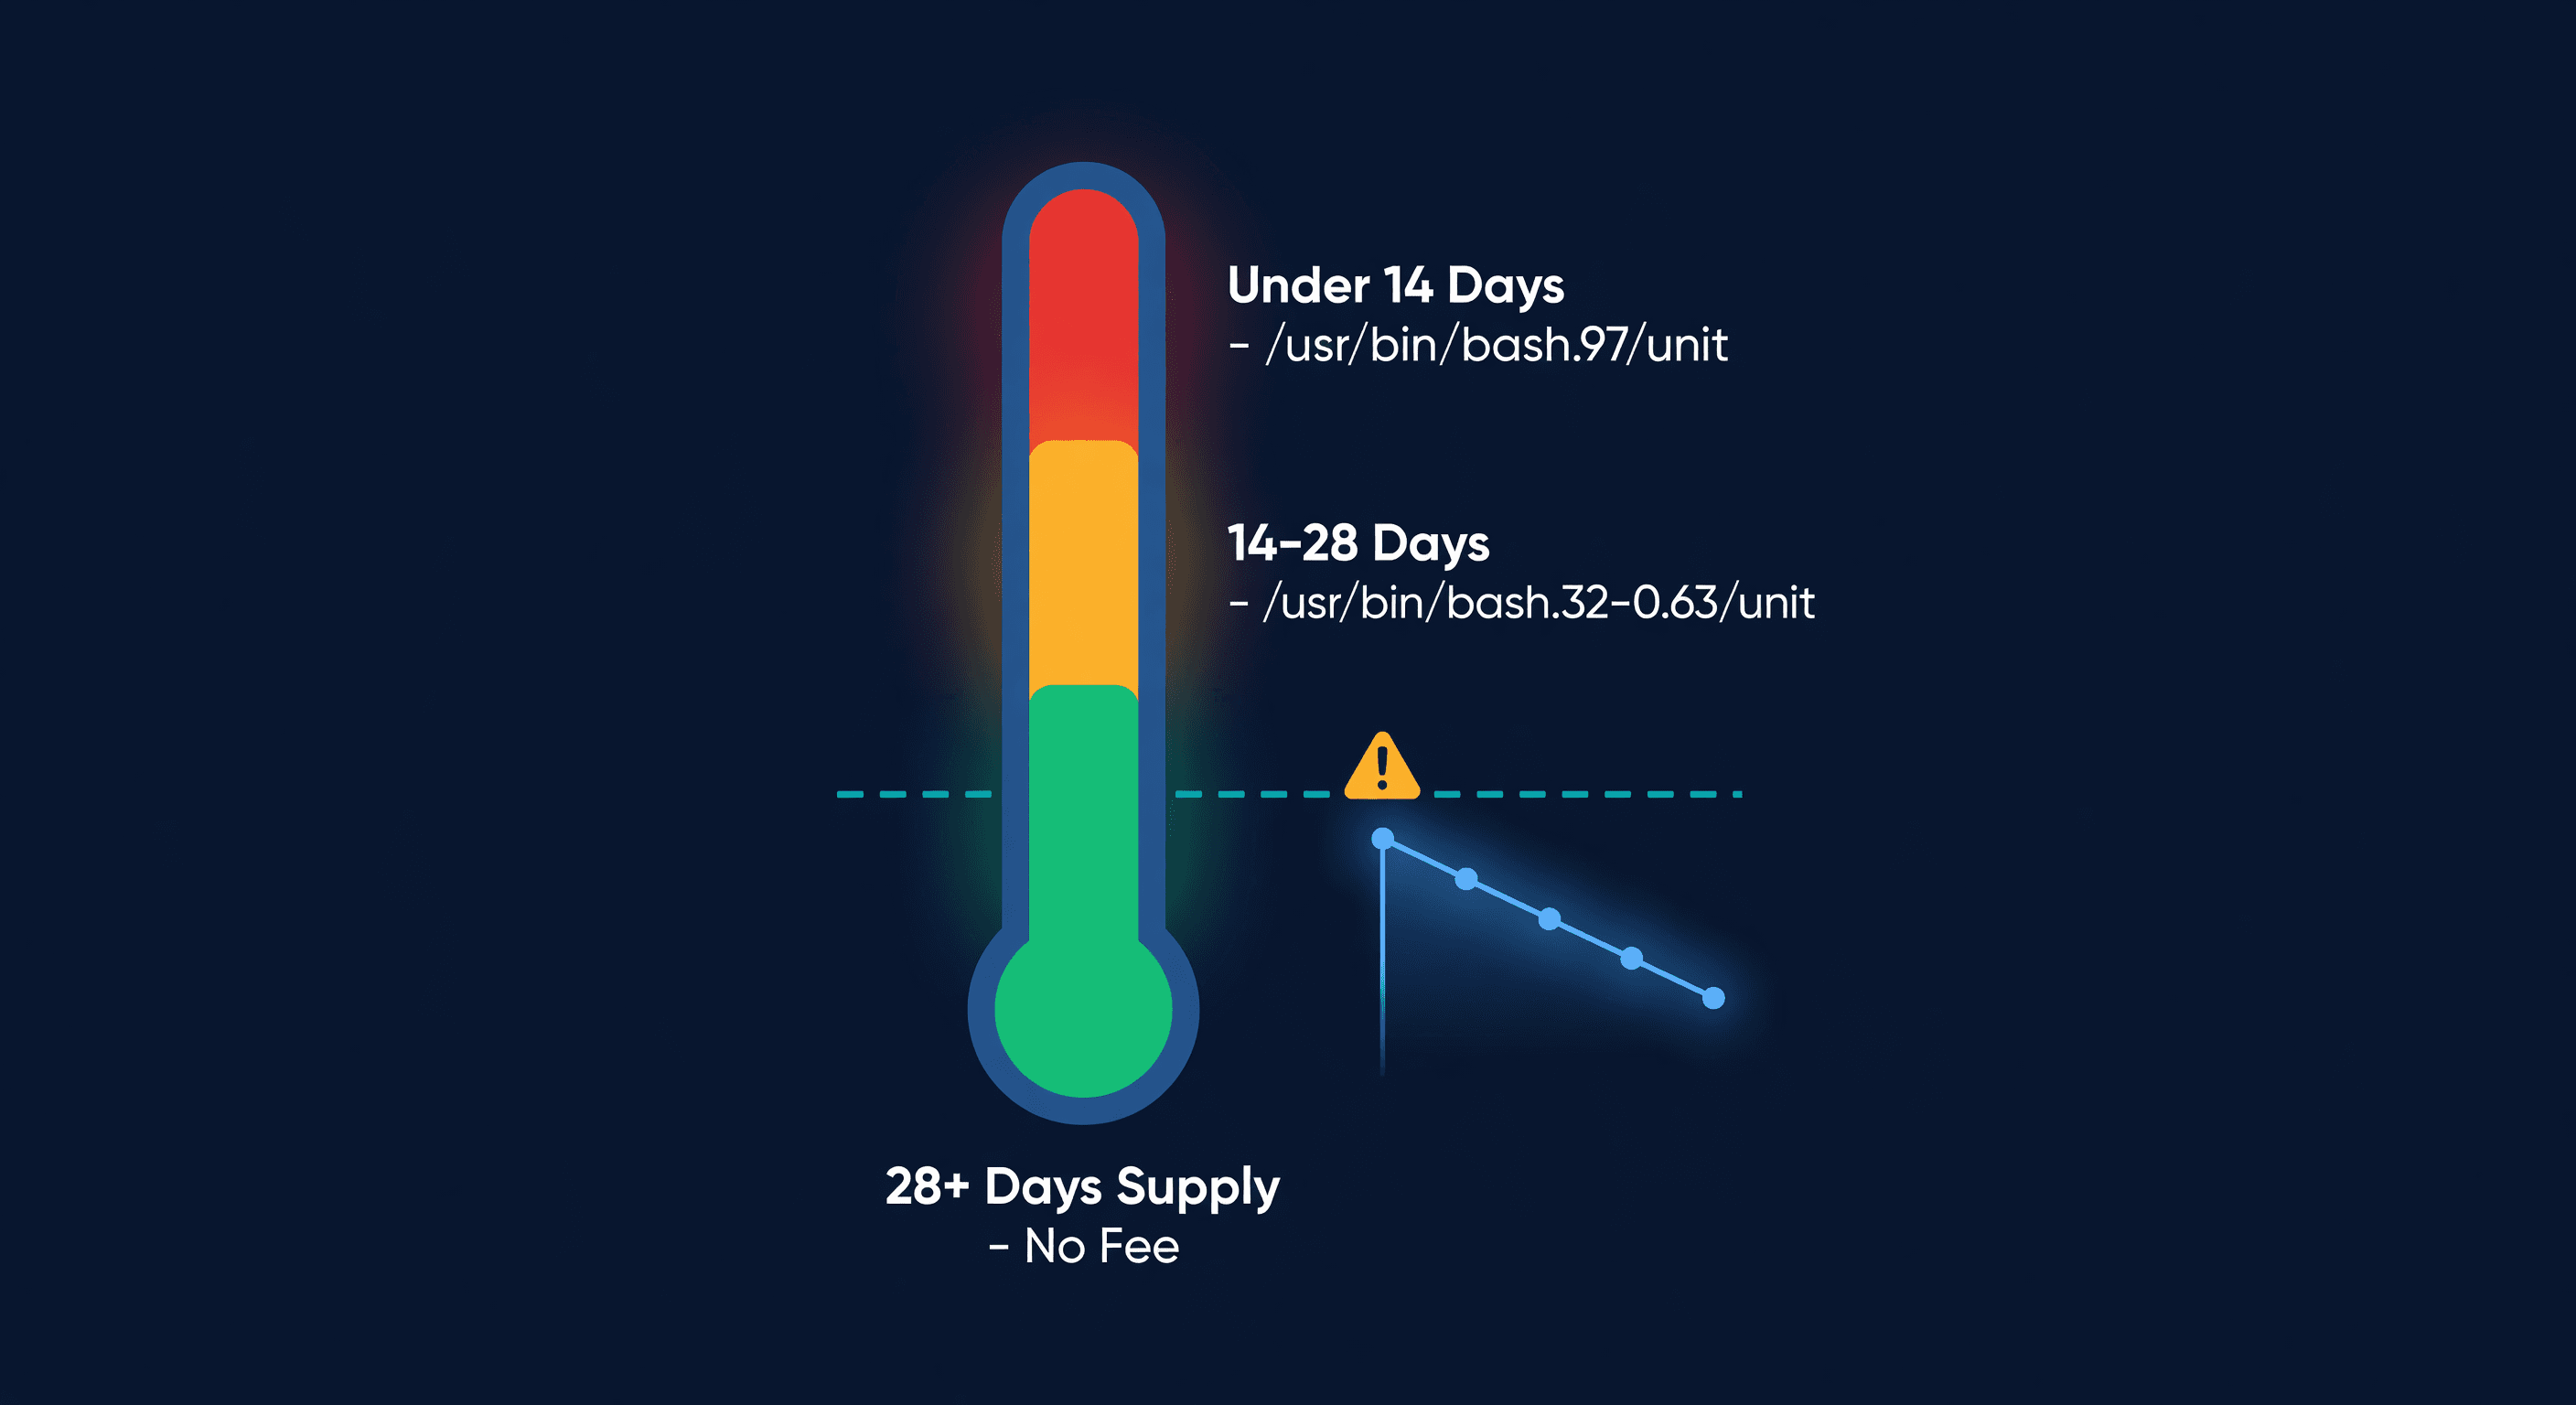
Amazon Low-Inventory-Level Fee Explained
How Amazon's low-inventory-level fee works, which products are exempt, fee amounts by days of supply, and how to avoid it without triggering storage fees.
