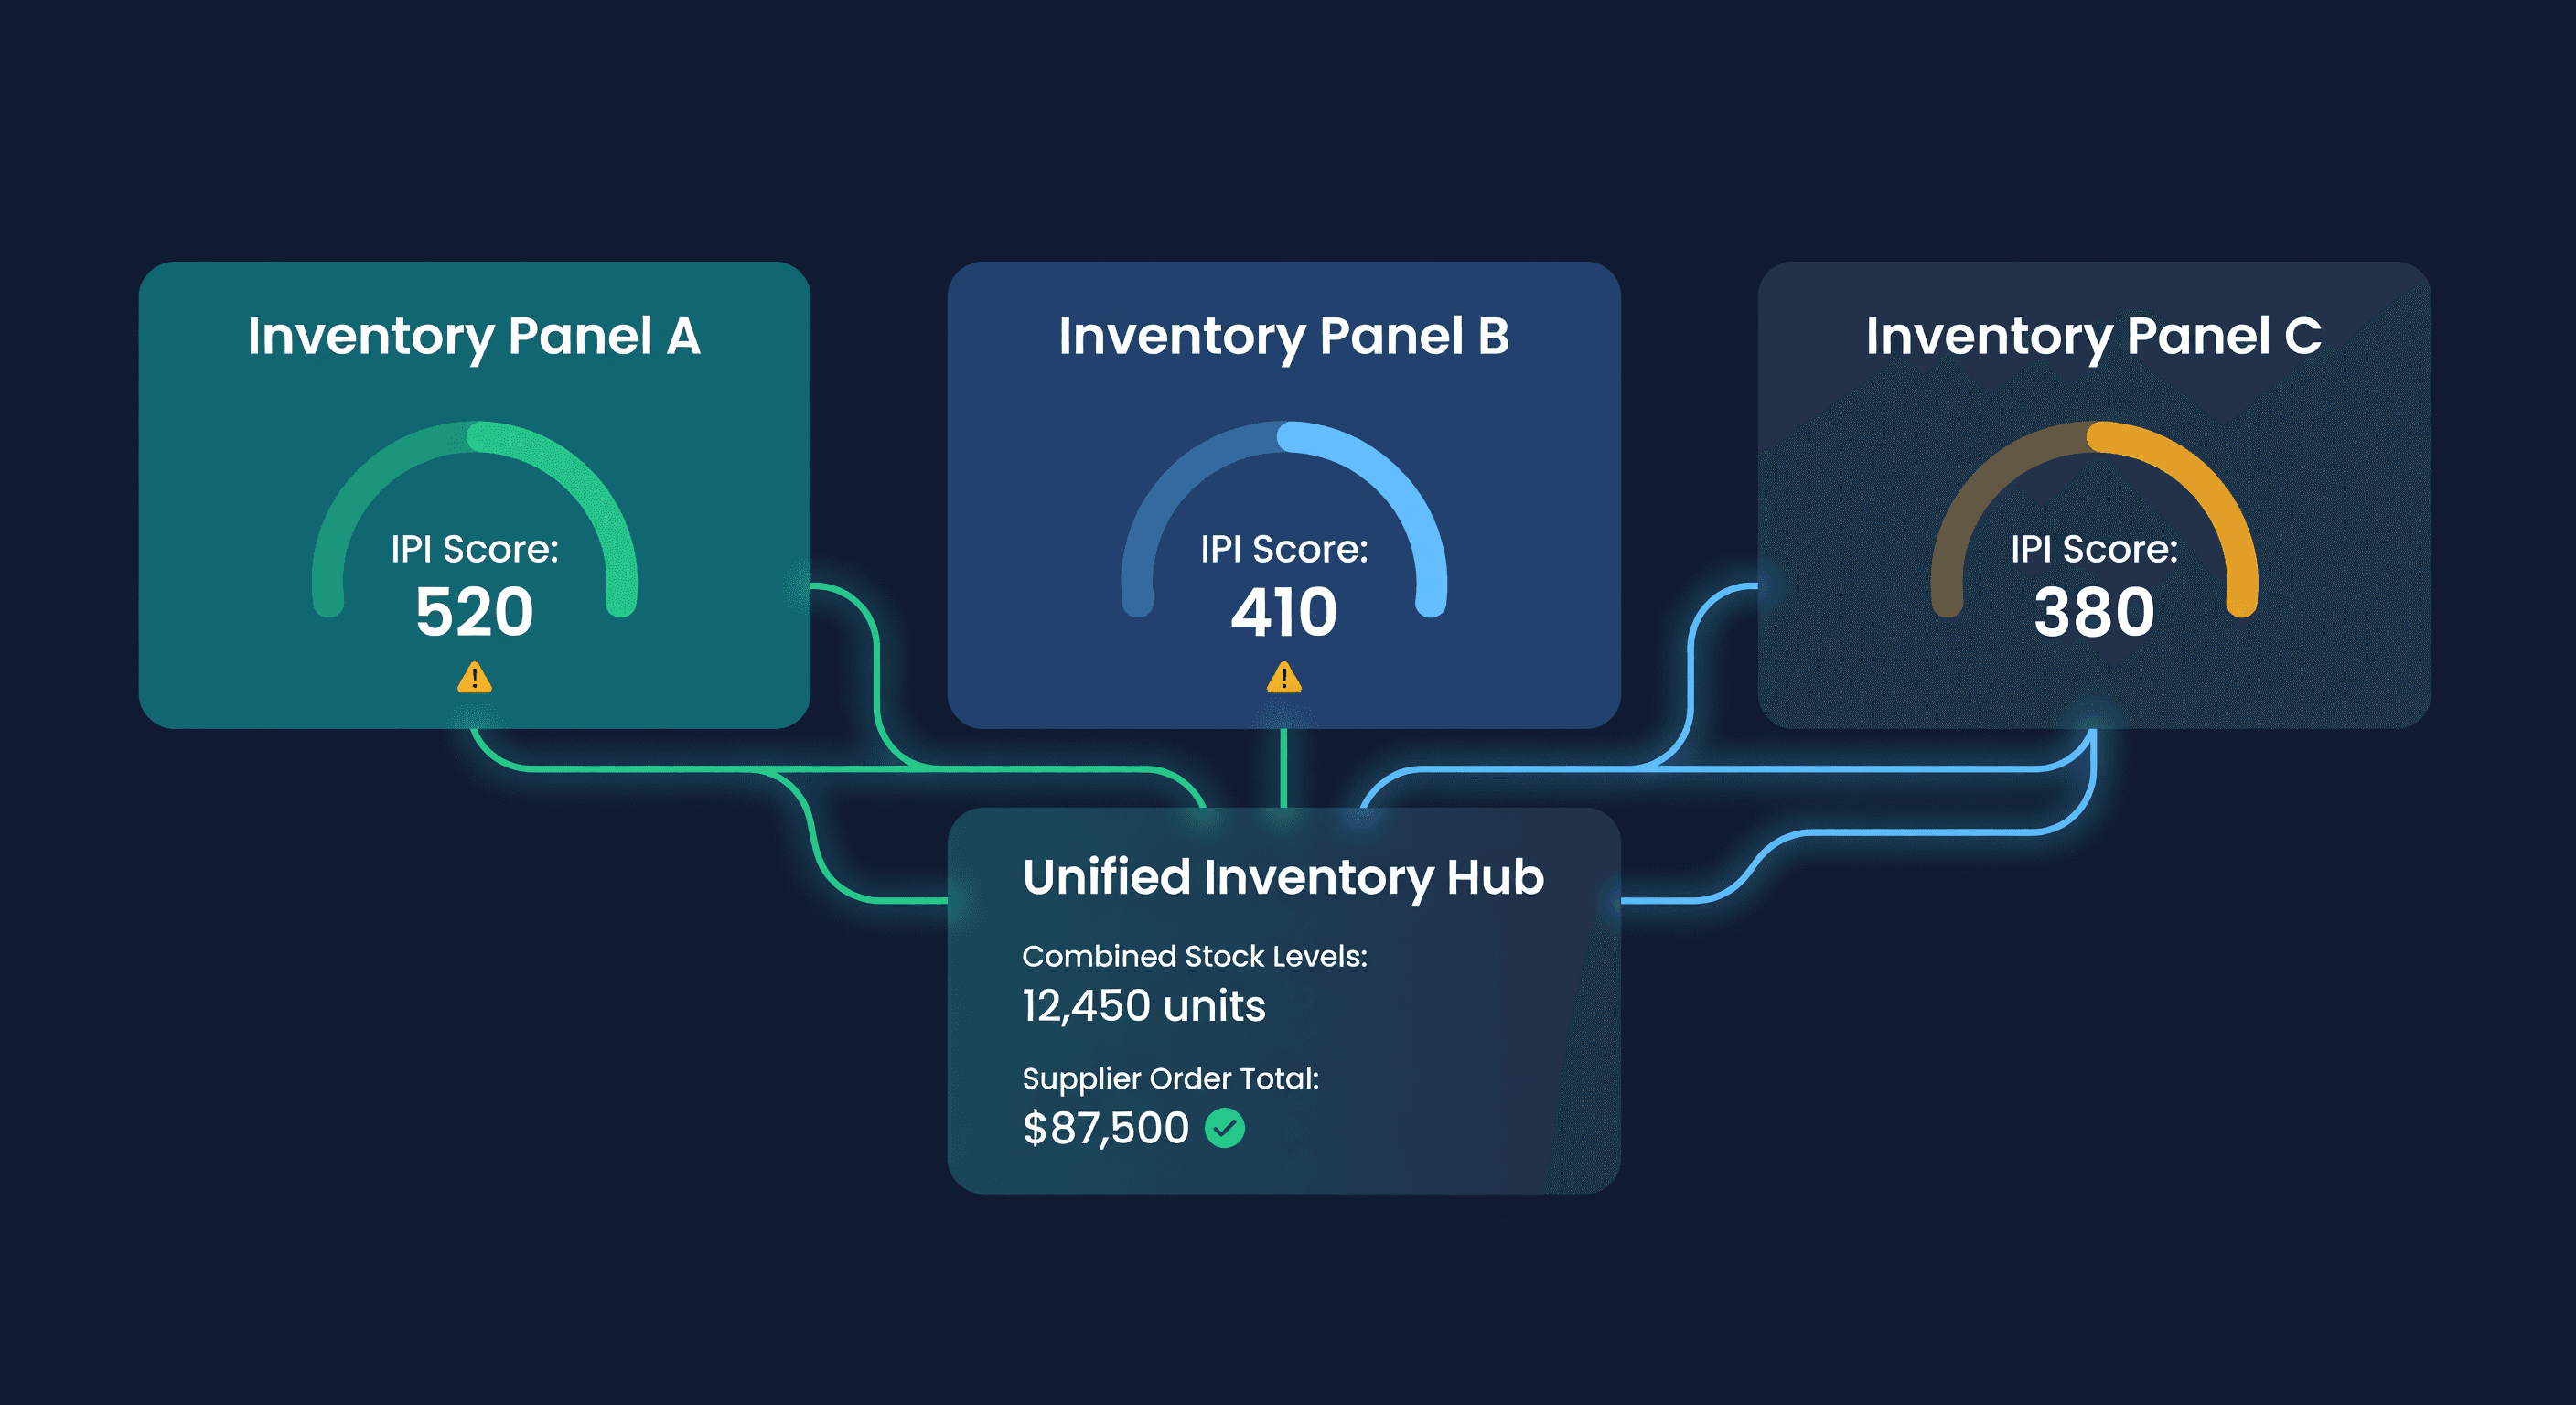
Multiple Amazon Accounts: Inventory Planning Guide
Key takeaway: Running multiple Amazon accounts without consolidated planning costs 8-15% per unit in missed volume discounts from suppliers. Combine demand across all accounts for supplier negotiations, and use one dashboard to see total inventory position.
The Seller Central Tab Problem
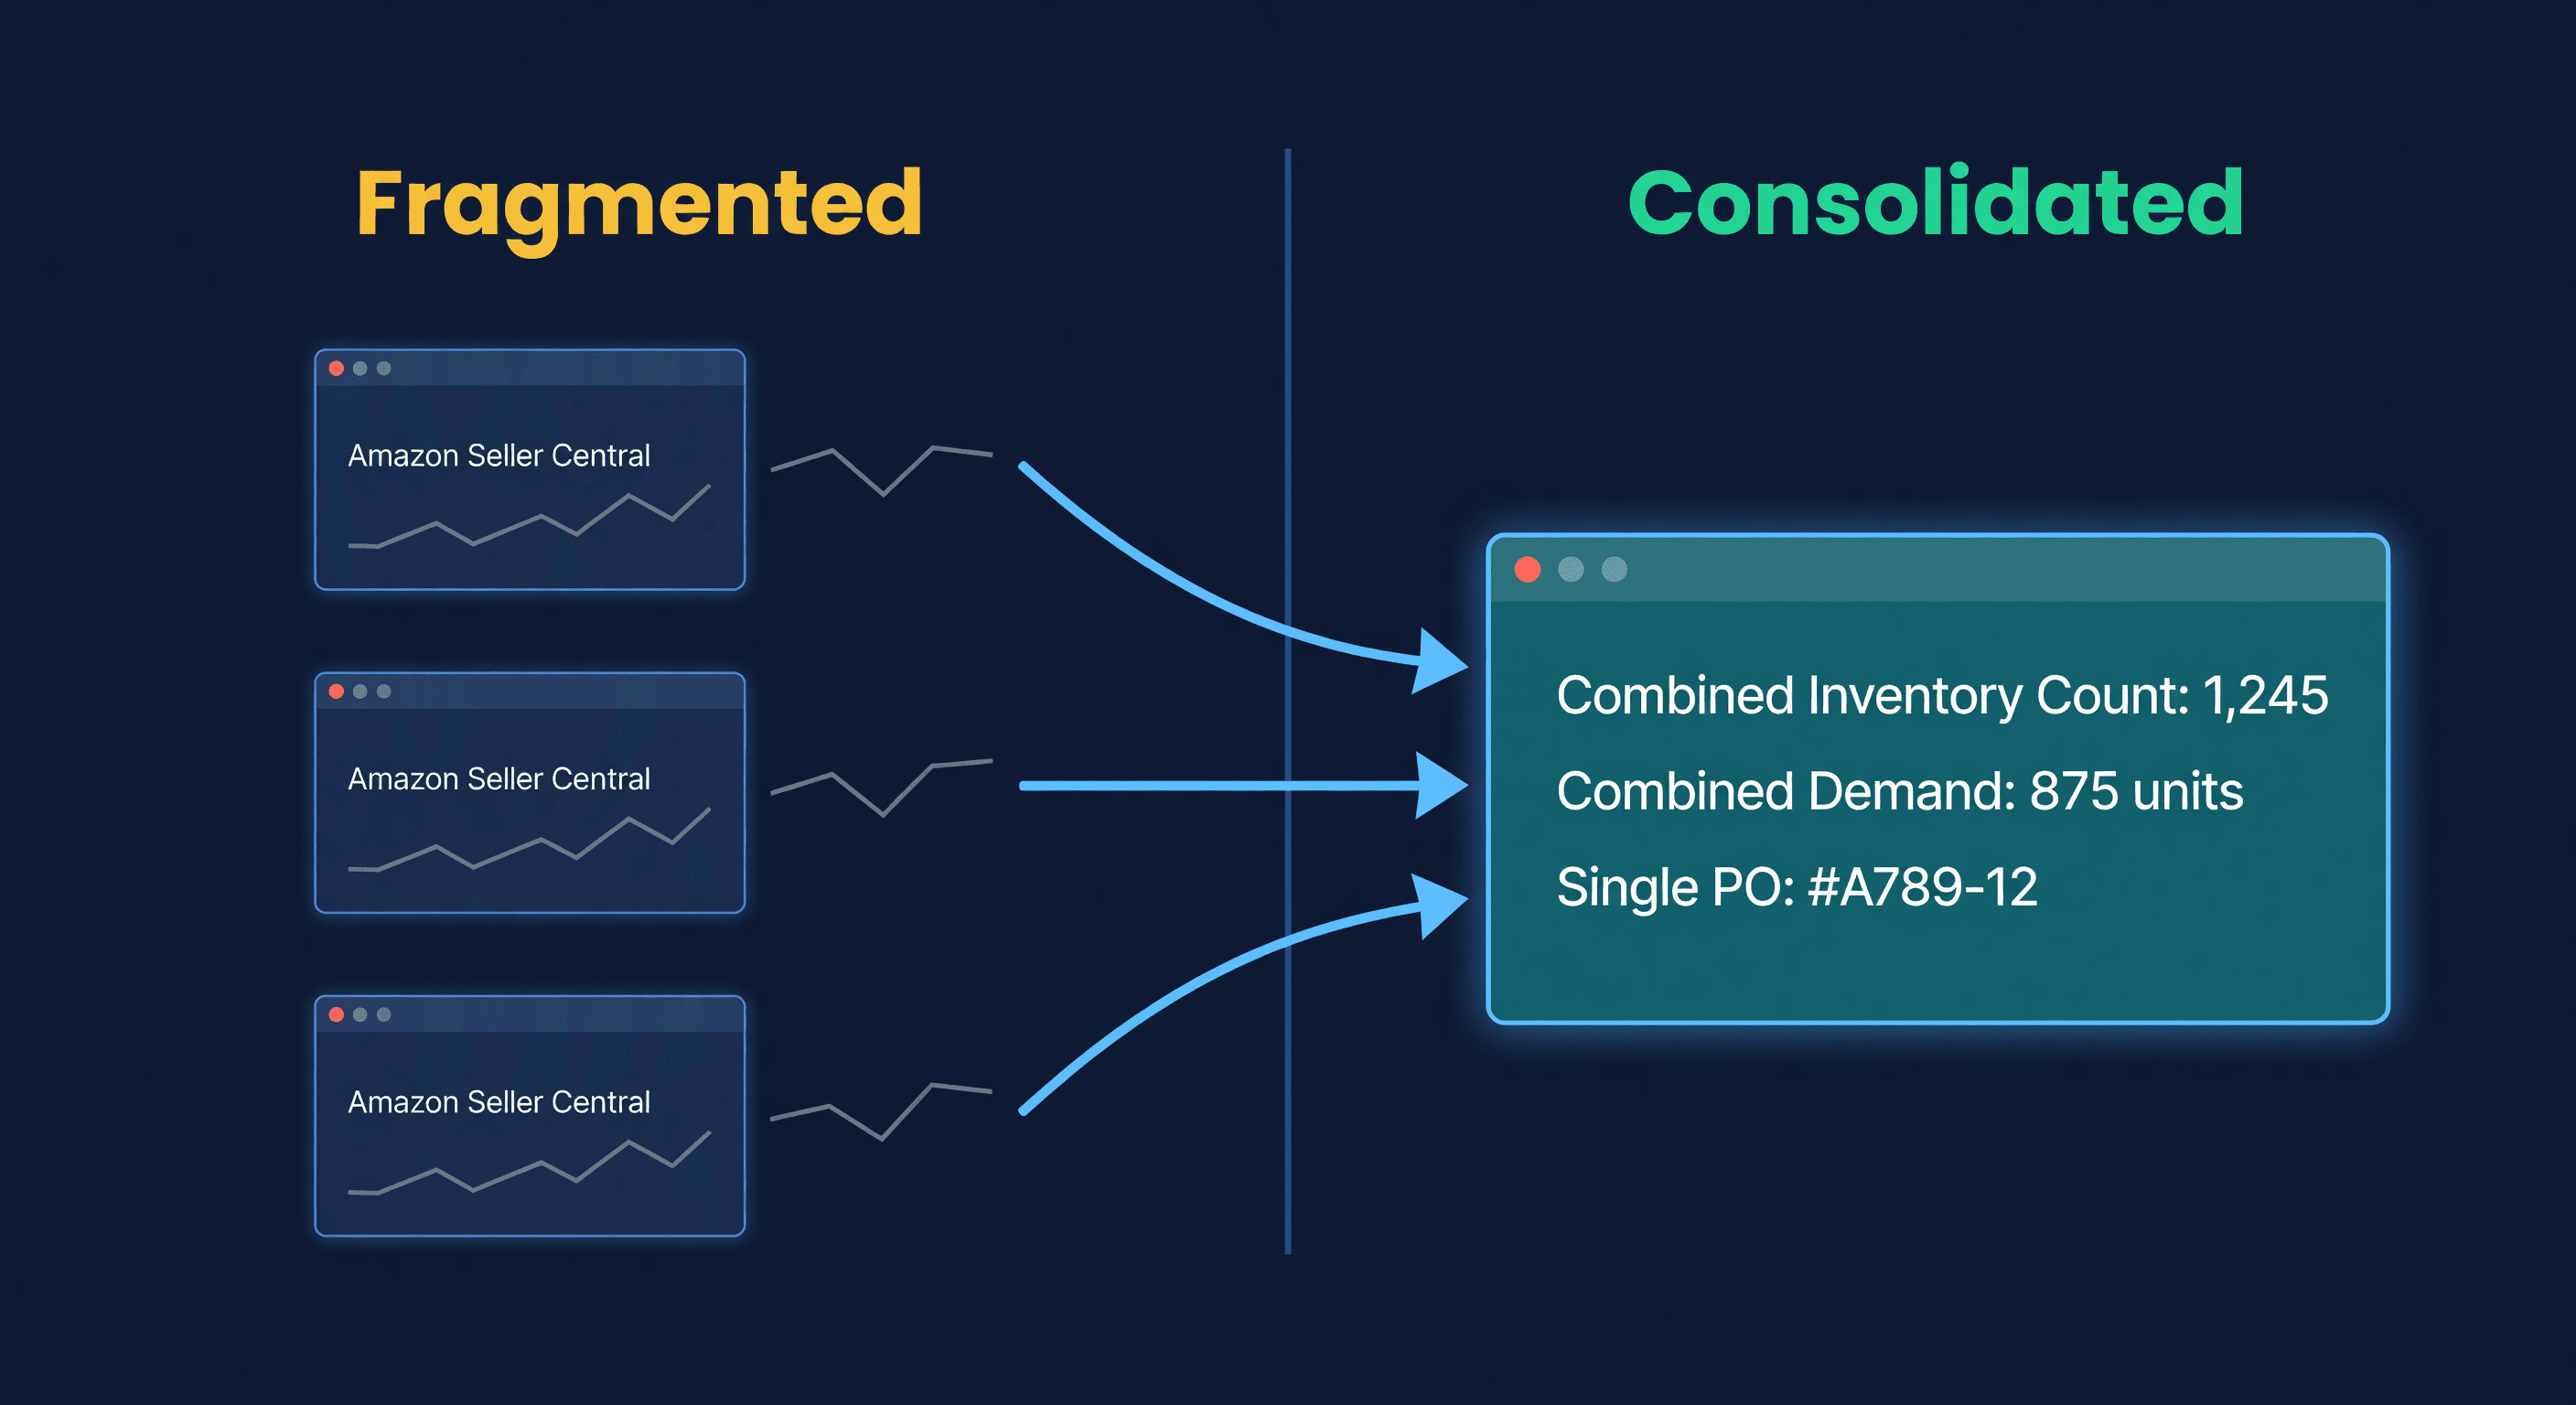
Seller Central was built for one account. Open a second account and you get a second login, a second dashboard, a second set of reports. Nothing connects them.
I know a seller who runs three Amazon accounts - one he built, two he acquired. Every Monday morning he opens three browser tabs, exports three inventory reports, pastes them into a master spreadsheet, and spends two hours figuring out what to order. He has been doing this for 18 months. He knows it is wrong. He just has not found the time to fix it.
That spreadsheet ritual is a symptom. The actual problem is that Amazon gives you zero visibility into your total inventory position across accounts.
Why Sellers Have Multiple Accounts
Amazon approves multiple accounts for legitimate business reasons. The most common ones we see:
| Reason | Typical Setup | Planning Challenge |
|---|---|---|
| Separate brands | Account per brand, different product lines | Shared suppliers, separate demand patterns |
| Regional expansion | US + Canada, US + UK/EU | Currency differences, separate FBA networks |
| Acquired businesses | Bought a competitor, inherited their account | Integrating demand data, consolidating suppliers |
| Category separation | Electronics on one, home goods on another | Different seasonality, different IPI dynamics |
| Risk isolation | Keeping account health risk separate | Duplicate overhead, missed volume discounts |
The reason matters less than the result: fragmented data, redundant processes, and purchasing decisions made with an incomplete picture.
Three Ways Fragmentation Costs You
You Miss Volume Discounts
This is the one that hurts most and gets noticed least.
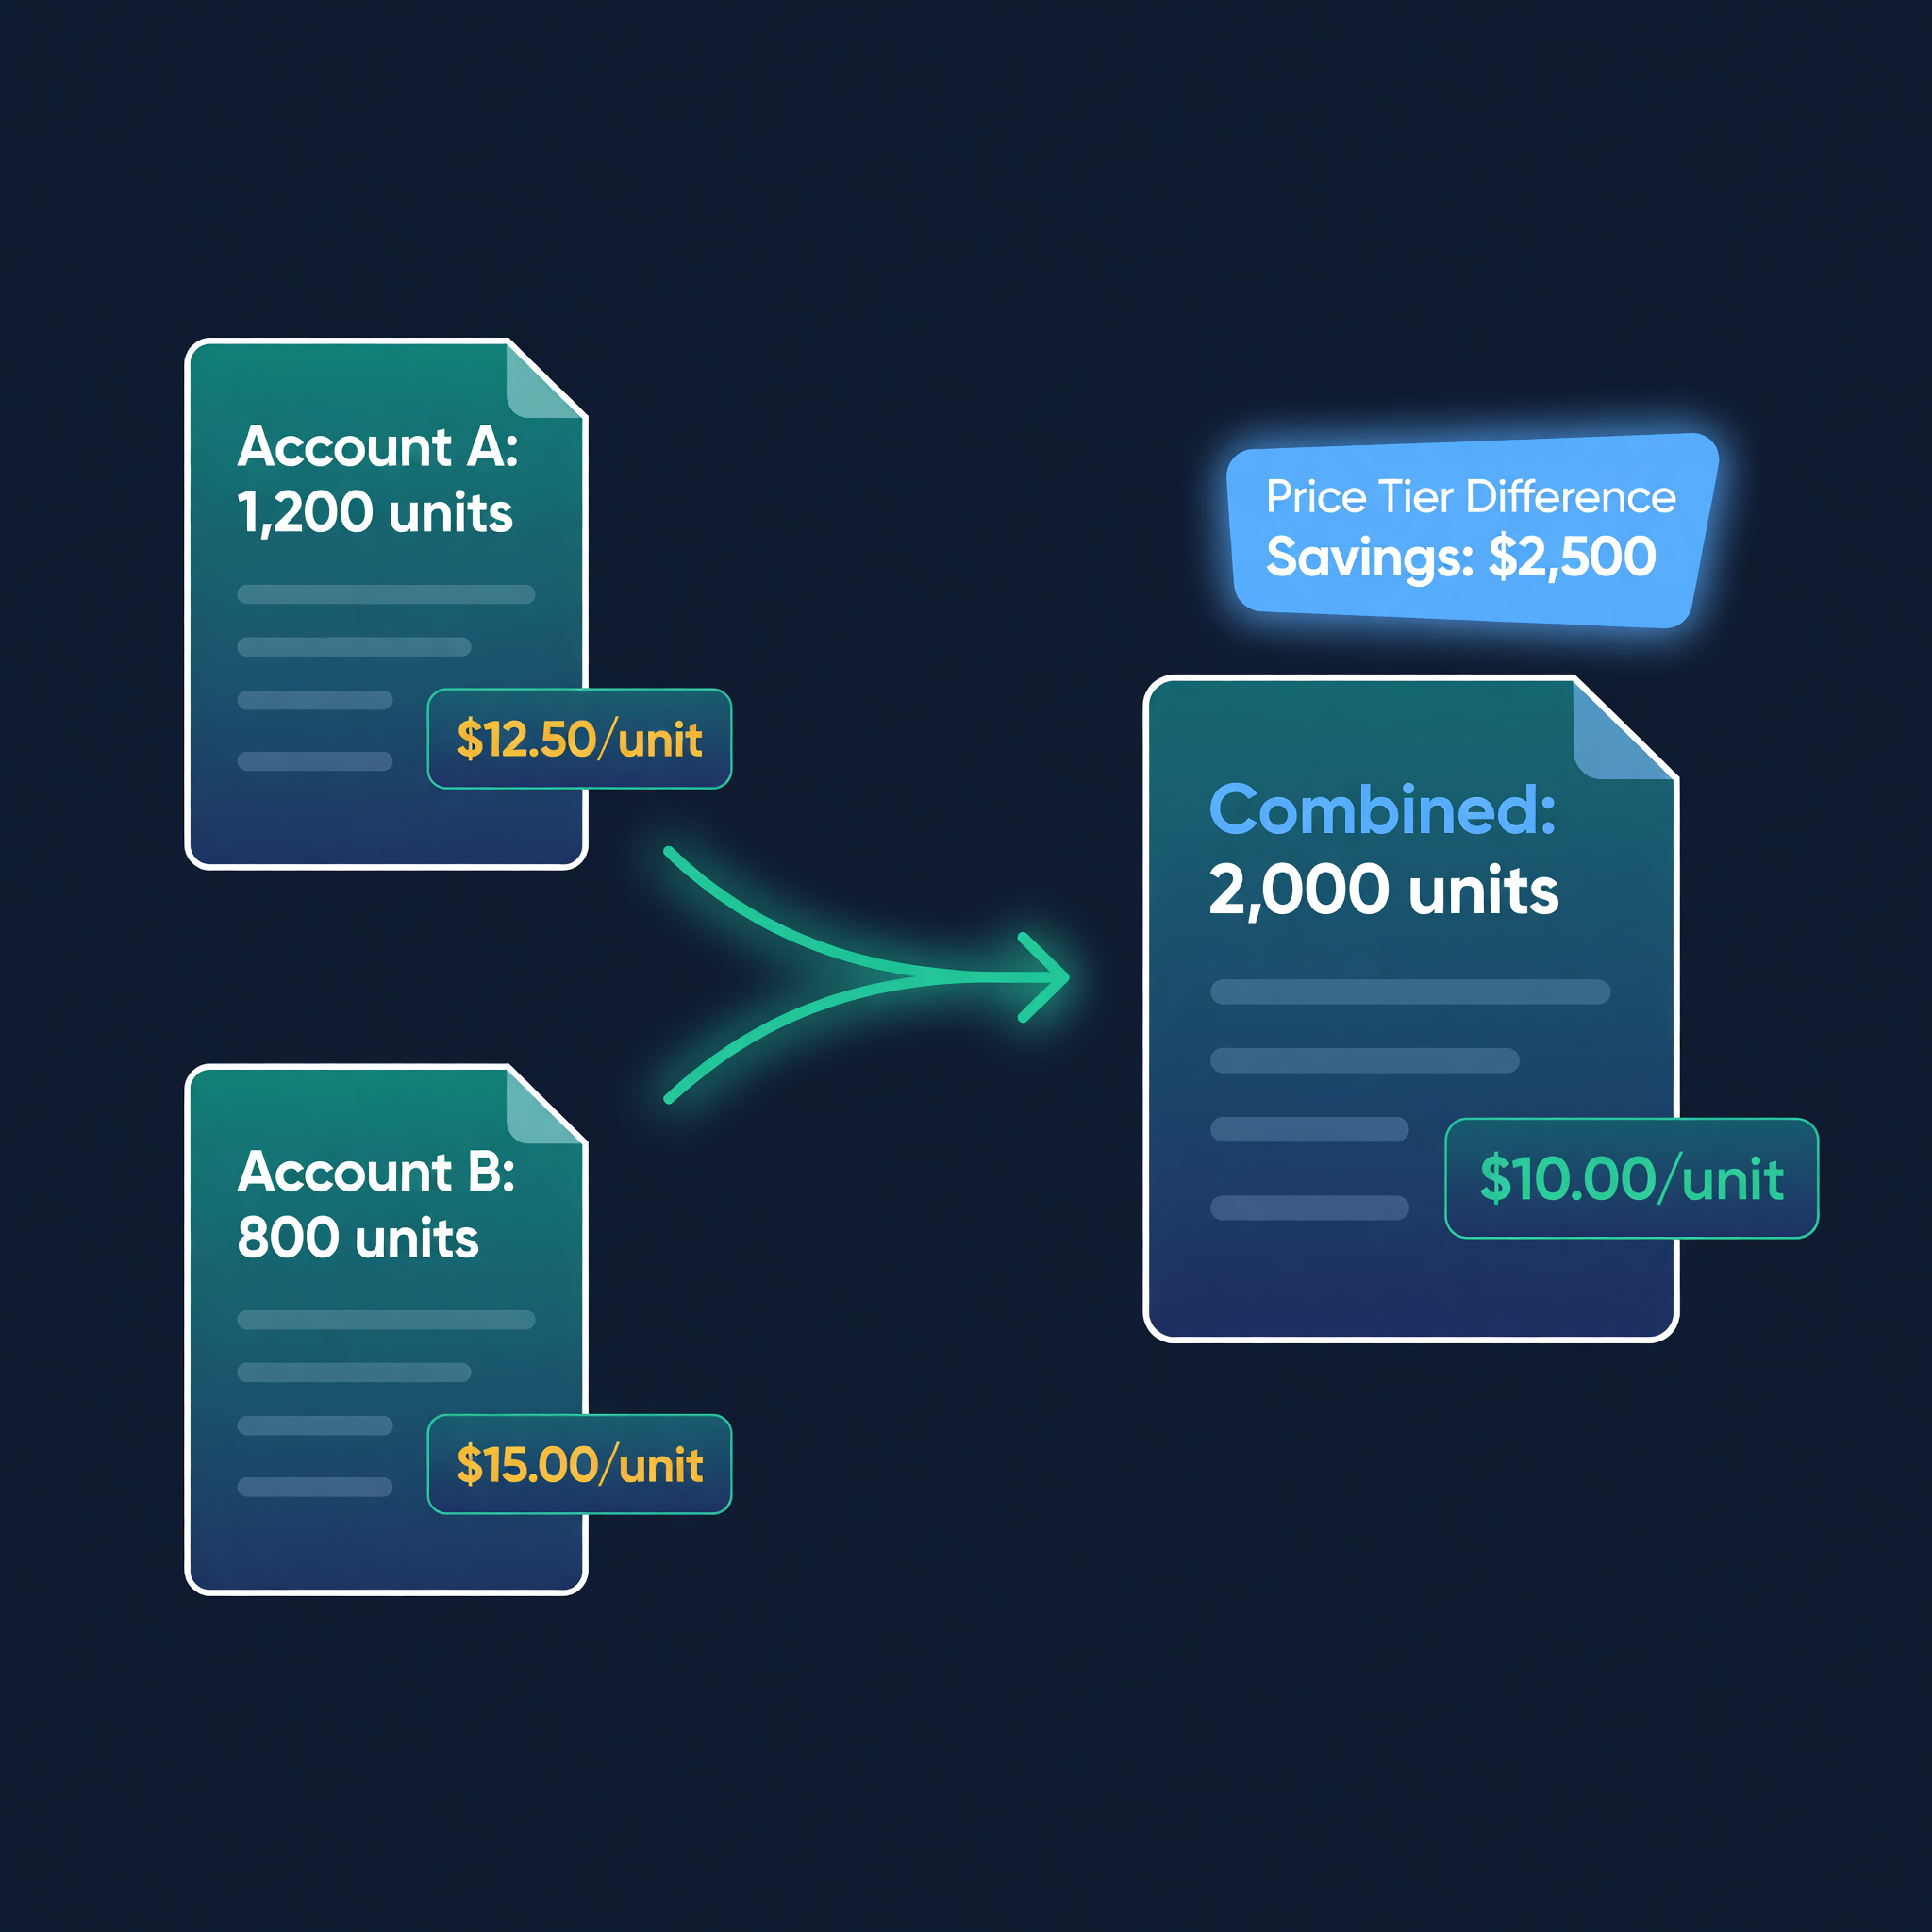
Say you order from the same supplier for both accounts. Account A needs 1,200 units. Account B needs 800. Ordered separately, you place two POs at the 1,000-unit price break for Account A and the sub-1,000 price for Account B.
Ordered together: 2,000 units. That usually hits the next price tier.
| Order Size | Unit Cost | Total Cost | Savings |
|---|---|---|---|
| 1,200 units (Account A alone) | $4.50 | $5,400 | - |
| 800 units (Account B alone) | $4.80 | $3,840 | - |
| 2,000 units (combined) | $4.15 | $8,300 | $940 |
That is $940 saved on a single SKU, single order. Across 50 shared-supplier SKUs and monthly ordering, the annual impact runs into five figures.
Your IPI Scores Fight Each Other
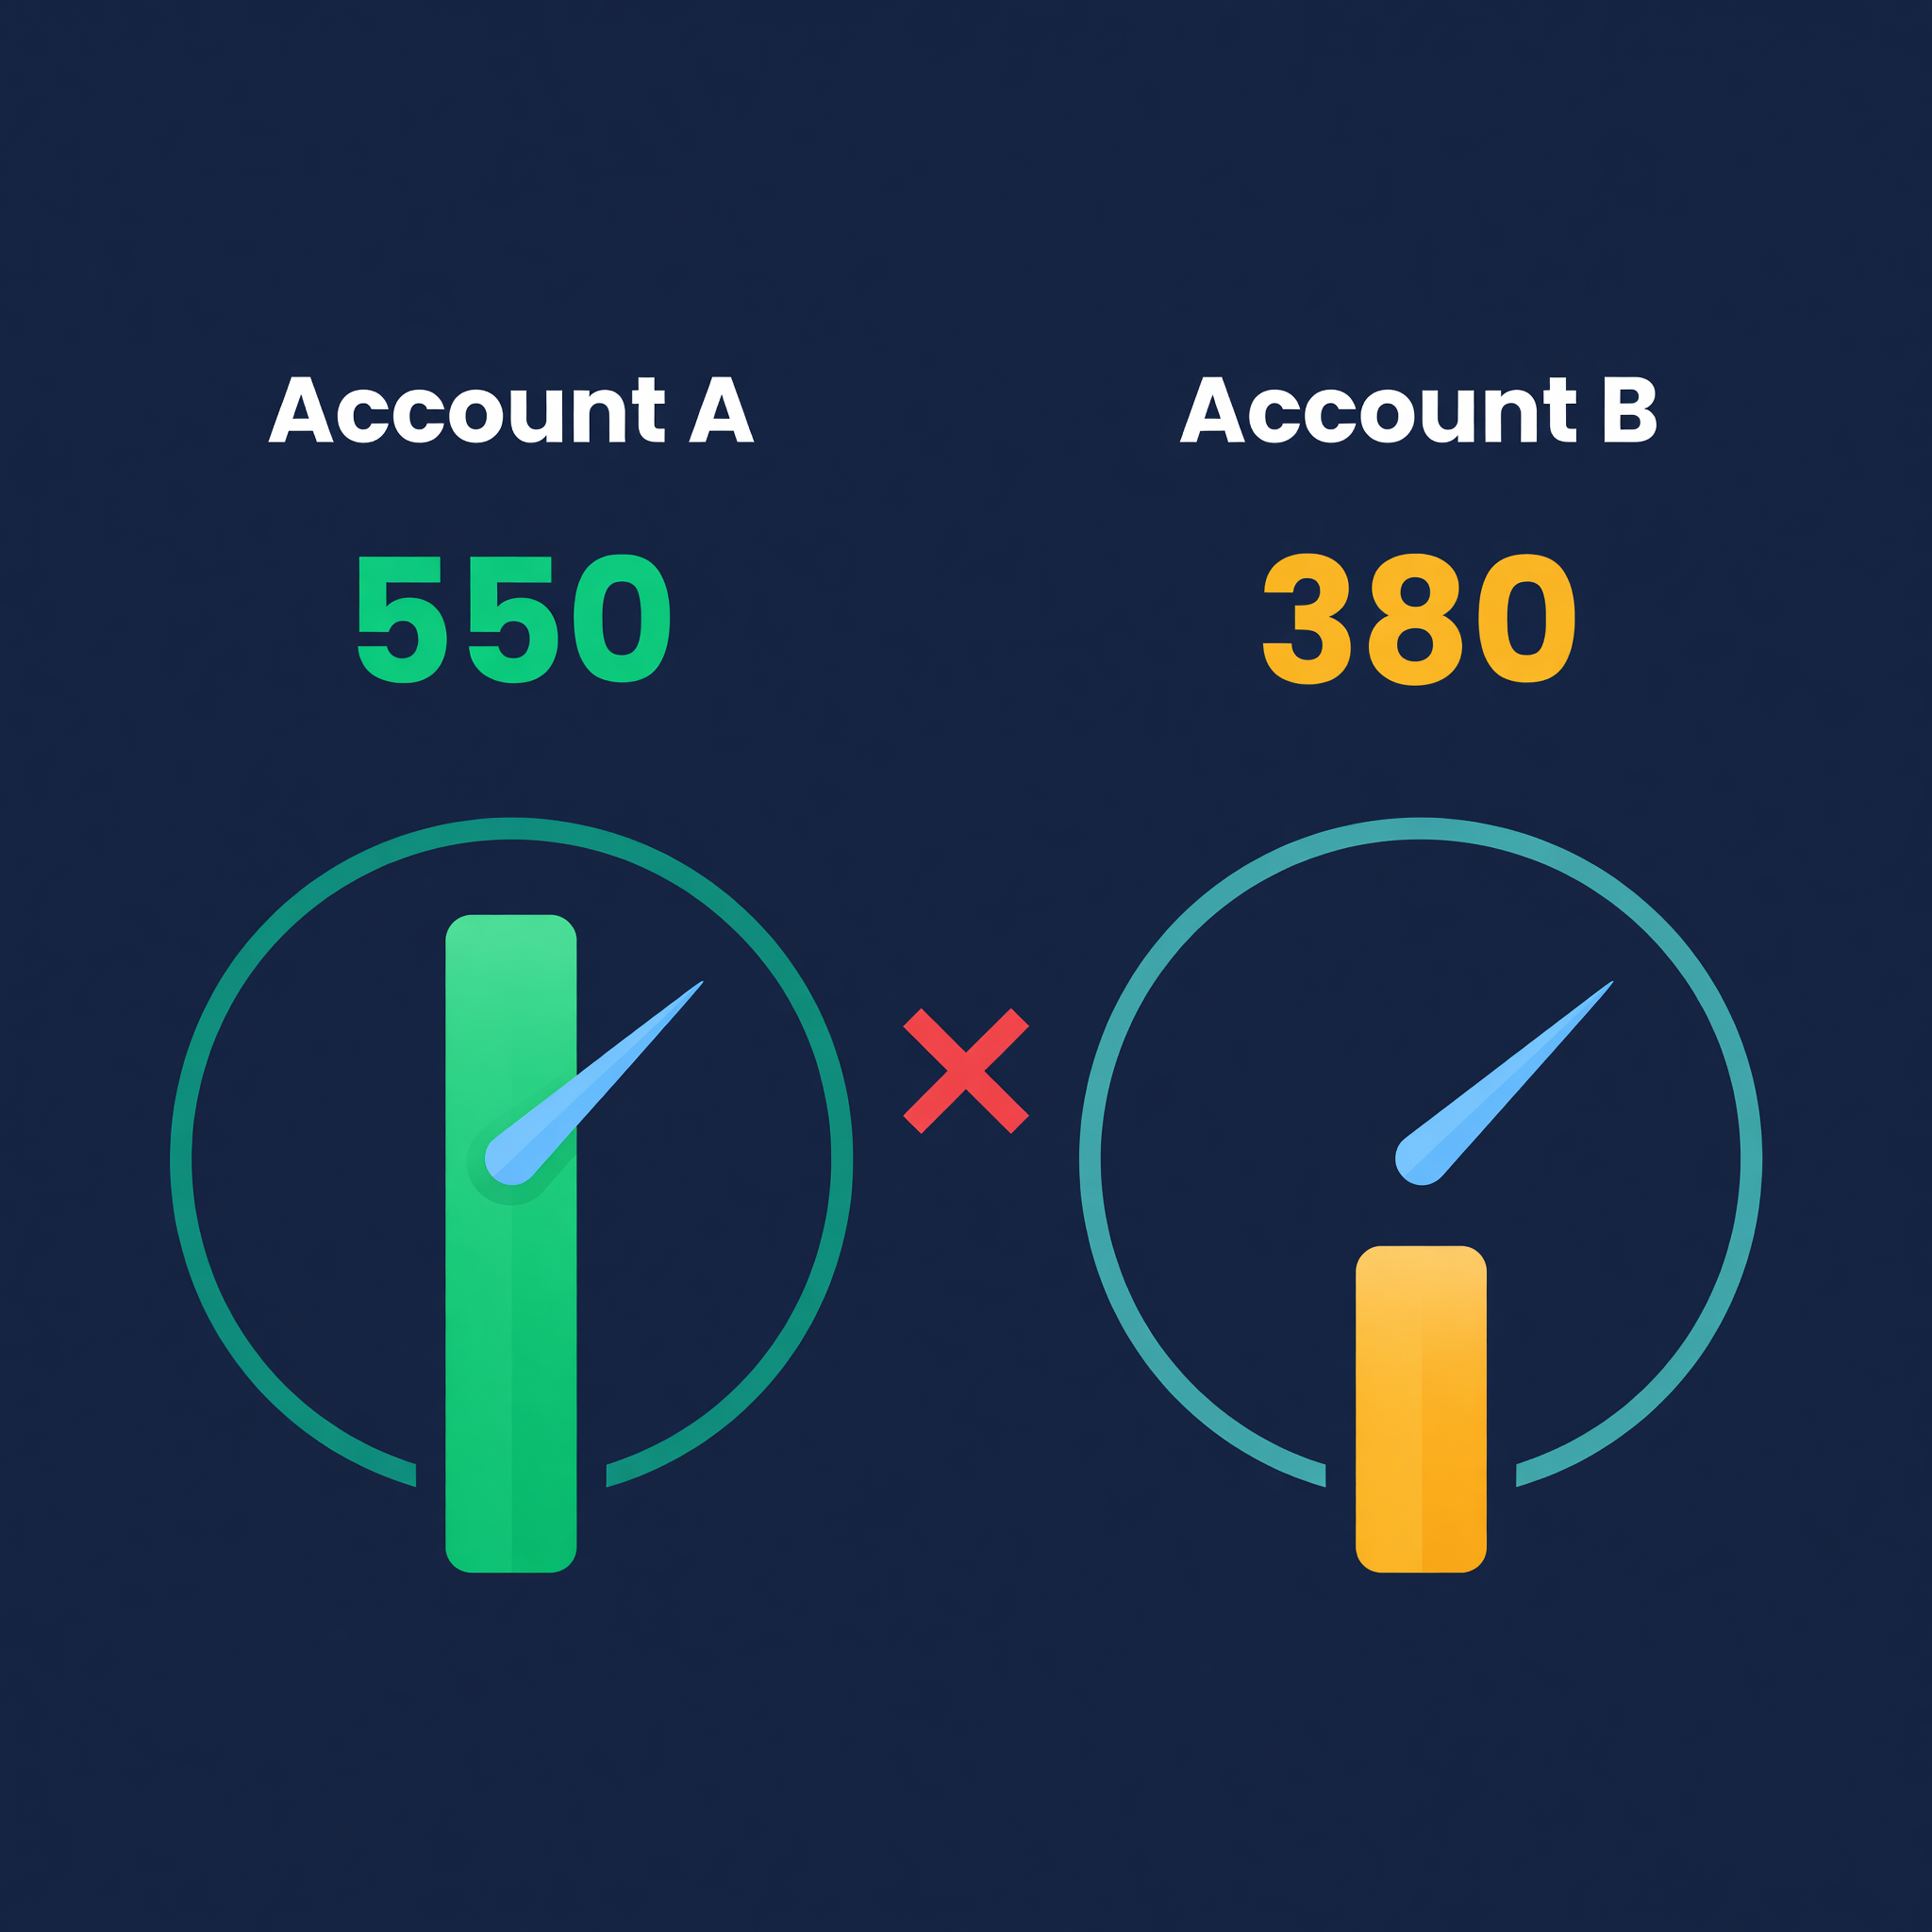
Each Amazon account has its own Inventory Performance Index. An account with IPI above 500 gets generous storage limits. Below 350 and Amazon starts restricting how much you can send.
The problem: you cannot move FBA inventory between accounts. If Account A has tight limits and Account B has room, you cannot shift stock over. You have to plan each account's FBA shipments independently based on that account's constraints.
What I see sellers get wrong: they mentally average their IPI scores. "One account is 550, the other is 380, so I am fine on average." No. The 380 account is hitting capacity restrictions right now, and averaging does not make that go away.
Demand Planning Is Incomplete
Your supplier does not care which Amazon account sells the product. They care how many units you need and when. But if you forecast per account in isolation, you miss the combined picture:
Account A forecast: 400 units/month
Account B forecast: 250 units/month
Combined: 650 units/month

Supplier lead time: 45 days
Combined reorder quantity: 650 x 1.5 months = 975 units + safety stock
If you want to run the combined math, plug the numbers into our reorder point calculator with the cross-account demand total.
Forecasting separately means you order 400 and 250 at different times, pay shipping twice, and miss the bulk pricing. Forecasting together means you order 975+ once.
Worked Example: Electronics + Home Goods
Let me walk through a real scenario.
Setup: Marcus runs two Amazon accounts. Account A sells electronics accessories (phone cases, chargers, screen protectors). Account B sells home goods (kitchen organizers, storage bins). Both accounts share three suppliers.
The Current State
Marcus orders from Supplier X for both accounts:
| Metric | Account A | Account B |
|---|---|---|
| SKUs from Supplier X | 35 | 22 |
| Monthly order value | $12,000 | $7,500 |
| Average PO frequency | Every 3 weeks | Every 4 weeks |
| Supplier X price tier | $10K-15K bracket | $5K-10K bracket |
Marcus places 12-13 POs per year for Account A and 12 for Account B. That is 24-25 POs annually to the same supplier.
After Consolidating
Combined monthly order value from Supplier X: $19,500. That bumps Marcus from two separate price brackets into a single higher tier.
| Metric | Separate | Consolidated | Difference |
|---|---|---|---|
| Annual spend with Supplier X | $234,000 | $234,000 | Same spend |
| Average unit discount | 0% (baseline) | 8-12% | $18,700-$28,000 saved |
| POs per year | 24-25 | 13-14 | 11 fewer POs |
| Shipping events | 24-25 | 13-14 | 11 fewer shipments |
| Freight cost (estimated) | $6,000 | $3,400 | $2,600 saved |
The supplier discount alone - $18,700 to $28,000 per year - pays for an inventory tool many times over. The freight savings are a bonus.
The FBA Restock Split
Consolidated ordering does not mean consolidated FBA shipments. Each account's FBA inventory is separate. After a combined PO arrives at Marcus's warehouse, he splits the received units:
PO received: 2,000 units of SKU CHRG-USB-C

Account A FBA demand: 120 units/week, IPI: 520 (good limits)
Account B FBA demand: 45 units/week, IPI: 410 (moderate limits)

Account A FBA shipment: 120 x 4 weeks = 480 units
Account B FBA shipment: 45 x 4 weeks = 180 units
Warehouse reserve: 2,000 - 480 - 180 = 1,340 units
The PO is combined. The FBA restocks are per-account. This is the pattern that works.
Forecasting by Account, Ordering by Supplier
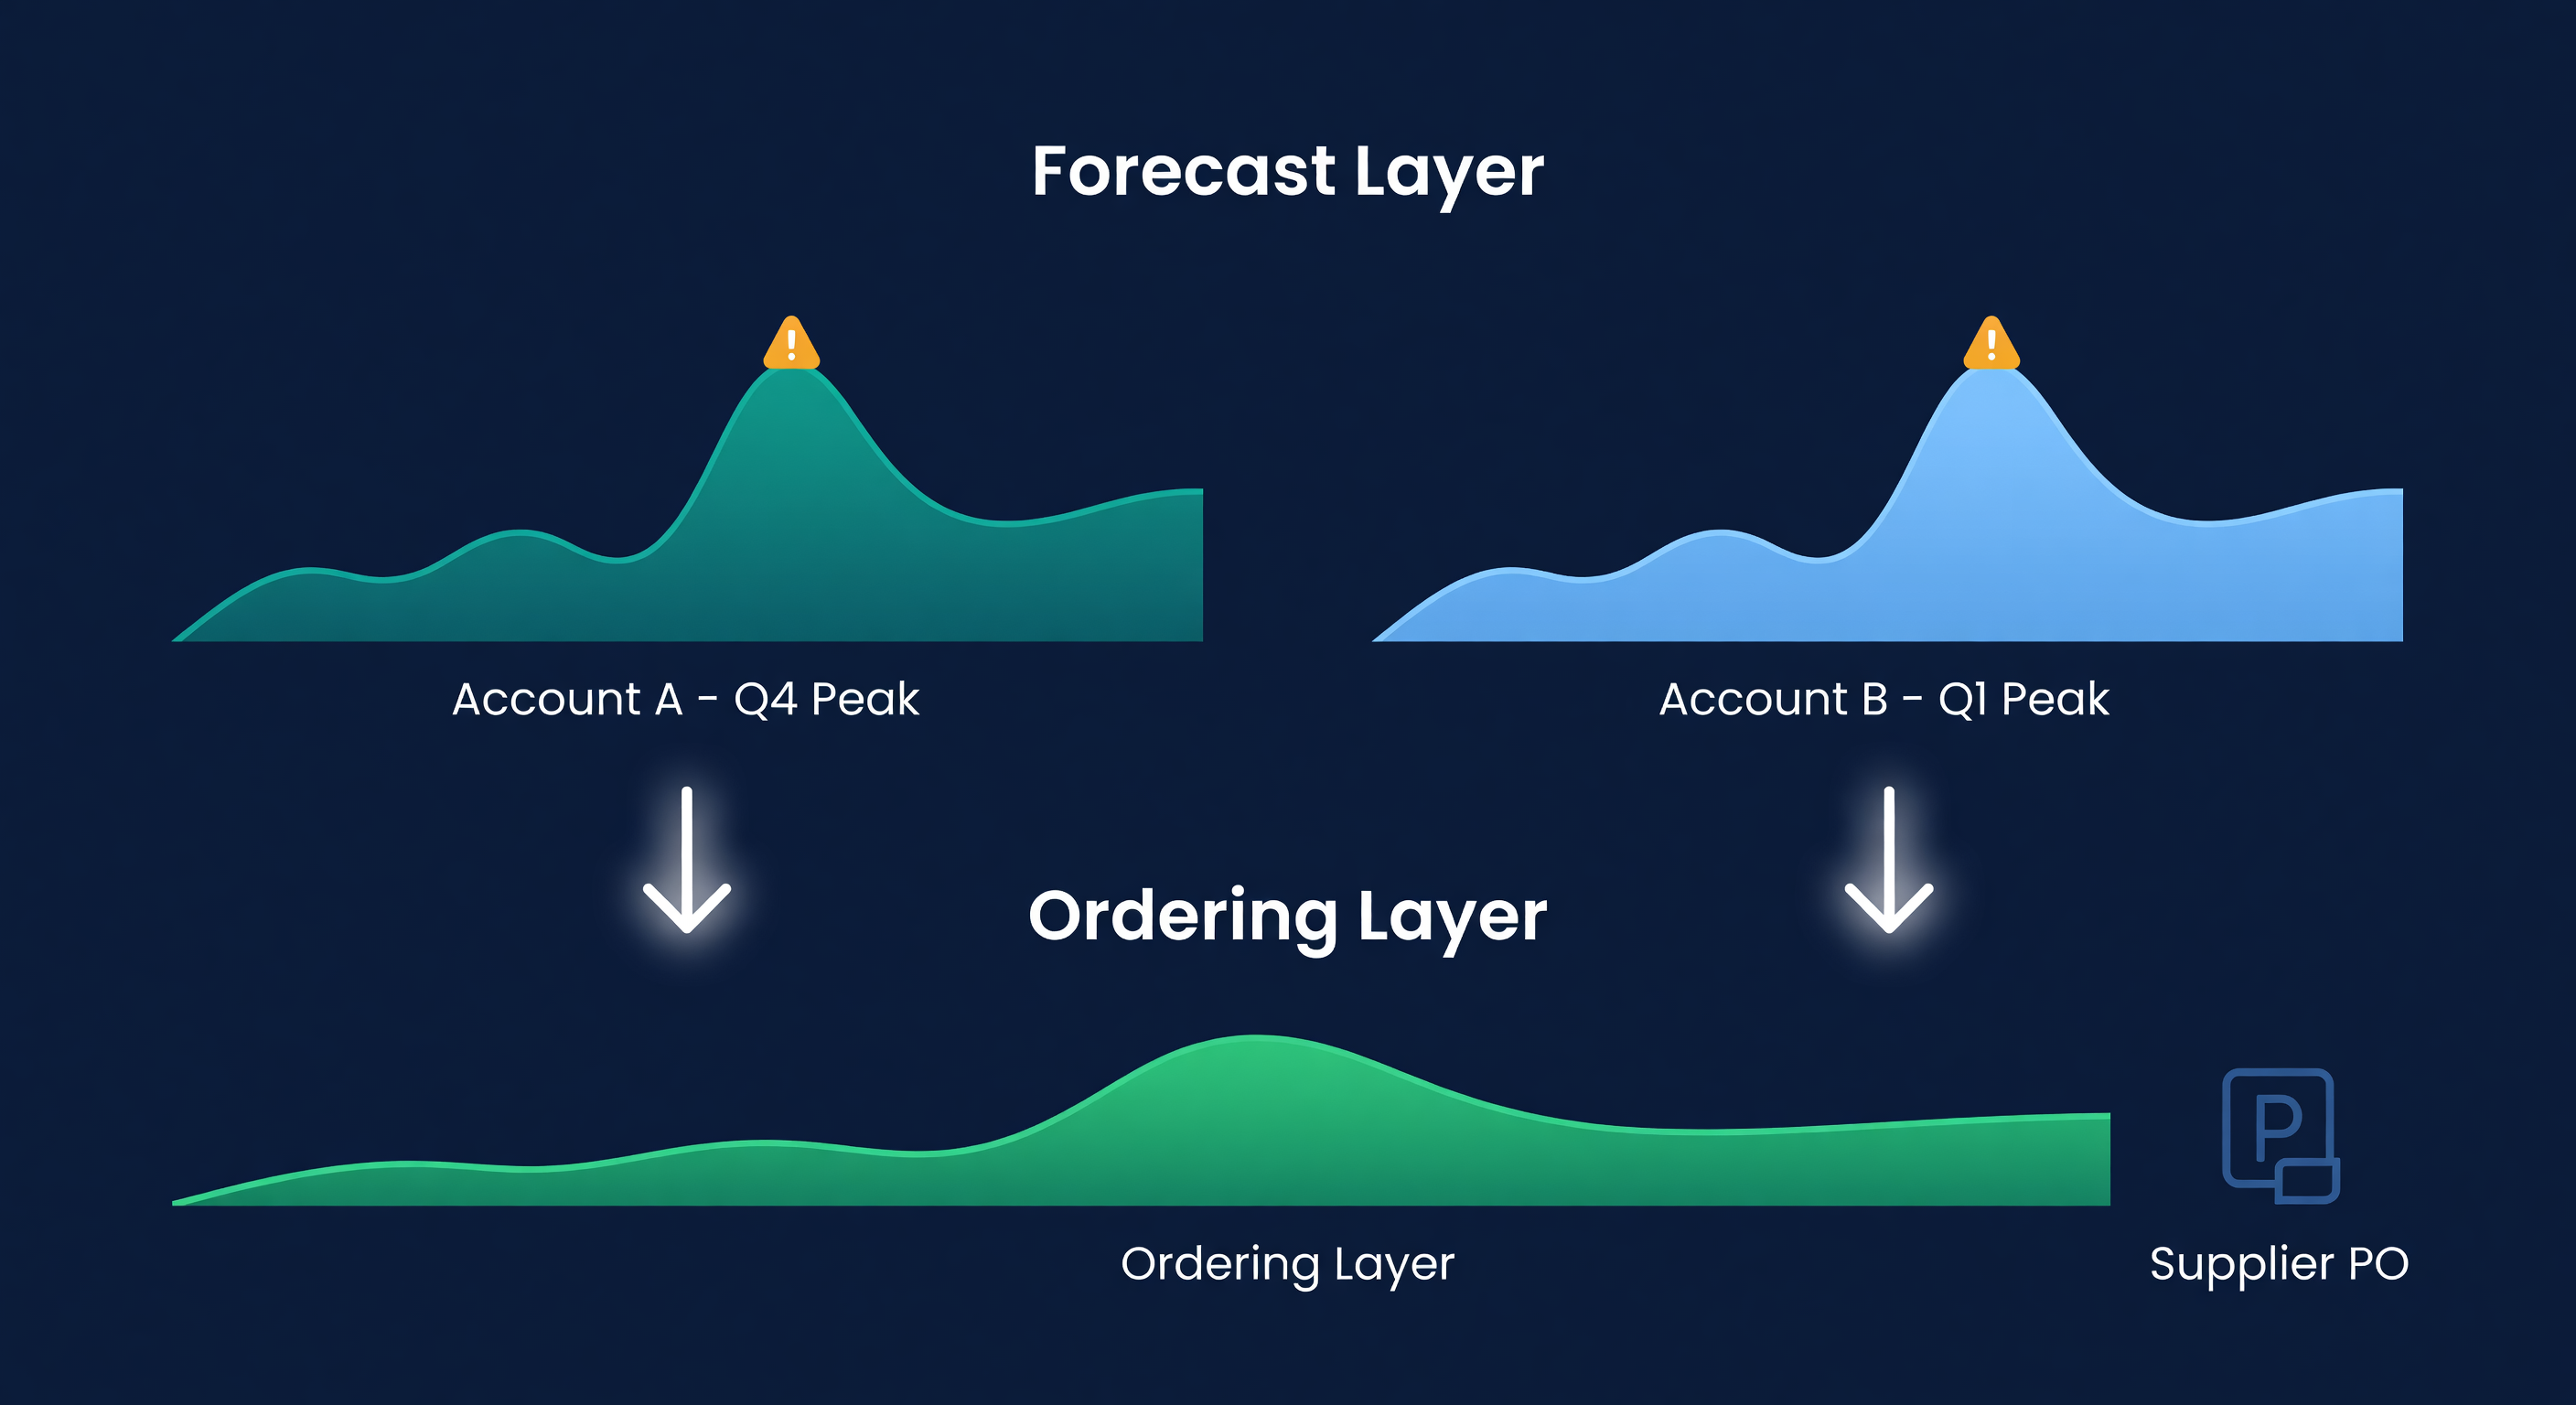
The critical distinction: forecast demand per account because each account has its own demand curve, seasonality, and customer base. But order from suppliers based on combined demand.
Account A electronics peak during Q4 (holiday gift buying). Account B home goods peak in January (New Year organizing) and spring (moving season). A combined forecast shows Marcus's overall demand from Supplier X across the year, smoothing out the peaks:
| Quarter | Account A Demand | Account B Demand | Combined |
|---|---|---|---|
| Q1 | 2,800 units | 4,200 units | 7,000 |
| Q2 | 3,100 units | 3,800 units | 6,900 |
| Q3 | 3,400 units | 2,900 units | 6,300 |
| Q4 | 5,200 units | 3,100 units | 8,300 |
Account A alone looks like a heavily seasonal business. Account B alone looks moderately seasonal. Combined, the variation from lowest to highest quarter is only 32% - much smoother. This means Marcus can negotiate more consistent monthly orders with Supplier X instead of placing large rush orders before each account's peak.
Getting the Data Right
The mechanics of multi-account inventory planning are not complicated. The hard part is getting clean, unified data.
Sales data must flow into one place. This means connecting both Seller Central accounts to a single reporting tool. Manually downloading and combining reports works until it does not - and it breaks at exactly the moment you need it most, during high-volume periods when you are too busy to maintain spreadsheets.
SKU mapping across accounts. If the same physical product has different ASINs or SKUs on different accounts, you need a mapping table. Without it, your system sees them as unrelated products and cannot sum demand.
IPI and storage limits per account. These must remain separate in your planning. Never plan FBA shipments based on averaged capacity across accounts. Each account has its own ceiling.
Supplier terms per combined volume. Once you start ordering in combined quantities, renegotiate your supplier agreements. Show them the annual volume and ask for the price break you have earned. Most suppliers respond to volume - they would rather give you 10% off than lose the consolidated order to a competitor.
How ReplenishRadar Handles Multi-Account Inventory
We built multi-account support into ReplenishRadar because we kept hearing the same story: two Seller Central tabs, one spreadsheet, Monday morning wasted. The system connects to every Amazon account on your plan - 2 on Standard, 5 on Growth, 10 on Scale, unlimited on Enterprise.
Each account syncs independently, pulling FBA inventory levels, sales velocity, and IPI data. But the forecasting engine sees the combined picture. When it generates a suggested PO for Supplier X, the quantity reflects total demand across all accounts. The restock suggestions for FBA shipments are per-account, respecting each account's storage limits and demand rate. You get the volume discount from consolidated ordering and the precision of per-account FBA planning without building the spreadsheet that connects them.
$940 saved on one SKU, one order, because you combined quantities across accounts. Multiply that across your catalog and it stops being a nice-to-have. Try ReplenishRadar free for 14 days ->
Related Reading:
Frequently Asked Questions
Get notified when it matters
Amazon and Shopify change the rules constantly. We'll email you when something affects your business.
See what your inventory is really doing
Doing $5M+ in revenue? Talk to our team
Related Posts
Consolidating Multiple Amazon Accounts Into One View
How to unify inventory, demand data, and purchasing across multiple Amazon seller accounts - and what you lose by keeping them separate.
Amazon's 2027 Bundle Rule and Your Kitted Inventory
Amazon's bundle policy changes January 11, 2027. Here's how to plan kitted FBA inventory, the reorder to skip, and the exemptions that keep a bundle live.
How to Handle Oversold Orders in E-commerce
Why overselling happens on multi-channel stores, what it costs you, and the prevention strategies that actually work, from buffer stock to real-time push sync.
