Dead Stock: How to Identify, Prevent, and Liquidate Unsold Inventory
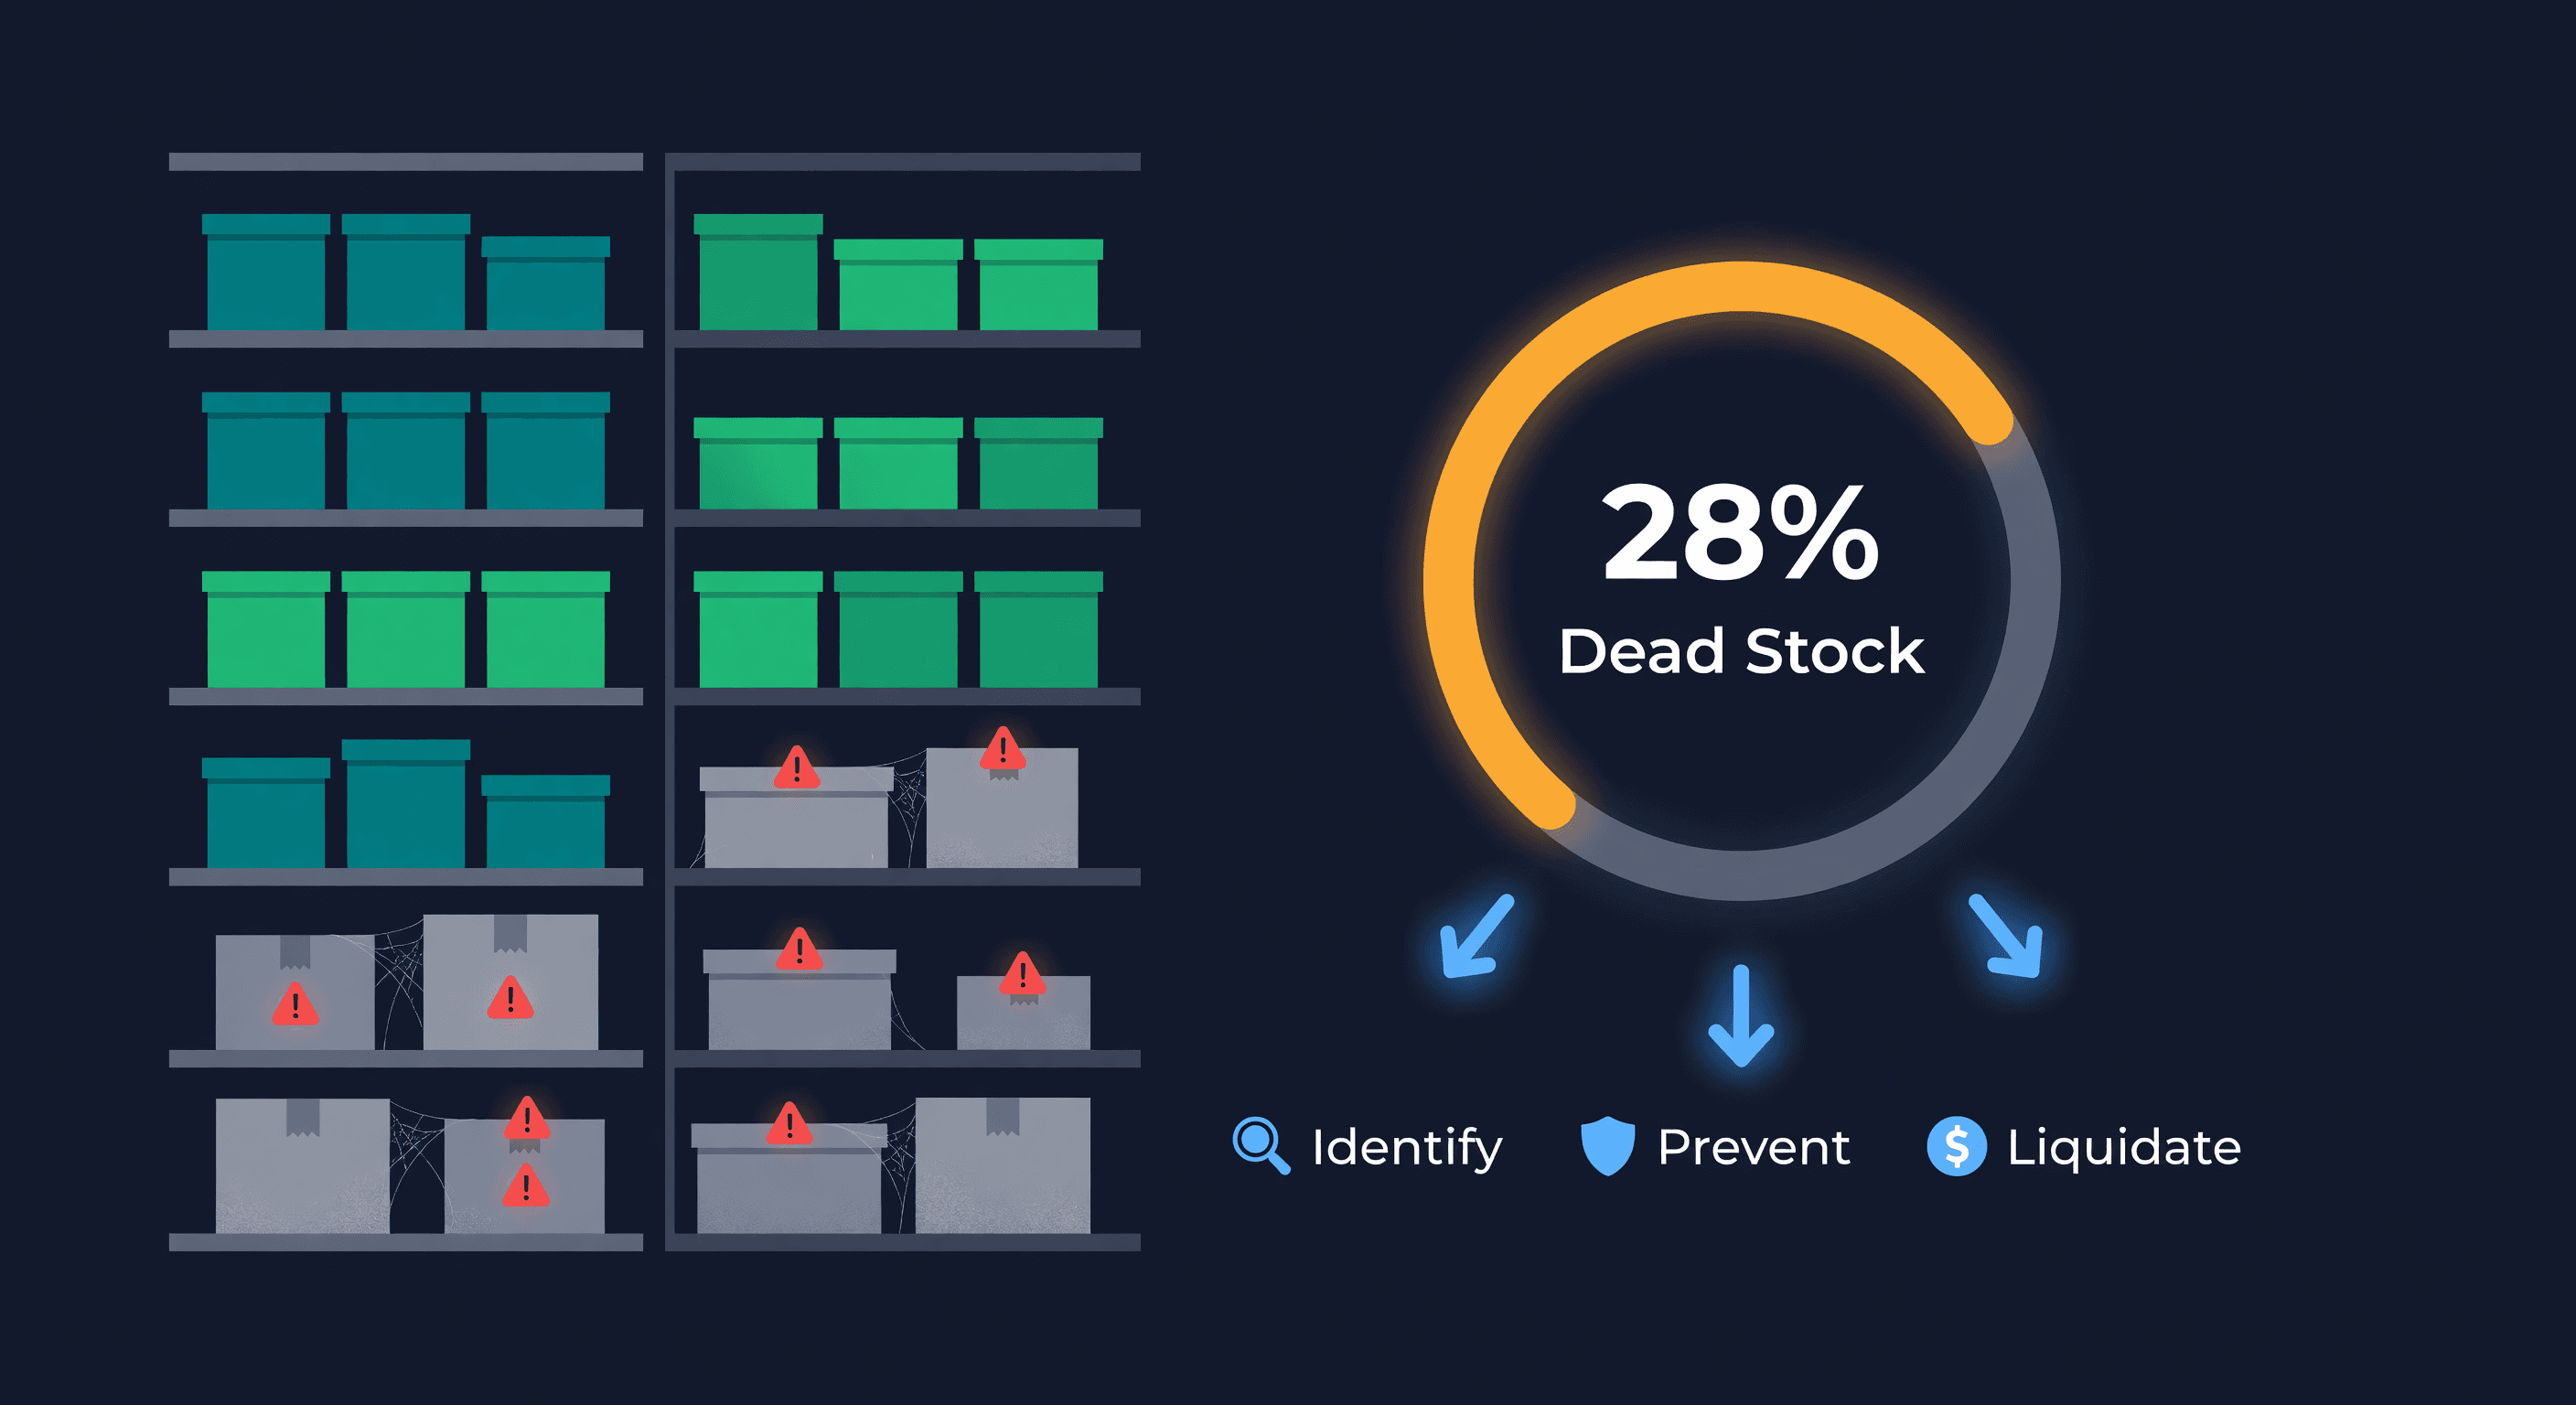
Key takeaway: Dead stock (zero sales in 90-180 days) ties up 20-30% of a typical e-commerce warehouse. Liquidate at 40-60% off or write off before long-term storage fees exceed the product's original cost.
The Inventory Nobody Wants to Talk About
I once spent $14,000 on a product line that sold exactly 37 units in six months. The rest sat on pallets, collecting dust and fees, while the cash I had sunk into it could have funded three reorders of my best-seller.
Industry data puts the damage at 20-30% of a typical e-commerce warehouse. That means if you carry $200,000 in inventory, somewhere between $40,000 and $60,000 is tied up in products generating zero revenue. Most sellers know this. Few do anything about it until the storage bill forces their hand.
What Counts as Dead Stock
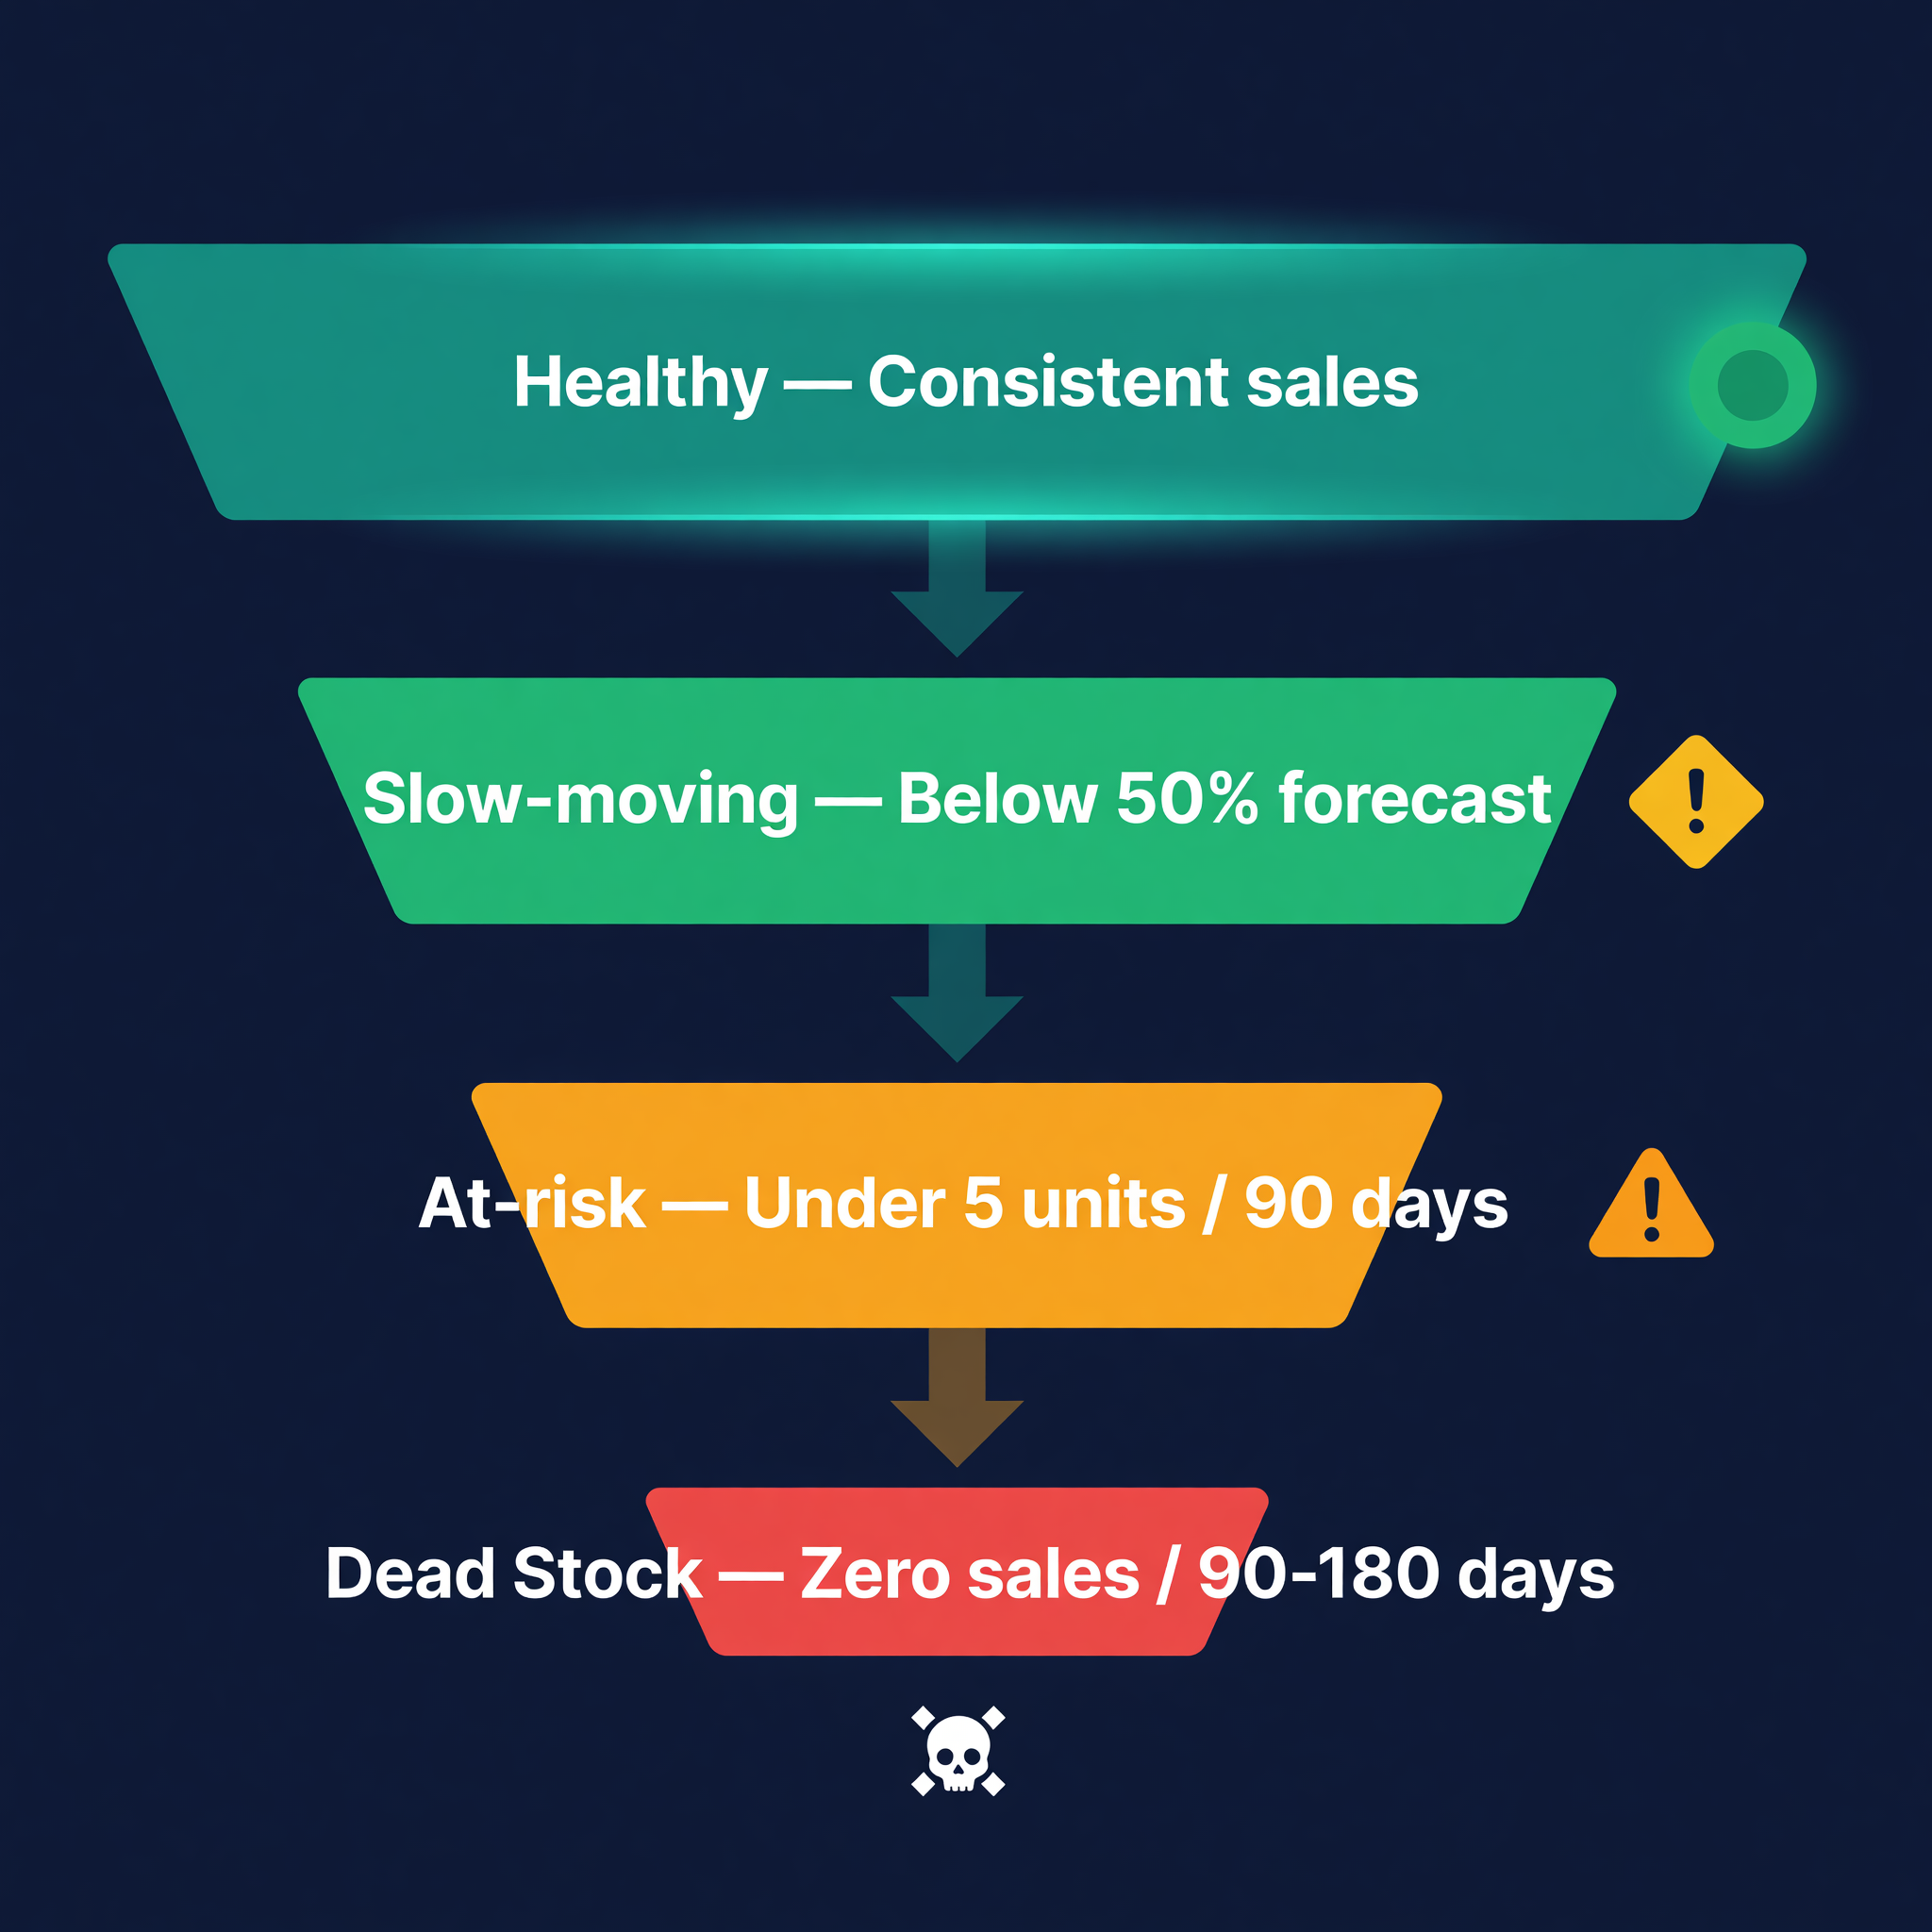
Dead stock is inventory with zero or near-zero sales velocity over a meaningful time period:
| Classification | Sales Velocity | Action |
|---|---|---|
| Healthy | Consistent sales matching forecast | Continue replenishing |
| Slow-moving | Below 50% of forecast | Investigate, adjust orders |
| At-risk | Fewer than 5 units in 90 days | Stop reordering, consider markdowns |
| Dead stock | Zero units in 90-180 days | Liquidate or write off |
The line between slow-moving and dead matters. Slow-movers still have a pulse. Dead stock does not.
How to Identify Dead Stock
Velocity Tracking
Flag any SKU with zero units sold in the last 90 days, then calculate daily velocity for everything else:
| Daily Velocity | Status |
|---|---|
| Above 1.0 | Healthy |
| 0.1 - 1.0 | Monitor closely |
| 0.01 - 0.1 | Slow-moving, likely overstocked |
| 0.0 | Dead stock |
ABC Analysis with a D Category
Extend standard ABC analysis with a fourth tier:
| Category | Revenue Contribution | Typical % of SKUs |
|---|---|---|
| A | Top 80% | 15-20% |
| B | Next 15% | 20-30% |
| C | Bottom 5% | 40-50% |
| D | Zero revenue (90+ days) | 5-15% |
D-category items are not low-priority items to monitor less. They are items to actively remove.
Inventory Aging Reports
An aging report shows how long each unit has sat without selling:
| Age Bracket | Example Value | Action |
|---|---|---|
| 0-90 days | $63,000 | Normal |
| 91-180 days | $16,500 | Markdown candidates |
| 181-365 days | $6,750 | Liquidate |
| 365+ days | $3,000 | Write off or donate |
For FBA sellers, aging reports matter more than most people realize because long-term storage fees spike at 181 and 365 days.
The Real Cost of Dead Stock
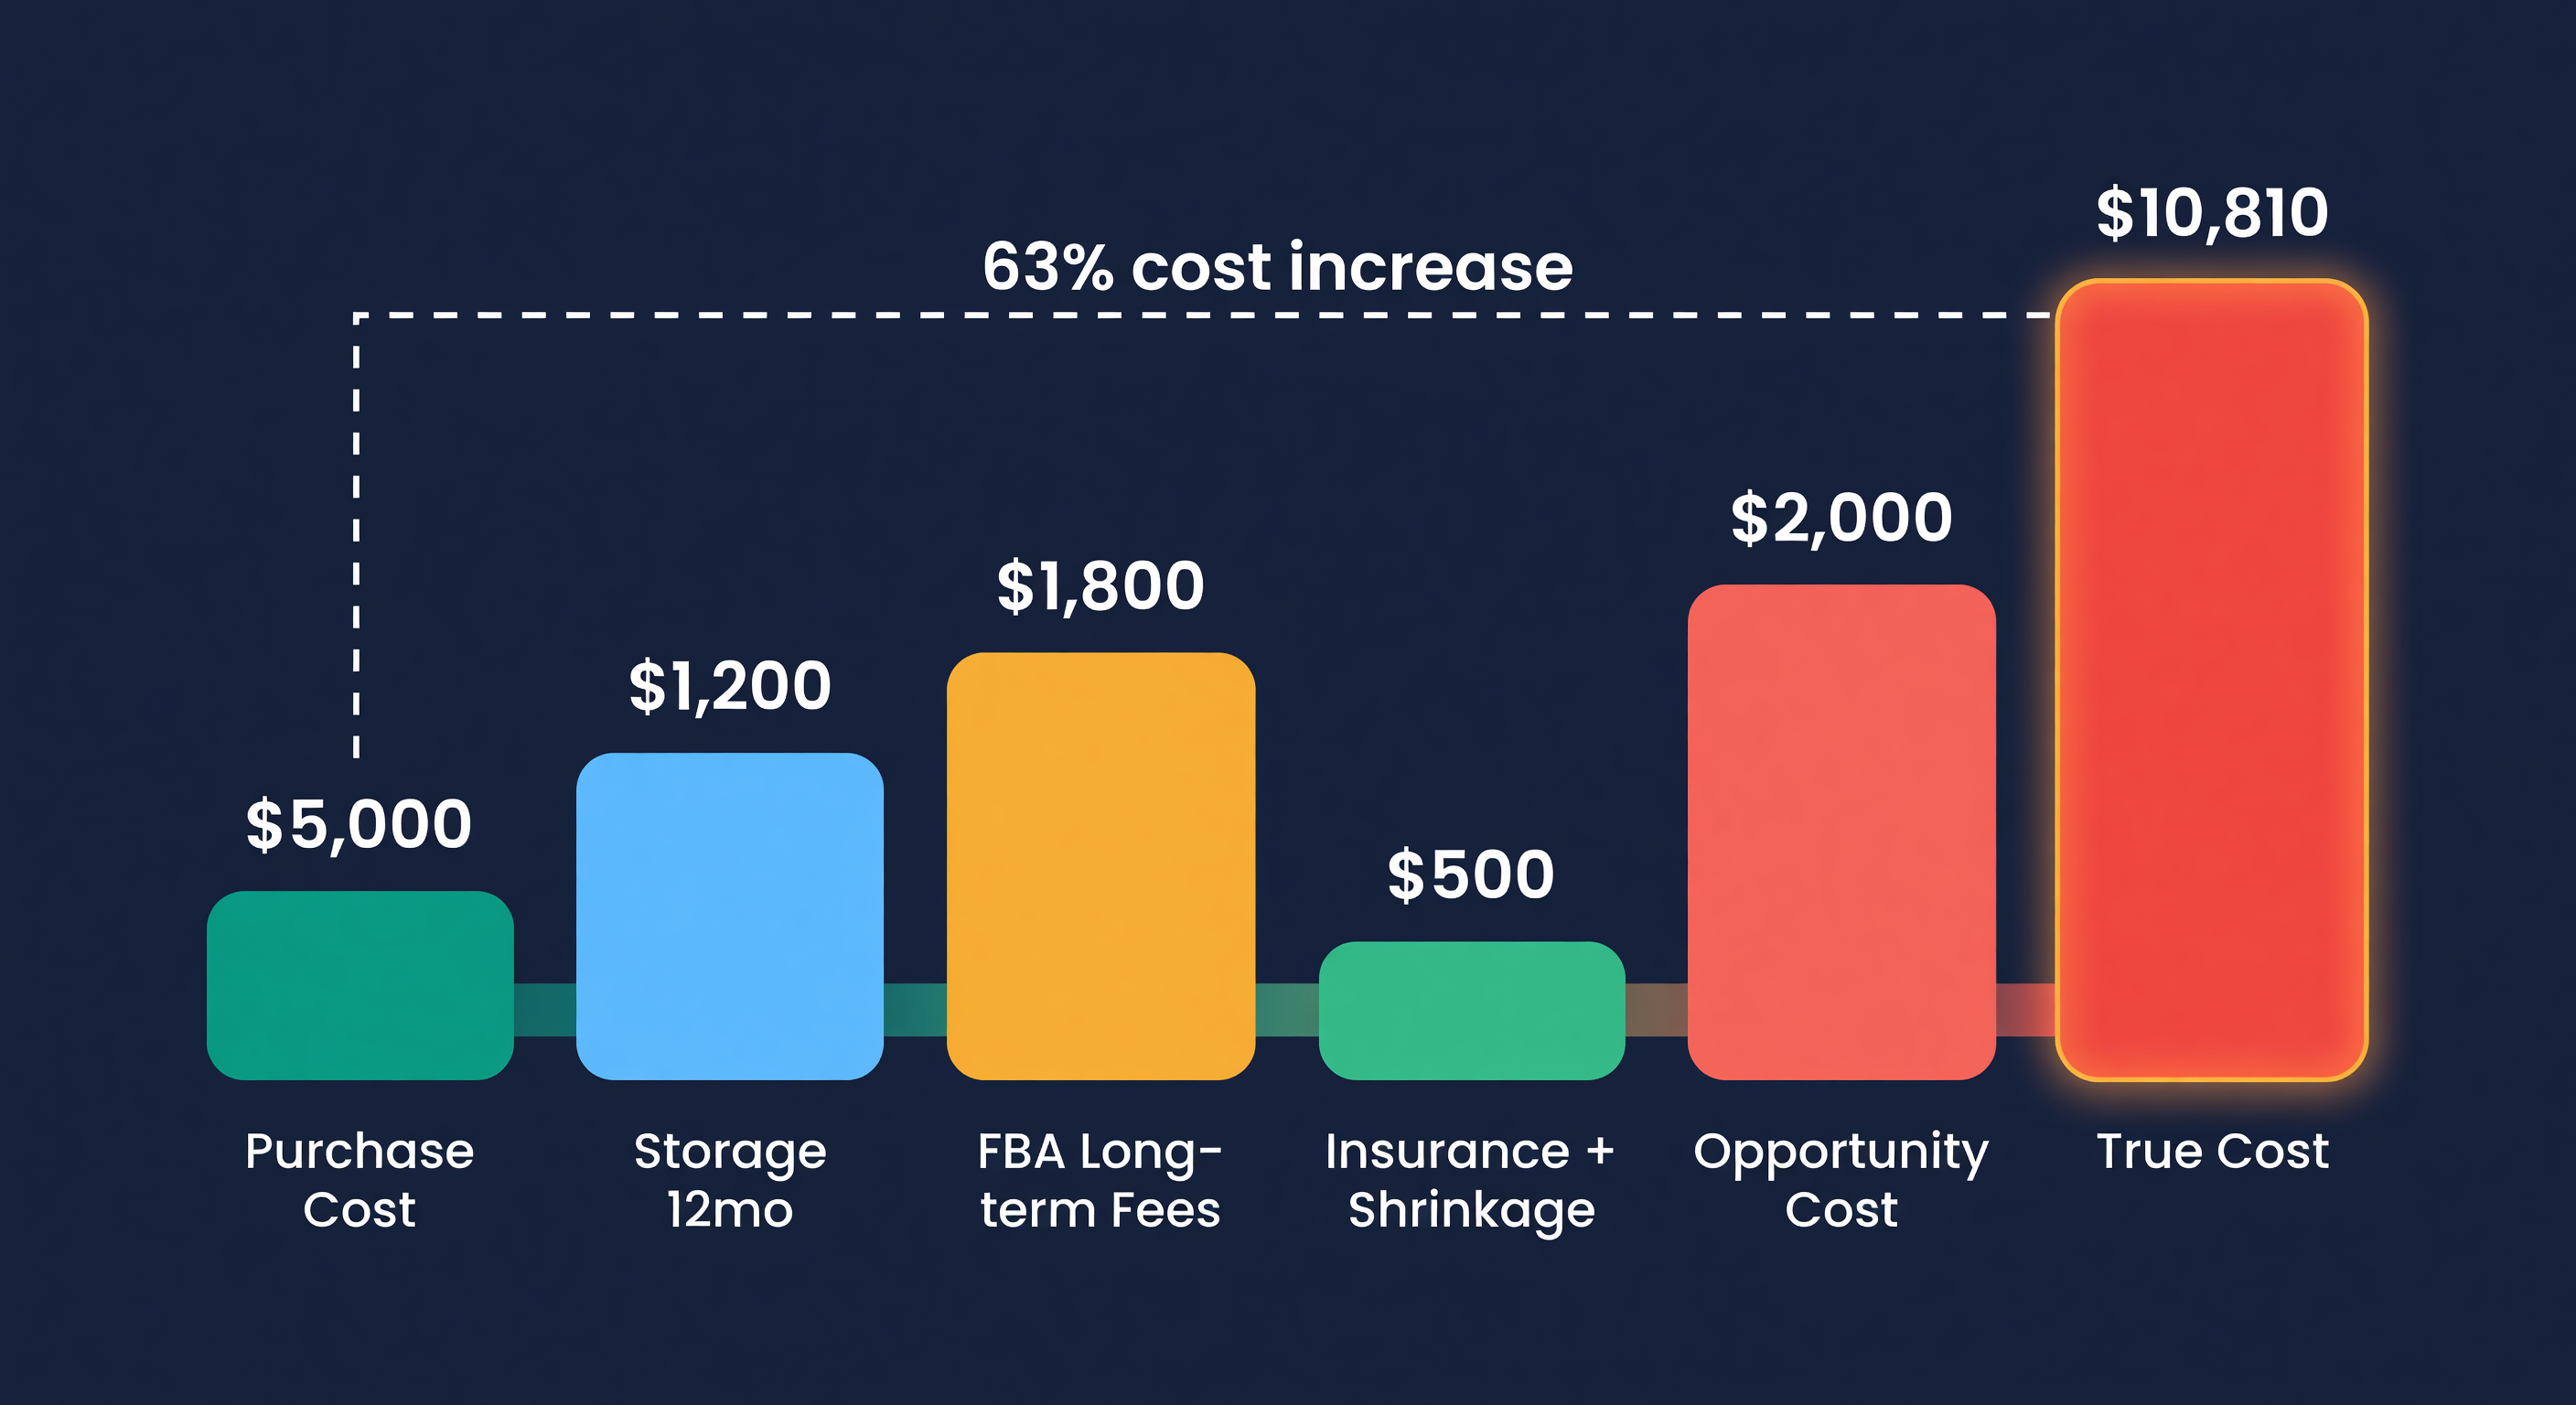
Here is a product that cost $12/unit and has been sitting for 12 months:
| Cost Component | Per Unit | For 500 Units |
|---|---|---|
| Original purchase cost | $12.00 | $6,000 |
| Warehouse storage (12 months) | $2.40 | $1,200 |
| FBA long-term storage fees | $3.60 | $1,800 |
| Insurance + shrinkage | $0.18 | $90 |
| Opportunity cost (12% annual) | $1.44 | $720 |
| Total | $19.62 | $9,810 |
That $6,000 in dead inventory actually costs $9,810 after carrying costs. If reinvested in a bestseller with 3x annual turnover, that capital could have generated $18,000+ in revenue.
Prevention Strategies
Better Demand Forecasting
Most dead stock comes from buying more than the market wants. Improving your demand forecast is the single most effective fix. Use 90-day rolling averages, weight recent data more heavily, adjust for seasonality, and flag SKUs where forecast accuracy is consistently poor.
Smaller, More Frequent Orders
| Strategy | Order Size | Dead Stock Risk |
|---|---|---|
| Quarterly bulk | 3 months supply | Medium -- stuck if demand drops |
| Monthly orders | 1 month supply | Low -- adjust quickly |
| Weekly replenishment | 1 week supply | Very low -- but higher shipping cost |
For products with uncertain demand, lean toward smaller orders even if per-unit shipping is higher. The insurance is worth the premium.
MOQ Negotiation
Supplier MOQs force over-ordering. A 1,000-unit MOQ when you need 300 creates 700 units of potential dead stock. Ask for trial orders at reduced MOQ for new products, combine multiple SKUs to meet minimums, or offer slightly higher per-unit pricing in exchange for flexibility.
Seasonal Planning
Build a wind-down calendar for seasonal products. Set a "last order" date per season, plan markdowns 4-6 weeks before the season ends, and never reorder seasonal products "just in case." I have done that. It ended with pallets in January.
New Product Discipline
New products are the most common source of dead stock. My rules: first order covers 30-60 days of estimated demand. 90-day checkpoint -- if below 50% of forecast, stop reordering. Below 25%, start markdowns immediately. Zero sales in 60 days after launch means liquidate.
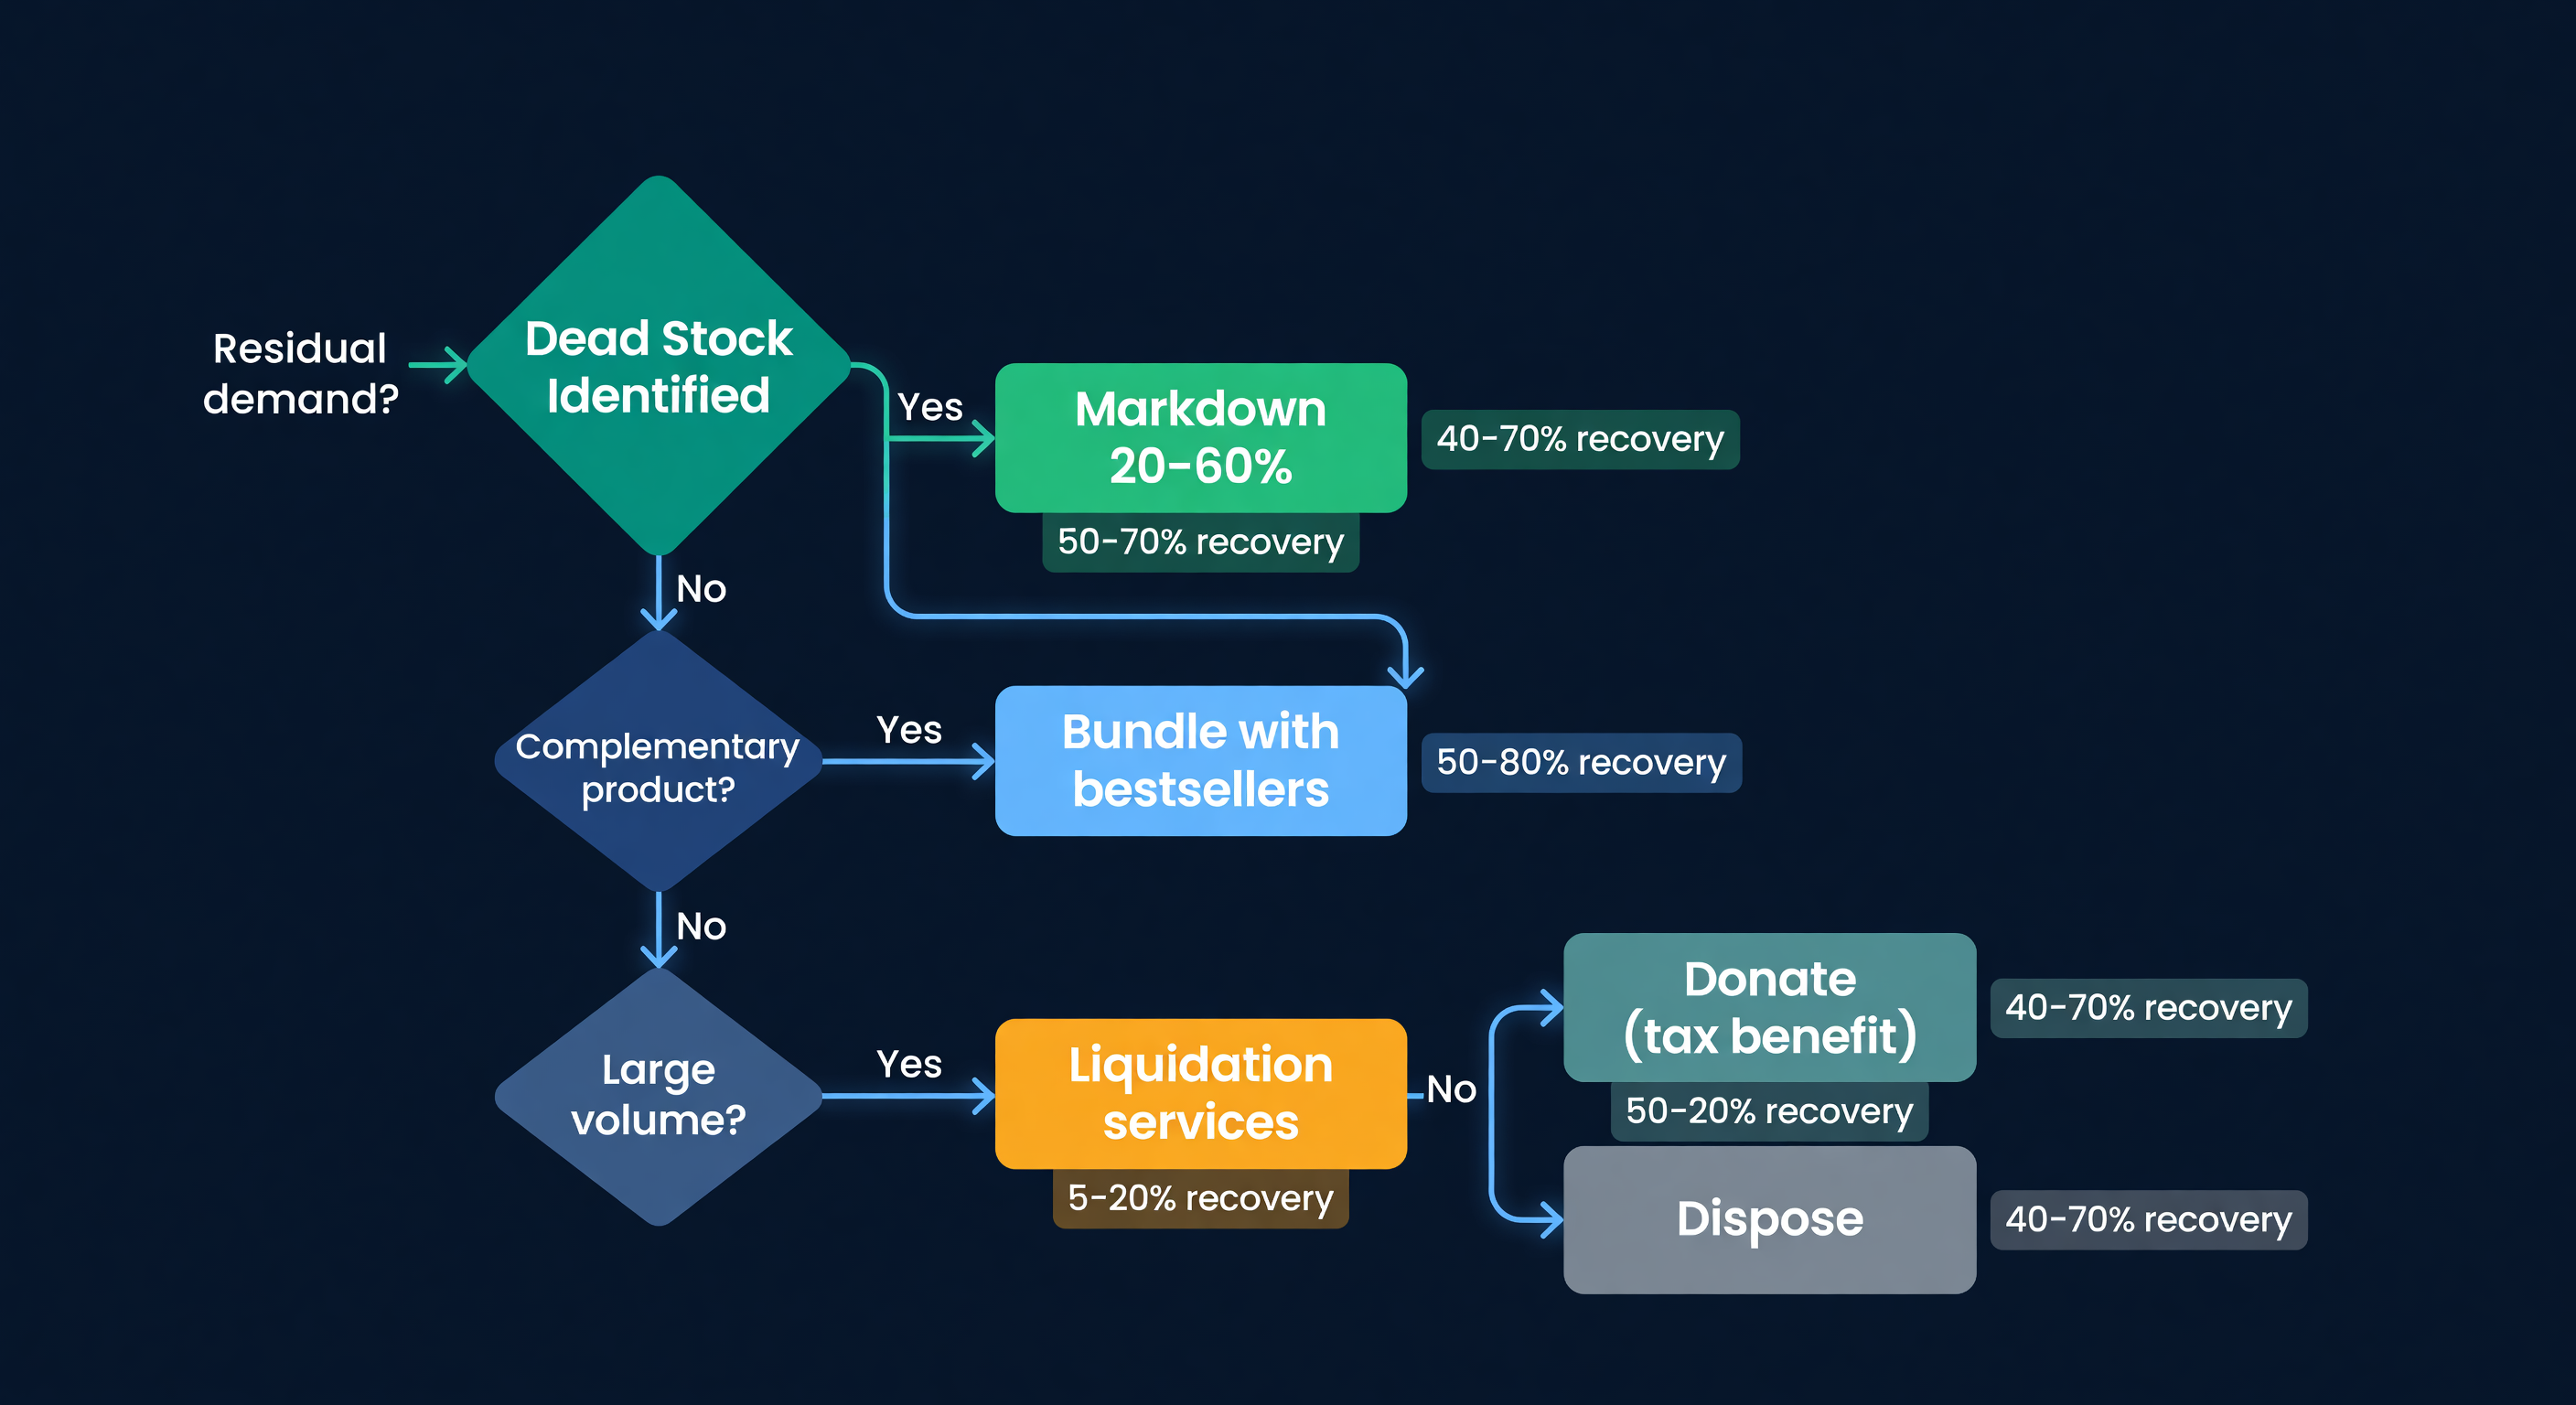
Liquidation Options
| Option | Recovery Rate | Best For |
|---|---|---|
| Markdown (20-60% off) | 40-70% | Products with some residual demand |
| Bundle with bestsellers | 50-80% | Complementary products |
| Alternative channels (eBay, B2B) | 30-60% | Branded products, bulk buyers |
| Liquidation services | 5-20% | Large volumes, no other options |
| Donate (tax deduction) | 0% + tax benefit | Very low liquidation value |
| Dispose | 0% | When storage costs exceed all recovery |
Decision rule: Act within 90-180 days. Every month of inaction increases carrying cost and reduces recovery.
Catching Dead Stock at 90 Days
The manual version of this -- pulling aging reports, cross-referencing velocity, checking FBA age thresholds -- takes hours every month. And by the time you sit down to do it, you have already missed the window on a few SKUs.
We built ReplenishRadar to run this analysis on every sync. The system flags declining velocity before a product flatlines, surfaces D-category items in the action center alongside your stockout risks, and highlights FBA inventory creeping toward the 180-day surcharge cliff. If forecast accuracy on a SKU is consistently poor, that shows up too -- because a bad forecast today is dead stock six months from now.
The goal is not zero dead stock. That is unrealistic. The goal is to catch it in 90 days, not 365.
If you are managing more than 50 SKUs and still eyeballing your aging reports, you are leaving money on the shelf. Try ReplenishRadar free for 14 days ->
Related Reading:
Frequently Asked Questions
Ready to prevent stockouts?
Related Posts
Consolidating Multiple Amazon Accounts Into One View
How to unify inventory, demand data, and purchasing across multiple Amazon seller accounts -- and what you lose by keeping them separate.
Managing Inventory Across Multiple Shopify Stores
The operational reality of running 2+ Shopify stores from one warehouse. Workflows, team coordination, and what breaks at scale.
OpenClaw Can Manage Your Inventory. Should It?
OpenClaw has Shopify skills, inventory alerts, and demand forecasting plugins. Here's where an AI agent works and where purpose-built inventory software wins.