
The Bullwhip Effect in E-commerce
Key takeaway: A 10% demand increase at retail becomes a 40%+ order spike upstream. Small demand changes get amplified at each supply chain level. Order frequently in small batches and share sell-through data with suppliers to dampen the effect.
Everyone Knows What the Bullwhip Effect Is. Most Sellers Do Not Realize They Are Doing It.
The concept is simple. Customer demand changes by a little. Your ordering changes by a lot. Your supplier's production changes by even more. By the time the signal reaches the raw material supplier, a 10% blip in consumer demand has turned into an 80% swing in orders. The name comes from the physics - a small flick of the wrist at the handle creates a massive crack at the tip.
I first experienced this after Prime Day 2023. My best-selling product did 4x normal volume over 48 hours. Great. Then I panicked. "What if this is a new baseline? What if demand stays elevated?" I placed an order for 3x my normal restock quantity. My supplier, seeing the spike in my order, bumped their own raw material orders. Two months later, I had 14 weeks of supply sitting in my warehouse and my supplier had excess components they could not use.
Demand went right back to normal within a week of Prime Day ending. I was sitting on inventory I did not need for three months. My supplier was stuck with materials for two.
That is the bullwhip effect. And if you buy products and resell them, you are participating in it whether you know it or not.
The Math Behind the Amplification
Here is how a modest demand signal turns into an outsized order. I will use real numbers from a scenario I have seen play out multiple times.
Starting point: You sell 100 units per week. You keep 4 weeks of supply on hand (400 units). You reorder monthly.
Week 1: Demand jumps to 120 units (20% increase). Your safety stock target stays at 4 weeks, so now you need 480 units on hand (120 x 4). You have 400. You need to order 80 just to fill the gap, plus 480 for next month's supply.
Your order to the supplier: 560 units. That is a 40% increase over your normal 400-unit monthly order - even though demand only rose 20%.
| Stage | Demand Signal | Order Placed | Amplification |
|---|---|---|---|
| Consumer | +20% (100 to 120/week) | - | - |
| You (the seller) | See +20% in sales | +40% order (400 to 560) | 2x amplification |
| Your supplier | Sees +40% in your PO | +60% production order | 3x amplification |
| Raw material supplier | Sees +60% from manufacturer | +80% material order | 4x amplification |
Each level looks at the signal from the level below and adds a buffer. "My customer ordered 40% more, so I should probably order 60% more to be safe." Rational at every individual step. Destructive in aggregate.
Three weeks later: Demand settles back to 105 units per week (a modest 5% sustained increase). But you already have 560 units arriving. Your supplier has already ordered materials for an even larger batch. Everyone in the chain is now holding more inventory than they need, and the next round of orders will be lower than normal as everyone works through their excess.
This creates the boom-bust cycle that makes supply chains so volatile. It is not random. It is systematic over-reaction compounding at every stage.
Why It Happens
The bullwhip effect is not caused by one thing. It is four behaviors stacked on top of each other, and most sellers are doing at least two of them.
Demand forecast errors. You see a spike and assume the trend will continue. This is human nature. We are terrible at distinguishing a temporary blip from a genuine trend shift. After a 20% increase, the safe bet feels like ordering for continued growth. But most demand spikes revert to the mean within 2-4 weeks. Good forecasting separates signal from noise. Bad forecasting amplifies the noise.
Order batching. If you order once a month instead of weekly, every order is a large batch that amplifies small signals. Say demand increases by 5% per week for three weeks. Your monthly order needs to cover the accumulated shortfall plus next month's elevated demand plus safety stock. That single large PO looks like a demand explosion to your supplier, even though the actual underlying shift was small and gradual.
Price fluctuation response. When your supplier announces a price increase, what do you do? You forward-buy. Place a big order before the increase hits. So does every other customer. The supplier sees a massive demand spike that has nothing to do with actual consumer demand. Then after the price increase, orders drop to near zero as everyone works through their pre-buy inventory.
Shortage gaming. During supply constraints, sellers inflate their orders hoping to get a larger allocation. If a supplier can only fill 50% of orders, you order twice what you need hoping to get your actual requirement. But so does everyone else. The supplier sees order volume that implies demand has doubled, ramps up accordingly, and when the shortage eases, everyone cancels their inflated orders. The supplier is left holding excess.
Real E-commerce Examples
Prime Day / Black Friday spikes. This is the most common bullwhip trigger for Amazon sellers. You see 3-5x normal demand over a short period, panic about being out of stock for the "new normal," and place a large restock order. Your safety stock math says you need more buffer because demand variability just increased. Two weeks later, demand is back to baseline and you have months of supply.
I track this pattern every year. The post-Prime-Day order spike from Amazon sellers to suppliers typically runs 50-80% above normal - far exceeding the actual sustained demand increase, which is usually 5-10%.
TikTok virality. A product goes viral on social media. Sales spike 500% for a week. The seller orders aggressively. By the time the order arrives (4-8 weeks later), the trend has moved on. The seller is sitting on 6 months of supply for a product that went back to pre-viral sales levels.
Tariff announcements. When new tariffs are announced with a future effective date, every seller importing from the affected country front-loads orders. I saw this in 2024 when Section 301 tariff expansions were announced. Sellers placed 3-6 months of orders in a 2-week window. Freight rates spiked. Suppliers were overwhelmed. Then orders dropped to near zero for two months as everyone worked through their stockpile.
Quantified: How Over-ordering Compounds
Here is a worked example showing how the bullwhip effect plays out over 8 weeks for a single SKU.
Normal state: 100 units/week demand, 4-week lead time, 400-unit reorder quantity monthly.
| Week | Actual Demand | Seller's Forecast | Order to Supplier | Supplier's Production Order |
|---|---|---|---|---|
| 1 | 120 (+20%) | "Demand is rising" | 560 (+40%) | 670 (+68%) |
| 2 | 115 | "Still elevated" | 0 (waiting for shipment) | 670 (already in production) |
| 3 | 108 | "Normalizing?" | 0 | 670 |
| 4 | 102 | "Back to normal" | 0 | 670 |
| 5 | 100 | 100 | 350 (-12.5%) (has excess) | 200 (-50%) (has excess) |
| 6 | 100 | 100 | 0 (still working through surplus) | 0 (has inventory) |
| 7 | 100 | 100 | 0 | 0 |
| 8 | 100 | 100 | 400 (back to normal) | 500 (refilling safety stock) |
Total actual demand over 8 weeks: 845 units. Total ordered by seller: 1,310 units. The seller ordered 55% more than was actually consumed. The supplier produced even more.
The excess does not evaporate. It sits in your warehouse costing you 20-30% annually in carrying costs, and the supplier is left with idle capacity or excess components.
How to Dampen the Bullwhip
You cannot eliminate it entirely. But you can reduce the amplification from 2-4x down to 1.1-1.3x, which is the difference between a manageable inventory correction and a cash flow crisis.
Order frequently, in smaller batches. This is the single most effective fix. Weekly orders of 100 units create less amplification than monthly orders of 400 units. When demand shifts, your next order is only a week away, so you adjust in small increments instead of making one large correction. The tradeoff is more frequent PO processing and potentially higher per-unit shipping costs. For most sellers, the inventory savings more than cover the added operational cost.
Use actual demand data, not PO history, for forecasting. Your PO history already has the bullwhip baked in. If you forecast based on what you ordered last year, you are forecasting the amplified signal, not the real demand. Use sell-through data - what customers actually bought - as your forecast input.
Reduce lead times. Every day of lead time is a day of forecasting. Longer lead times mean longer forecast horizons, which means larger errors, which means more amplification. If you can get your supplier from 8 weeks to 4 weeks, you have cut your forecast window in half. That alone reduces bullwhip amplification significantly.
Do not react to single data points. A 20% demand increase in one week is not a trend. It might be a trend. Or it might be random variation. Wait 2-3 weeks before adjusting your ordering pattern. I know this feels dangerous - what if demand really did shift up and you stock out? That is what safety stock is for. It buys you the time to confirm whether a signal is real.
Share demand data with suppliers. If your supplier can see your sell-through data instead of just your POs, they can plan production based on actual consumer demand. Most suppliers will jump at this because it helps them reduce their own inventory risk. Even a simple monthly email with your sales data by SKU is better than nothing.
Measuring Your Own Amplification
Here is how to check whether you are bullwhipping your supply chain. Pull your last 12 months of data and calculate two numbers:
Demand coefficient of variation (CV): Standard deviation of your monthly sell-through divided by the mean. This measures how much actual customer demand varies.
Order CV: Standard deviation of your monthly PO quantities divided by the mean. This measures how much your ordering varies.
If your Order CV is more than 1.5x your Demand CV, you are amplifying the signal. The closer the ratio is to 1.0, the better your ordering tracks actual demand. Tracking days of supply week-over-week gives you a fast sanity check - if your coverage swings more than your sales do, your ordering is the source of the amplification.
| Order CV / Demand CV Ratio | Interpretation |
|---|---|
| 0.8 - 1.2 | Healthy. Your orders track demand well. |
| 1.2 - 1.5 | Mild amplification. Probably fine, monitor it. |
| 1.5 - 2.0 | Moderate bullwhip. Your orders swing wider than demand. Review your reorder triggers. |
| 2.0+ | Severe amplification. You are over-reacting to demand signals. |
I run this calculation quarterly on my top 20 SKUs. It takes about 30 minutes in a spreadsheet. The first time I did it, my ratio was 2.4. I was horrified. After switching to weekly ordering and using rolling averages instead of point-in-time demand, I got it down to 1.3 within two quarters.
Demand Visibility in ReplenishRadar
The manual version of bullwhip mitigation is exhausting. You have to track actual sell-through separately from PO history, maintain rolling demand averages that smooth out spikes, and manually calculate whether a demand shift is statistically significant or just noise. ReplenishRadar does this on every sync. The demand forecast uses sell-through velocity, not PO history, so the bullwhip signal is stripped out before it hits your reorder suggestions. When a seasonal spike hits, the system can distinguish a sustained shift from a temporary blip by comparing to historical patterns - which means your restock orders match the actual demand change, not an amplified version of it.
If you are managing more than 100 SKUs across multiple channels, doing this in spreadsheets takes more time than the inventory savings are worth. See how ReplenishRadar handles it ->
The Simple Rule
When you see a demand spike, ask yourself: "Am I ordering based on what I actually need, or am I ordering based on what I am afraid might happen?"
Fear-based ordering is the root of the bullwhip effect. A 20% demand increase should trigger a 20% order increase, give or take your safety stock adjustment. If your order increase is 2x or 3x the demand increase, you are amplifying the signal.
The sellers who handle volatility best are the ones who order frequently, adjust gradually, and trust their safety stock to absorb short-term spikes. That is not exciting advice. But boring inventory management is profitable inventory management.
Related Reading:
Frequently Asked Questions
Get notified when it matters
Amazon and Shopify change the rules constantly. We'll email you when something affects your business.
See what your inventory is really doing
Doing $5M+ in revenue? Talk to our team
Related Posts
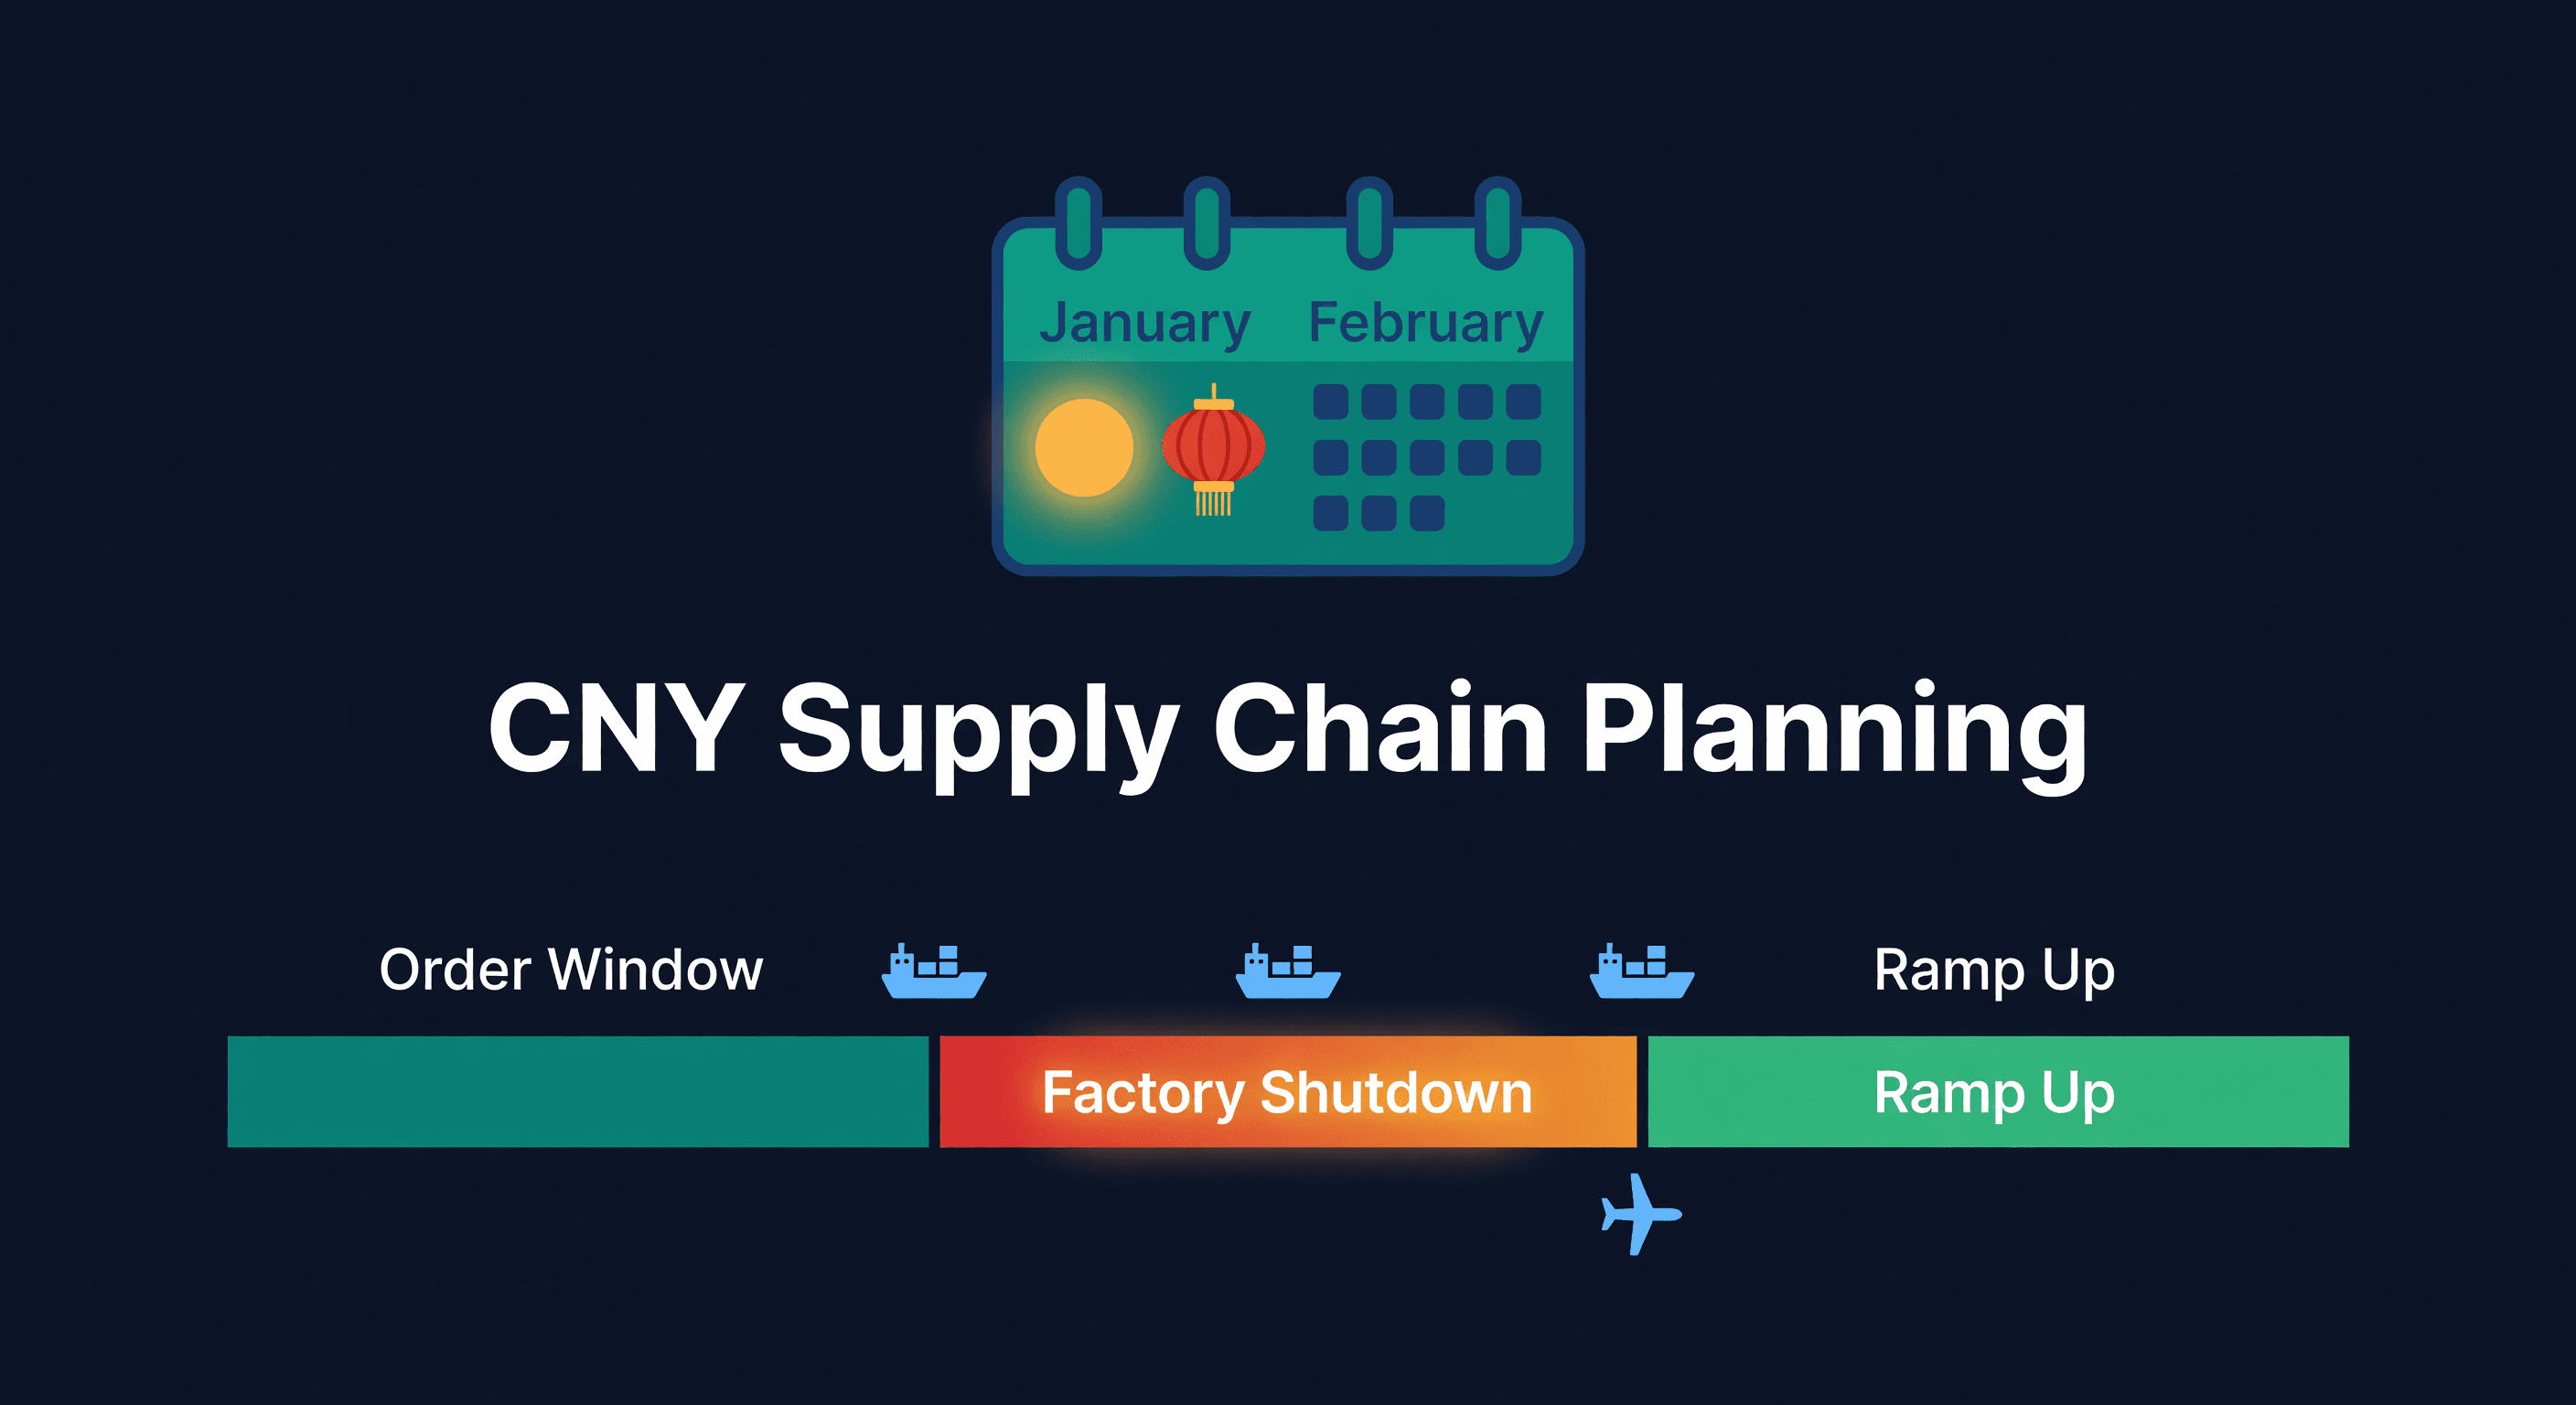
Chinese New Year Supply Chain Planning Guide
How to plan inventory around Chinese New Year factory shutdowns. Timelines, buffer calculations, and the mistakes that leave sellers out of stock for 6 weeks.
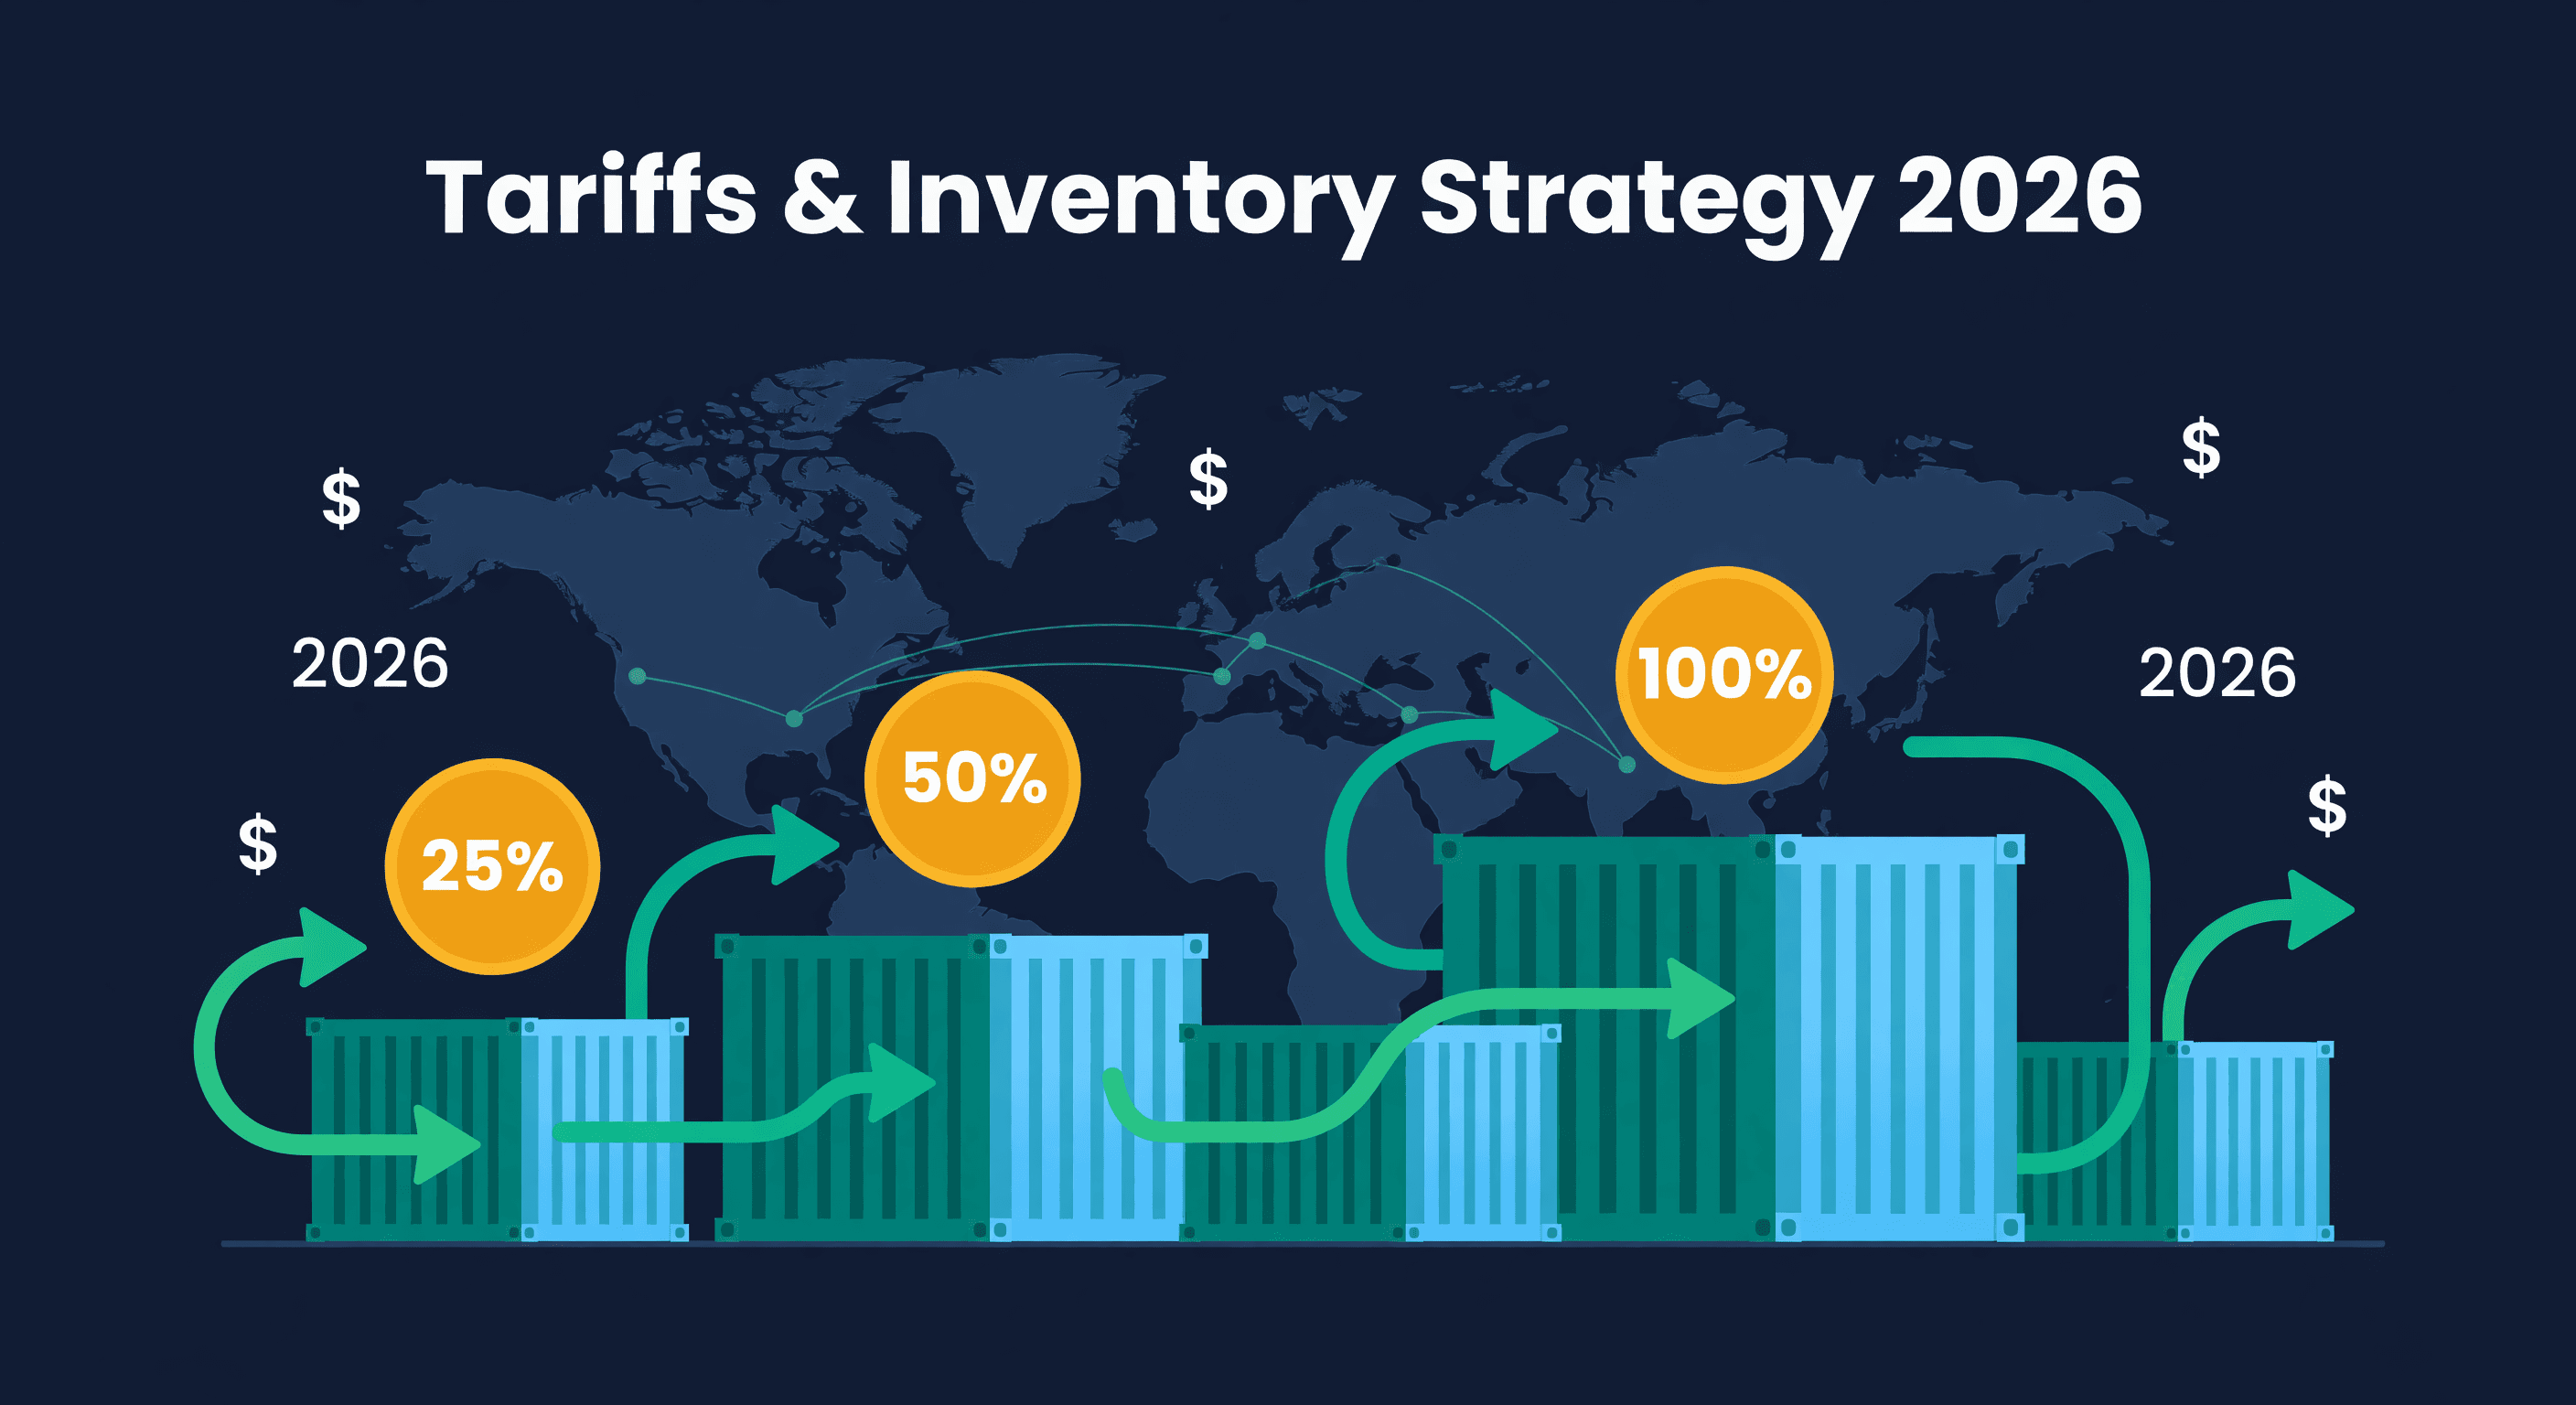
Tariffs and Inventory Strategy in 2026
How Section 301 tariffs, de minimis changes, and tariff risk affect what you buy and when. Pre-buy math, more than one supplier, and safety stock changes.
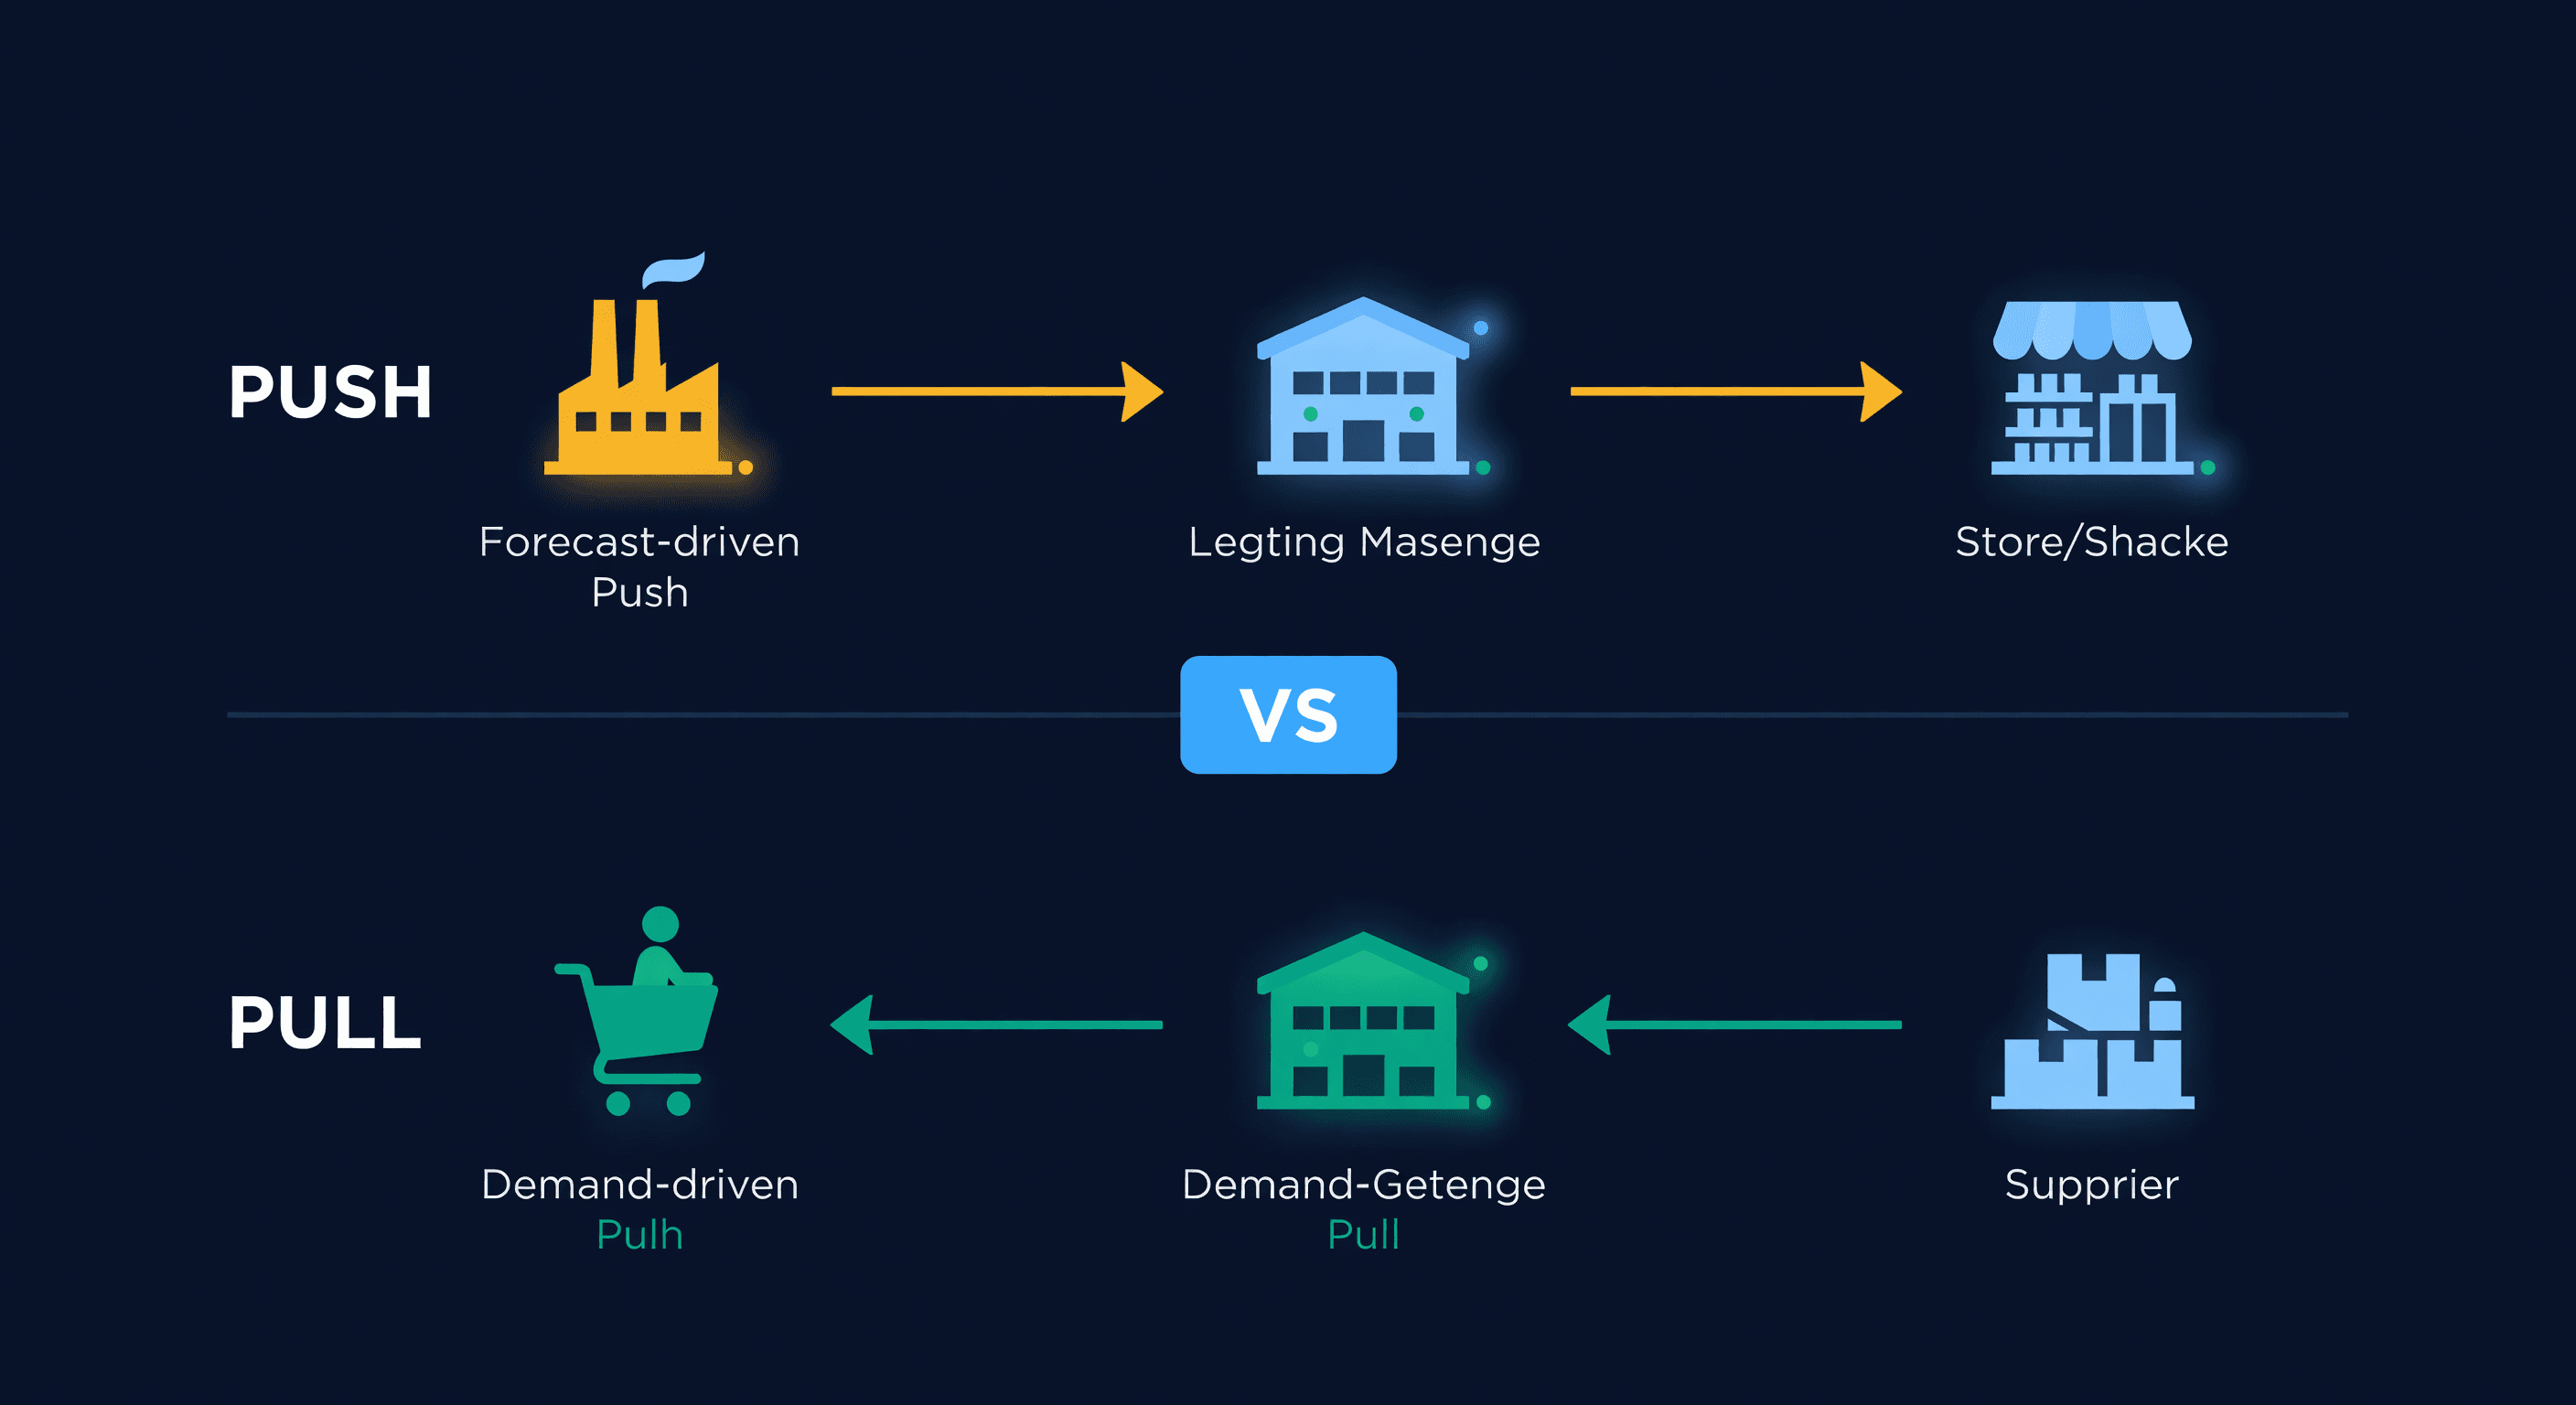
Pull vs Push Inventory: Which Model Wins?
Push inventory relies on forecasts. Pull inventory responds to demand. Most e-commerce sellers need both. Here's how to decide.
