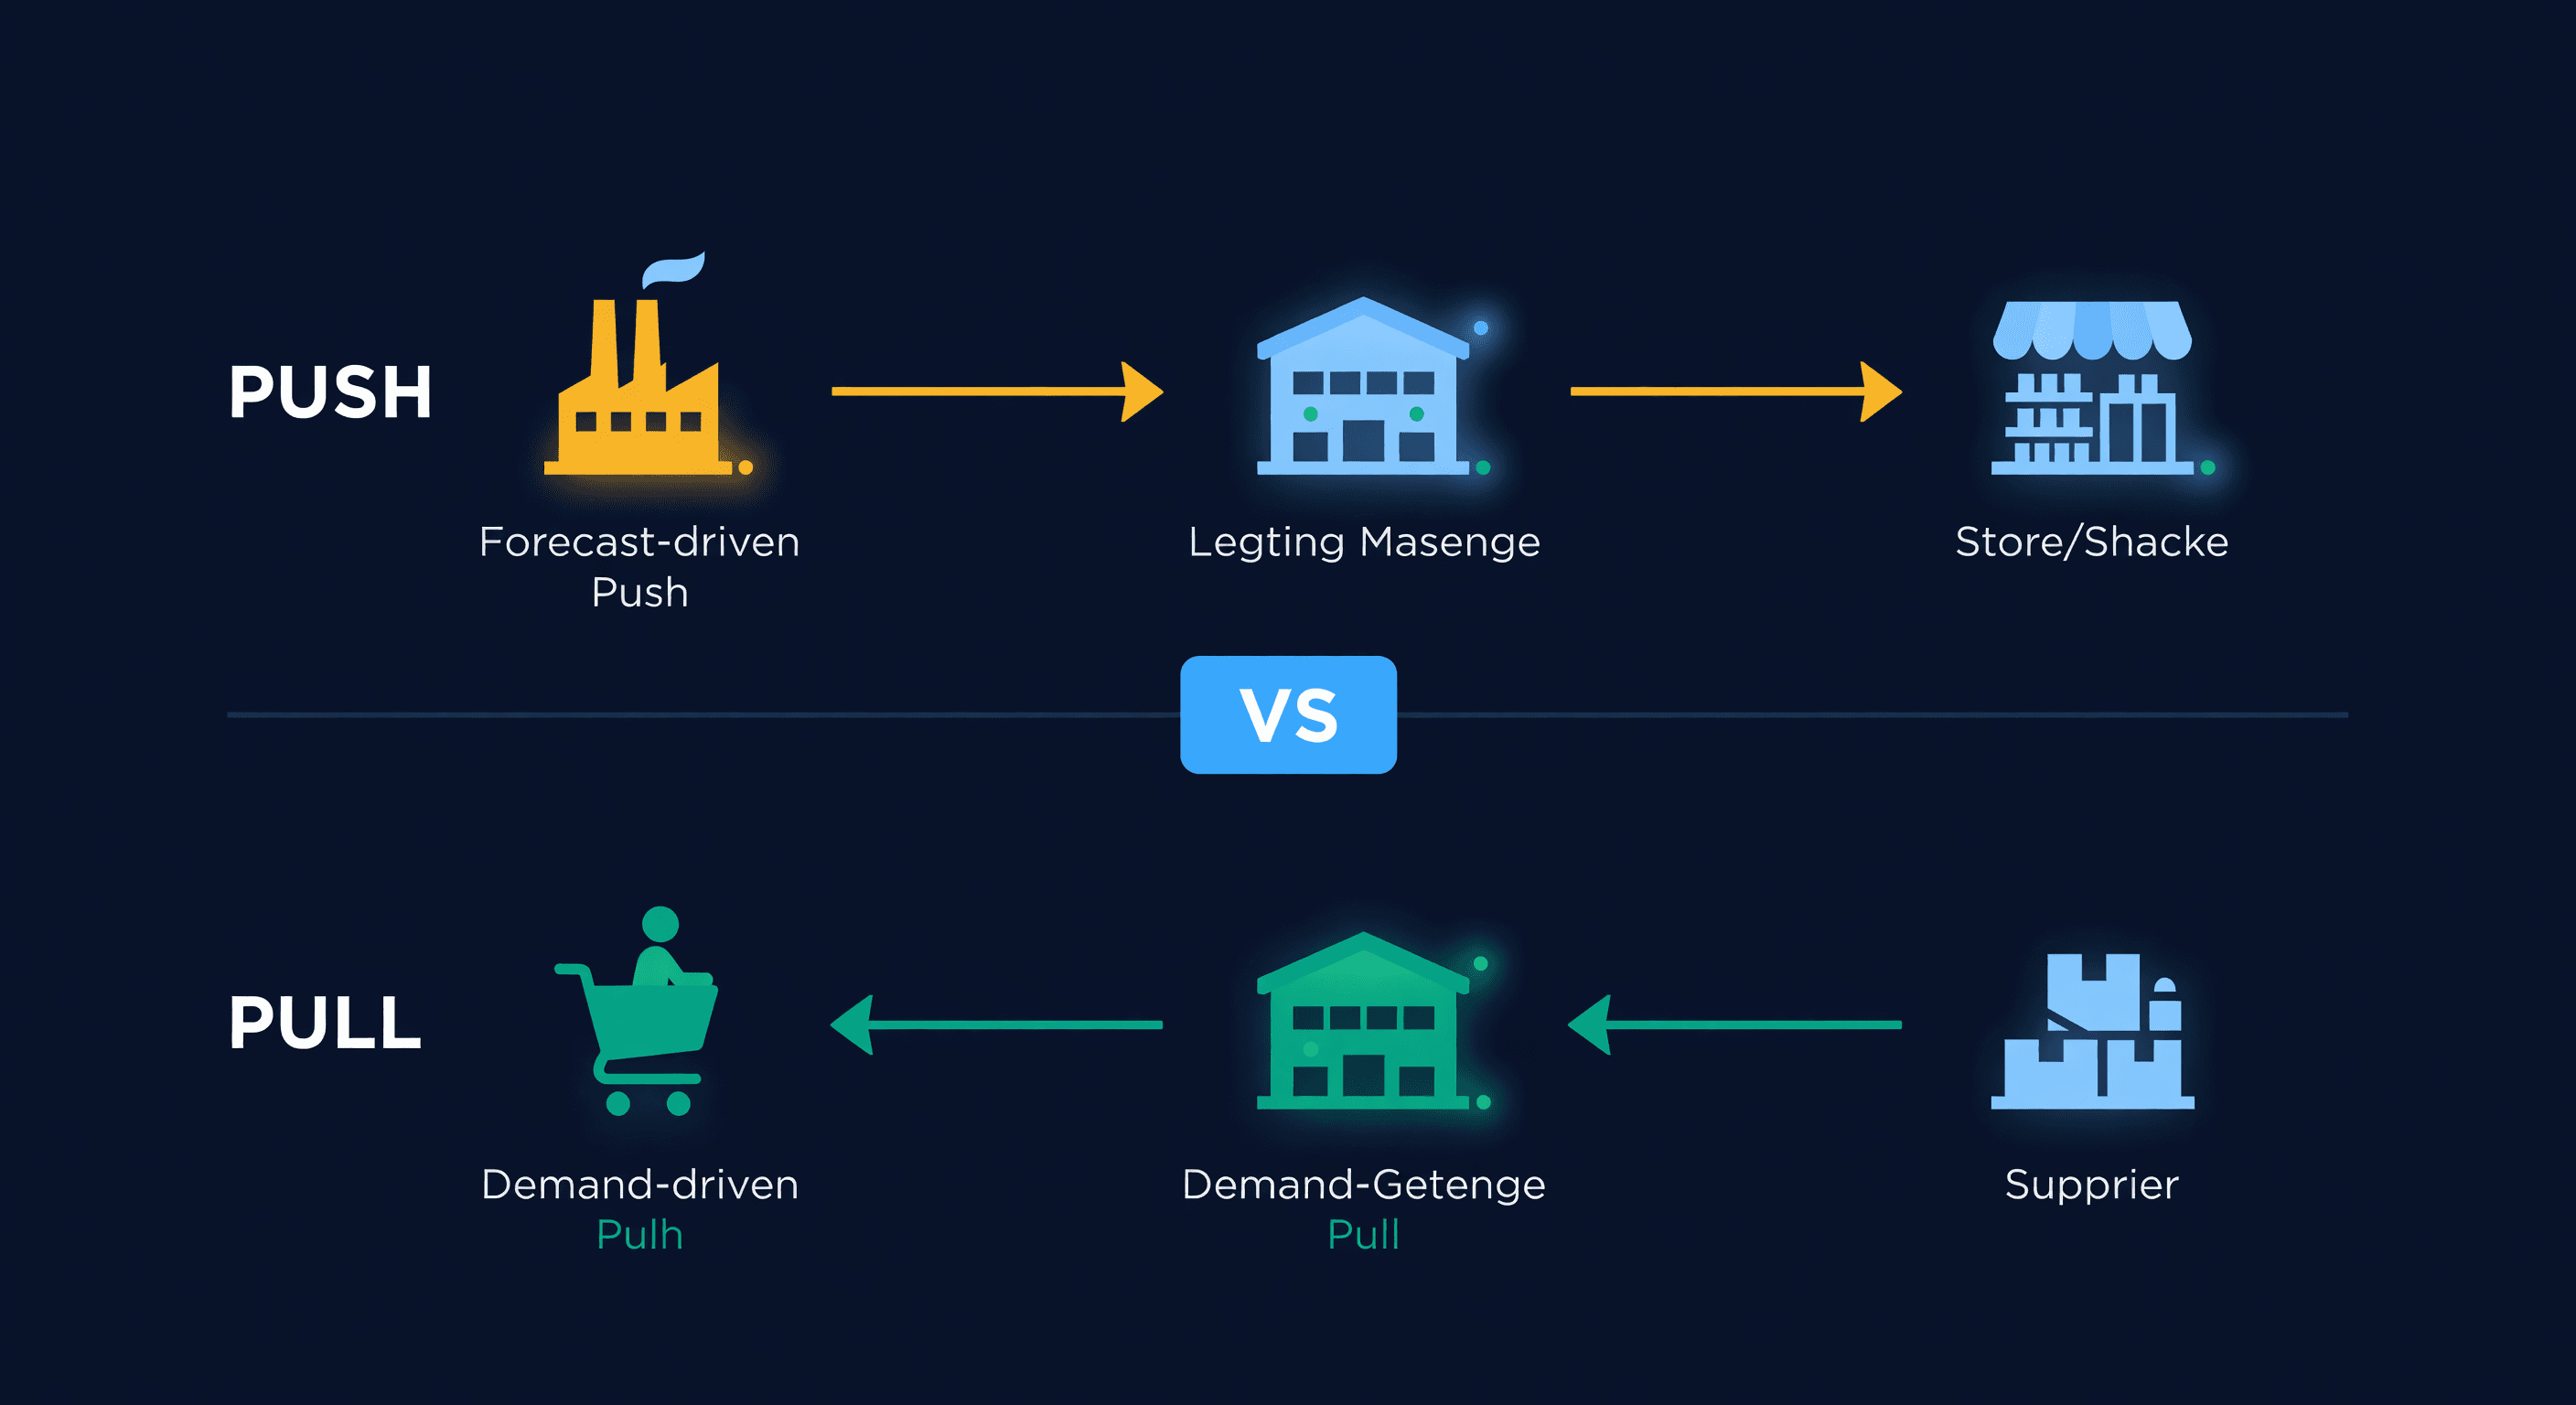
Pull vs Push Inventory: Which Model Wins?
Key takeaway: Use push ordering (forecast-based pre-buys) for seasonal and long-lead-time SKUs. Use pull ordering (reorder-point-triggered) for evergreen items with stable demand. Most sellers need both strategies depending on product type and supplier lead time.
Every inventory decision you make falls into one of two buckets: you are either guessing what will sell, or you are reacting to what already sold. That is push versus pull. And most of the advice online makes it sound like you have to pick one. You do not.
Push: Betting on the Forecast
Push inventory means ordering before demand happens. You look at a forecast - or a hunch, or last year's numbers - and you stock up in advance. The product sits in your warehouse or FBA waiting for buyers.
This is how most sellers start. You find a product, order 500 units from your supplier, ship them to Amazon, and hope they sell. That initial order is pure push. You are pushing inventory into the channel based on what you think will happen.
Push works when:
- You are launching a new product with zero sales history
- A seasonal spike is coming and lead times are too long to react
- Your supplier offers a volume discount that makes pre-buying profitable
- You sell on Amazon and need to pre-position FBA inventory weeks before peak
The risk is obvious. Guess wrong and you are sitting on dead stock. I have a friend who pushed 3,000 units of a holiday product into FBA in September. It sold 800. The other 2,200 sat there racking up long-term storage fees until March.
The less obvious risk: push trains you to think in big batches. You get comfortable ordering 90 days of inventory at a time because the per-unit cost is lower. But that 90-day batch carries 90 days of demand risk. If the market shifts - a competitor launches, a trend fades, Amazon changes the algorithm - you are stuck.
| Push inventory | Details |
|---|---|
| Trigger | Forecast or planned promotion |
| Risk | Overstock if forecast is wrong |
| Capital requirement | High - you pay for inventory before it sells |
| Best for | New launches, seasonal buys, long lead times |
| Data needed | Historical sales, trend analysis, market signals |
| Pull inventory | Details |
|---|---|
| Trigger | Stock drops below reorder point |
| Risk | Stockout if lead time is longer than expected |
| Capital requirement | Lower - you buy based on recent demand |
| Best for | Established products, short lead times, stable demand |
| Data needed | Sales velocity, lead time, demand variability |
Pull: Responding to Reality
Pull inventory means you replenish based on actual demand. Something sold, stock dropped below a threshold, you reorder. The customer's purchase is what "pulls" new inventory through the supply chain.
The reorder point formula is pull inventory in its purest form:
Reorder Point = (Average Daily Sales x Lead Time in Days) + Safety Stock
If you sell 10 units per day and your lead time is 14 days, your reorder point is 140 plus safety stock. When on-hand inventory hits that number, you order. No forecast needed for the trigger. Just math on what actually happened.
Pull works when:
- The product has consistent, established demand
- Lead times are short enough that you can react (under 30 days)
- You have reliable sales velocity data from at least 8-12 weeks
- Demand does not swing wildly by season
I switched most of my catalog to pull-based replenishment about three years ago. My overstock dropped by about 35% in six months. Instead of guessing how much to order every month, I set reorder points and let actual sales trigger the orders.
Where Pure Pull Falls Apart
Pull sounds cleaner. React to reality instead of guessing. But it has a hard constraint: lead time.
If your supplier ships in 7 days, pull works beautifully. You carry a small buffer, reorder often, and keep inventory lean. But what happens when your supplier is in Shenzhen and lead time is 60 days by sea?
Now your reorder point math looks like this:
Reorder Point = 10 units/day x 60 days + safety stock = 600+ units
You are carrying two months of inventory at all times just to avoid stocking out. That is not lean. That is a pile of cash sitting in a container.
| Lead time | Reorder point (10 units/day, basic safety stock) | Inventory investment at $15/unit |
|---|---|---|
| 7 days | 95 units | $1,425 |
| 14 days | 175 units | $2,625 |
| 30 days | 350 units | $5,250 |
| 60 days | 680 units | $10,200 |
| 90 days | 1,010 units | $15,150 |
The longer the lead time, the more inventory you need in the pipeline. At 60+ days, you are making a bet whether you like it or not. You just made the bet two months ago instead of today.
Seasonal demand breaks pull too. Your seasonal products cannot wait for the reorder point to trigger. By the time sales spike and your stock hits the threshold, the lead time window means you miss the peak entirely. I learned this the hard way with a product that doubled in sales every October. My reorder point triggered in mid-October. My supplier shipped in late November. Peak was over.
How to Know Which Model Is Working
You cannot improve what you do not measure. For pull-based SKUs, track two things: in-stock rate and average days of supply. If your in-stock rate drops below 95%, your reorder points are too low or your lead time data is stale. If average days of supply creeps above 45, you are carrying more buffer than the math justifies.
For push-based SKUs, measure forecast accuracy. Compare what you ordered to what you actually sold during the same period. A forecast that is off by more than 30% on a seasonal buy means you are either stocking out or sitting on excess. Neither is acceptable.
| Model | Key metric | Target | Red flag |
|---|---|---|---|
| Pull | In-stock rate | Above 95% | Below 90% for 2+ weeks |
| Pull | Days of supply | 14-30 days | Above 45 days |
| Push | Forecast accuracy (MAPE) | Under 25% | Above 40% |
| Push | Sell-through rate | Above 80% within plan period | Below 60% |
I check these numbers weekly. It takes about 15 minutes if your data is in one place, longer if you are pulling from multiple sources. The sellers who check monthly instead of weekly find out about problems after they have already lost money.
The Hybrid That Actually Works
Here is what I tell sellers: use pull as your default and push as your override.
For 80% of your catalog - established products with steady demand and reasonable lead times - pull-based reorder points work. Set them, review them monthly, and let sales velocity dictate your ordering.
For the other 20%, push forward:
- Seasonal pre-buys. Use your demand forecast to estimate the spike. Order early enough that inventory arrives 2-3 weeks before the surge. Eat the carrying cost. A few weeks of extra storage is cheaper than missing a seasonal peak.
- New product launches. No sales history means no reorder point. Estimate 60-90 days of demand, order it, and switch to pull once you have 8-12 weeks of data.
- Long lead time suppliers. If lead time exceeds 45 days, supplement your reorder point with a forward forecast. The reorder point handles the trigger. The forecast adjusts the quantity.
The ratio shifts by business. A seller with mostly domestic suppliers and stable demand might run 95% pull. An importer sourcing from Asia with seasonal products might run 50/50. The point is that neither model works alone.
How to Set This Up
Start by sorting your SKUs into two buckets.
Pull candidates have three things: at least 8 weeks of sales data, lead times under 30 days, and coefficient of variation (standard deviation / mean) below 0.5 on weekly sales. These get reorder points and automated replenishment.
Push candidates have one or more of: no sales history, lead times above 45 days, strong seasonal patterns, or coefficient of variation above 0.7. These get manual forecasts and planned order dates.
For a 500-SKU catalog, I would expect roughly 350-400 SKUs on pull and 100-150 on push at any given time. New products start as push and graduate to pull. Seasonal items toggle between the two depending on the calendar.
The math is not hard. The discipline is. You have to actually update your reorder points as demand changes, and you have to plan your push buys far enough in advance that lead times do not eat your margin. We built ReplenishRadar's reorder point system around this exact split. The system calculates pull-based reorder points from your actual sales velocity and lead time data, then adjusts them as both numbers change. When you layer in the demand forecast for seasonal or trending products, you get the push element on top. Two models, one dashboard, no spreadsheet to reconcile every week.
Try ReplenishRadar free for 14 days ->
The Decision That Matters More
Push versus pull is a useful framework. But the decision that actually moves the needle is not which model you pick. It is how often you review and adjust. A pull system with stale reorder points is just as dangerous as a push system with a bad forecast.
Review your reorder points monthly. Update your push forecasts quarterly. Compare what you predicted to what happened. The gap between forecast and reality is where the money leaks out.
Related Reading:
Frequently Asked Questions
Get notified when it matters
Amazon and Shopify change the rules constantly. We'll email you when something affects your business.
See what your inventory is really doing
Doing $5M+ in revenue? Talk to our team
Related Posts
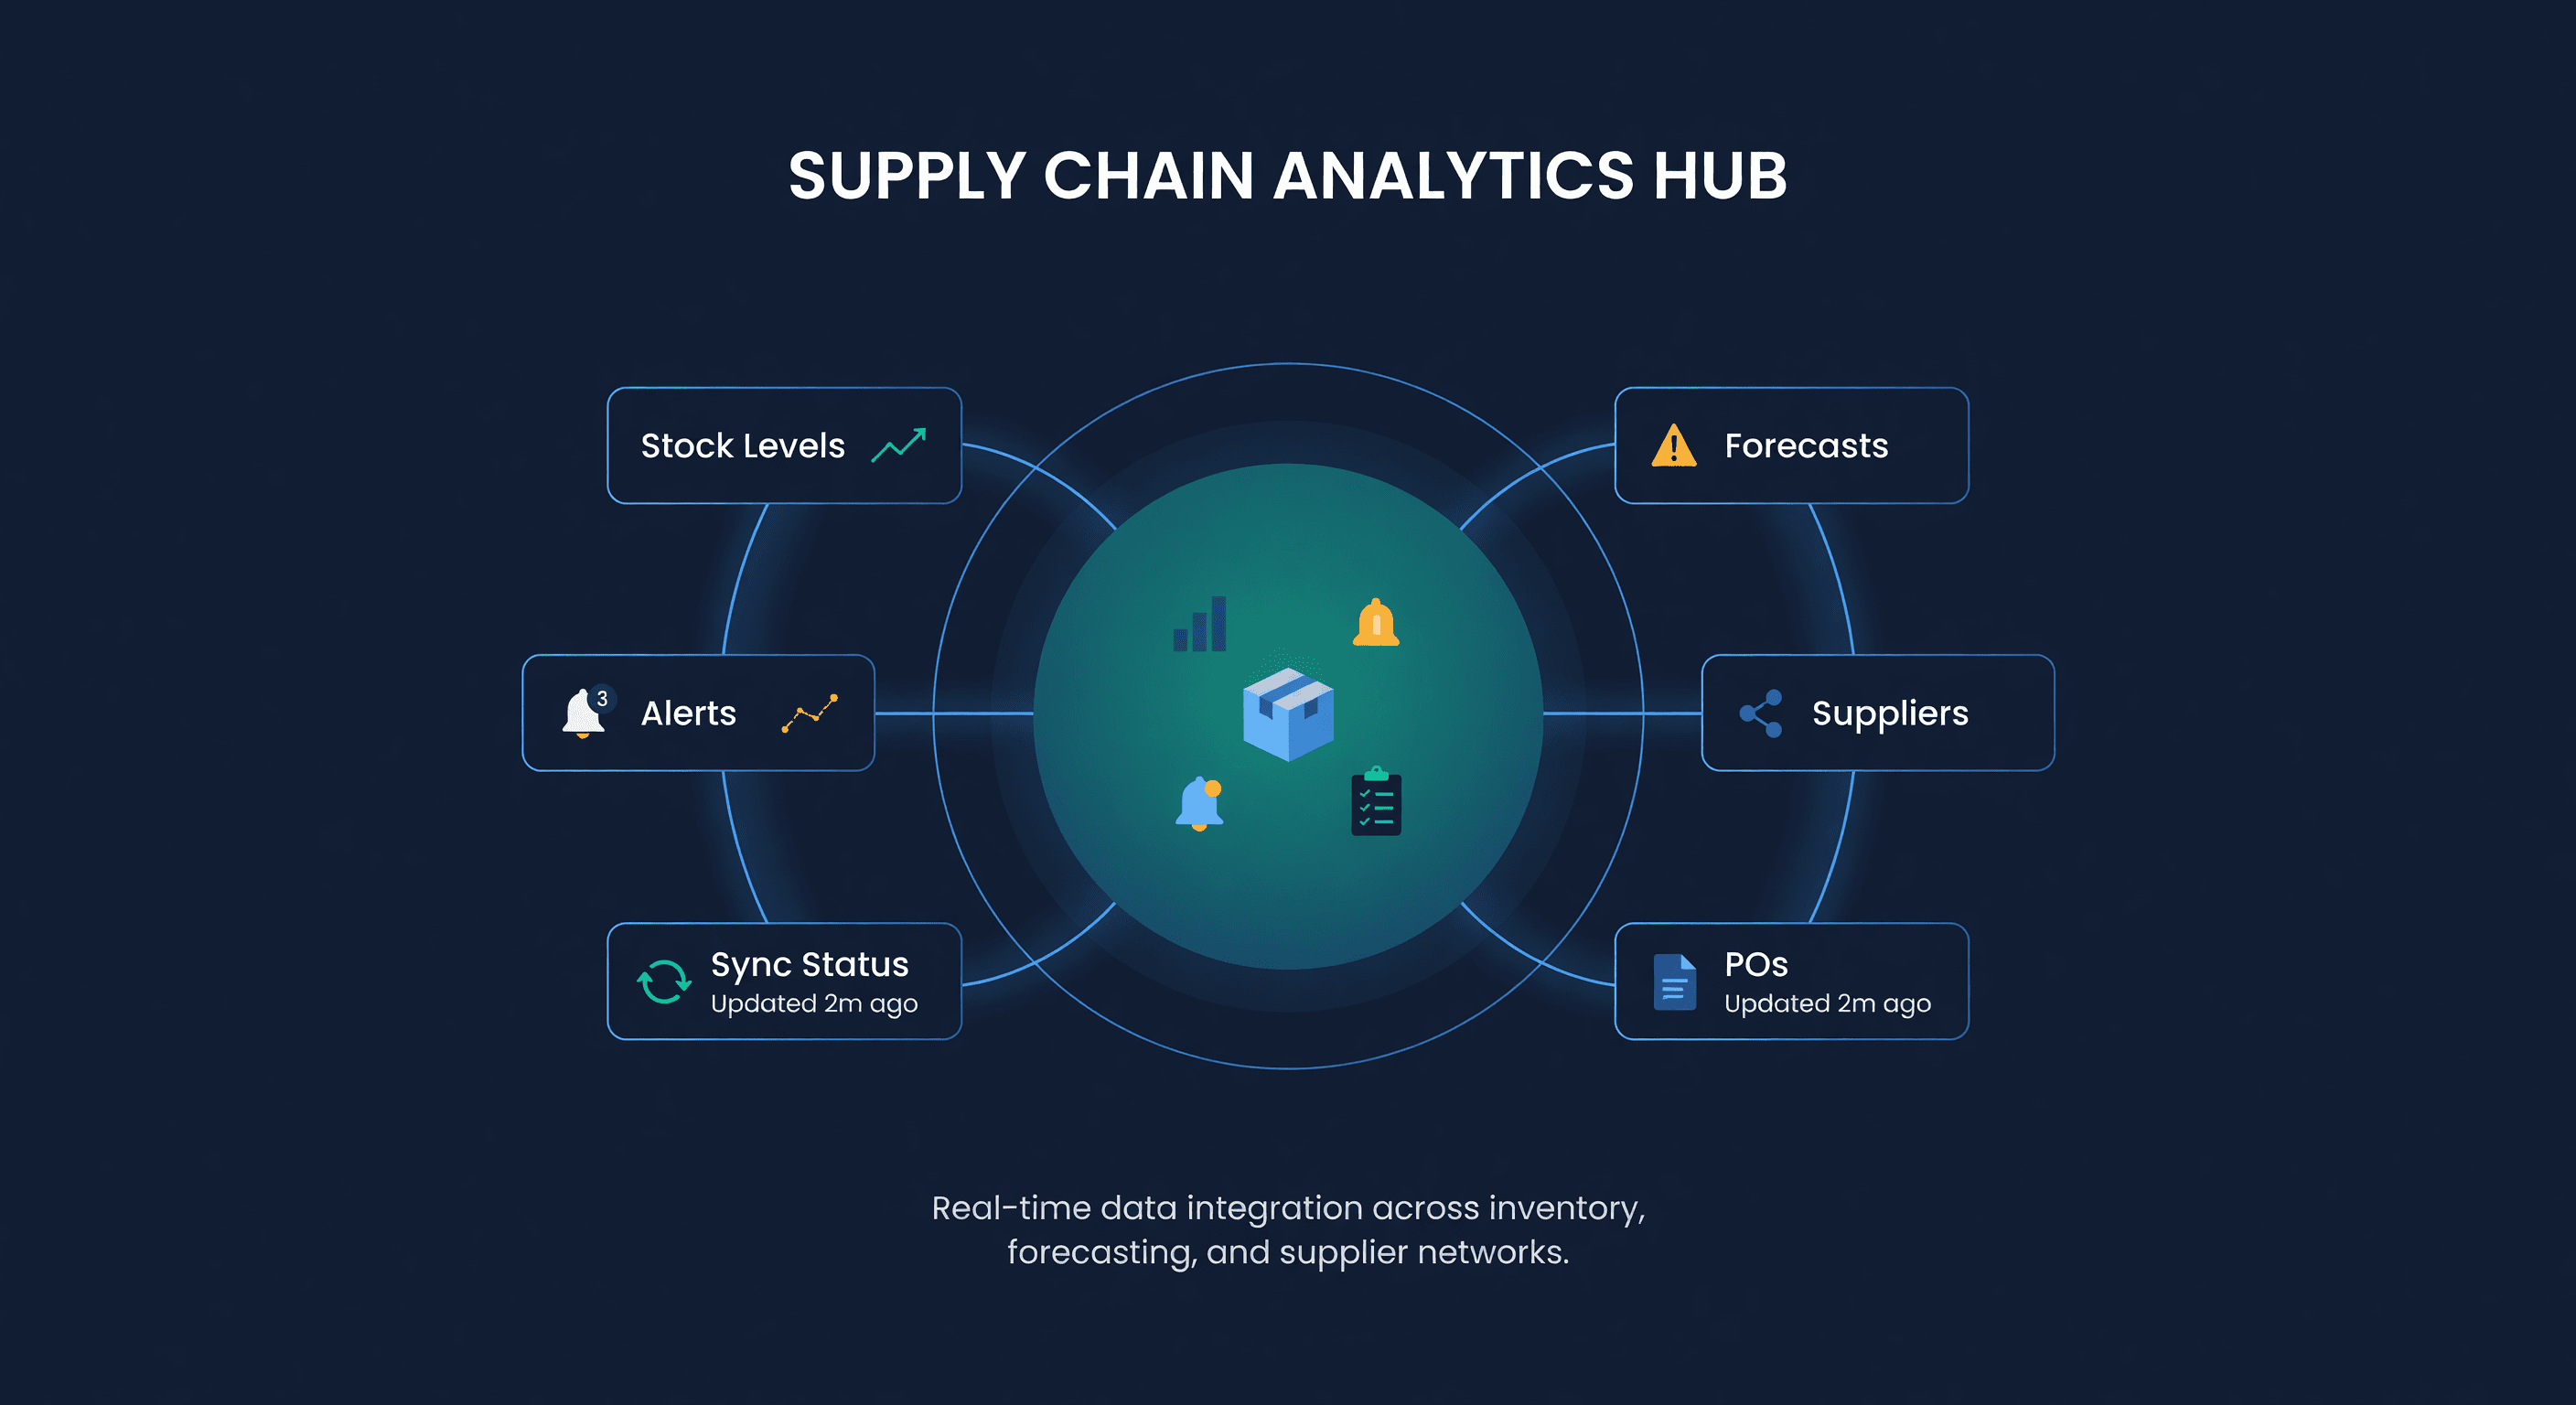
What Can an AI Agent Do With Your Inventory Data?
Real use cases for AI agents in inventory management: morning briefings, stockout alerts, PO drafts, and what agents still can't do.
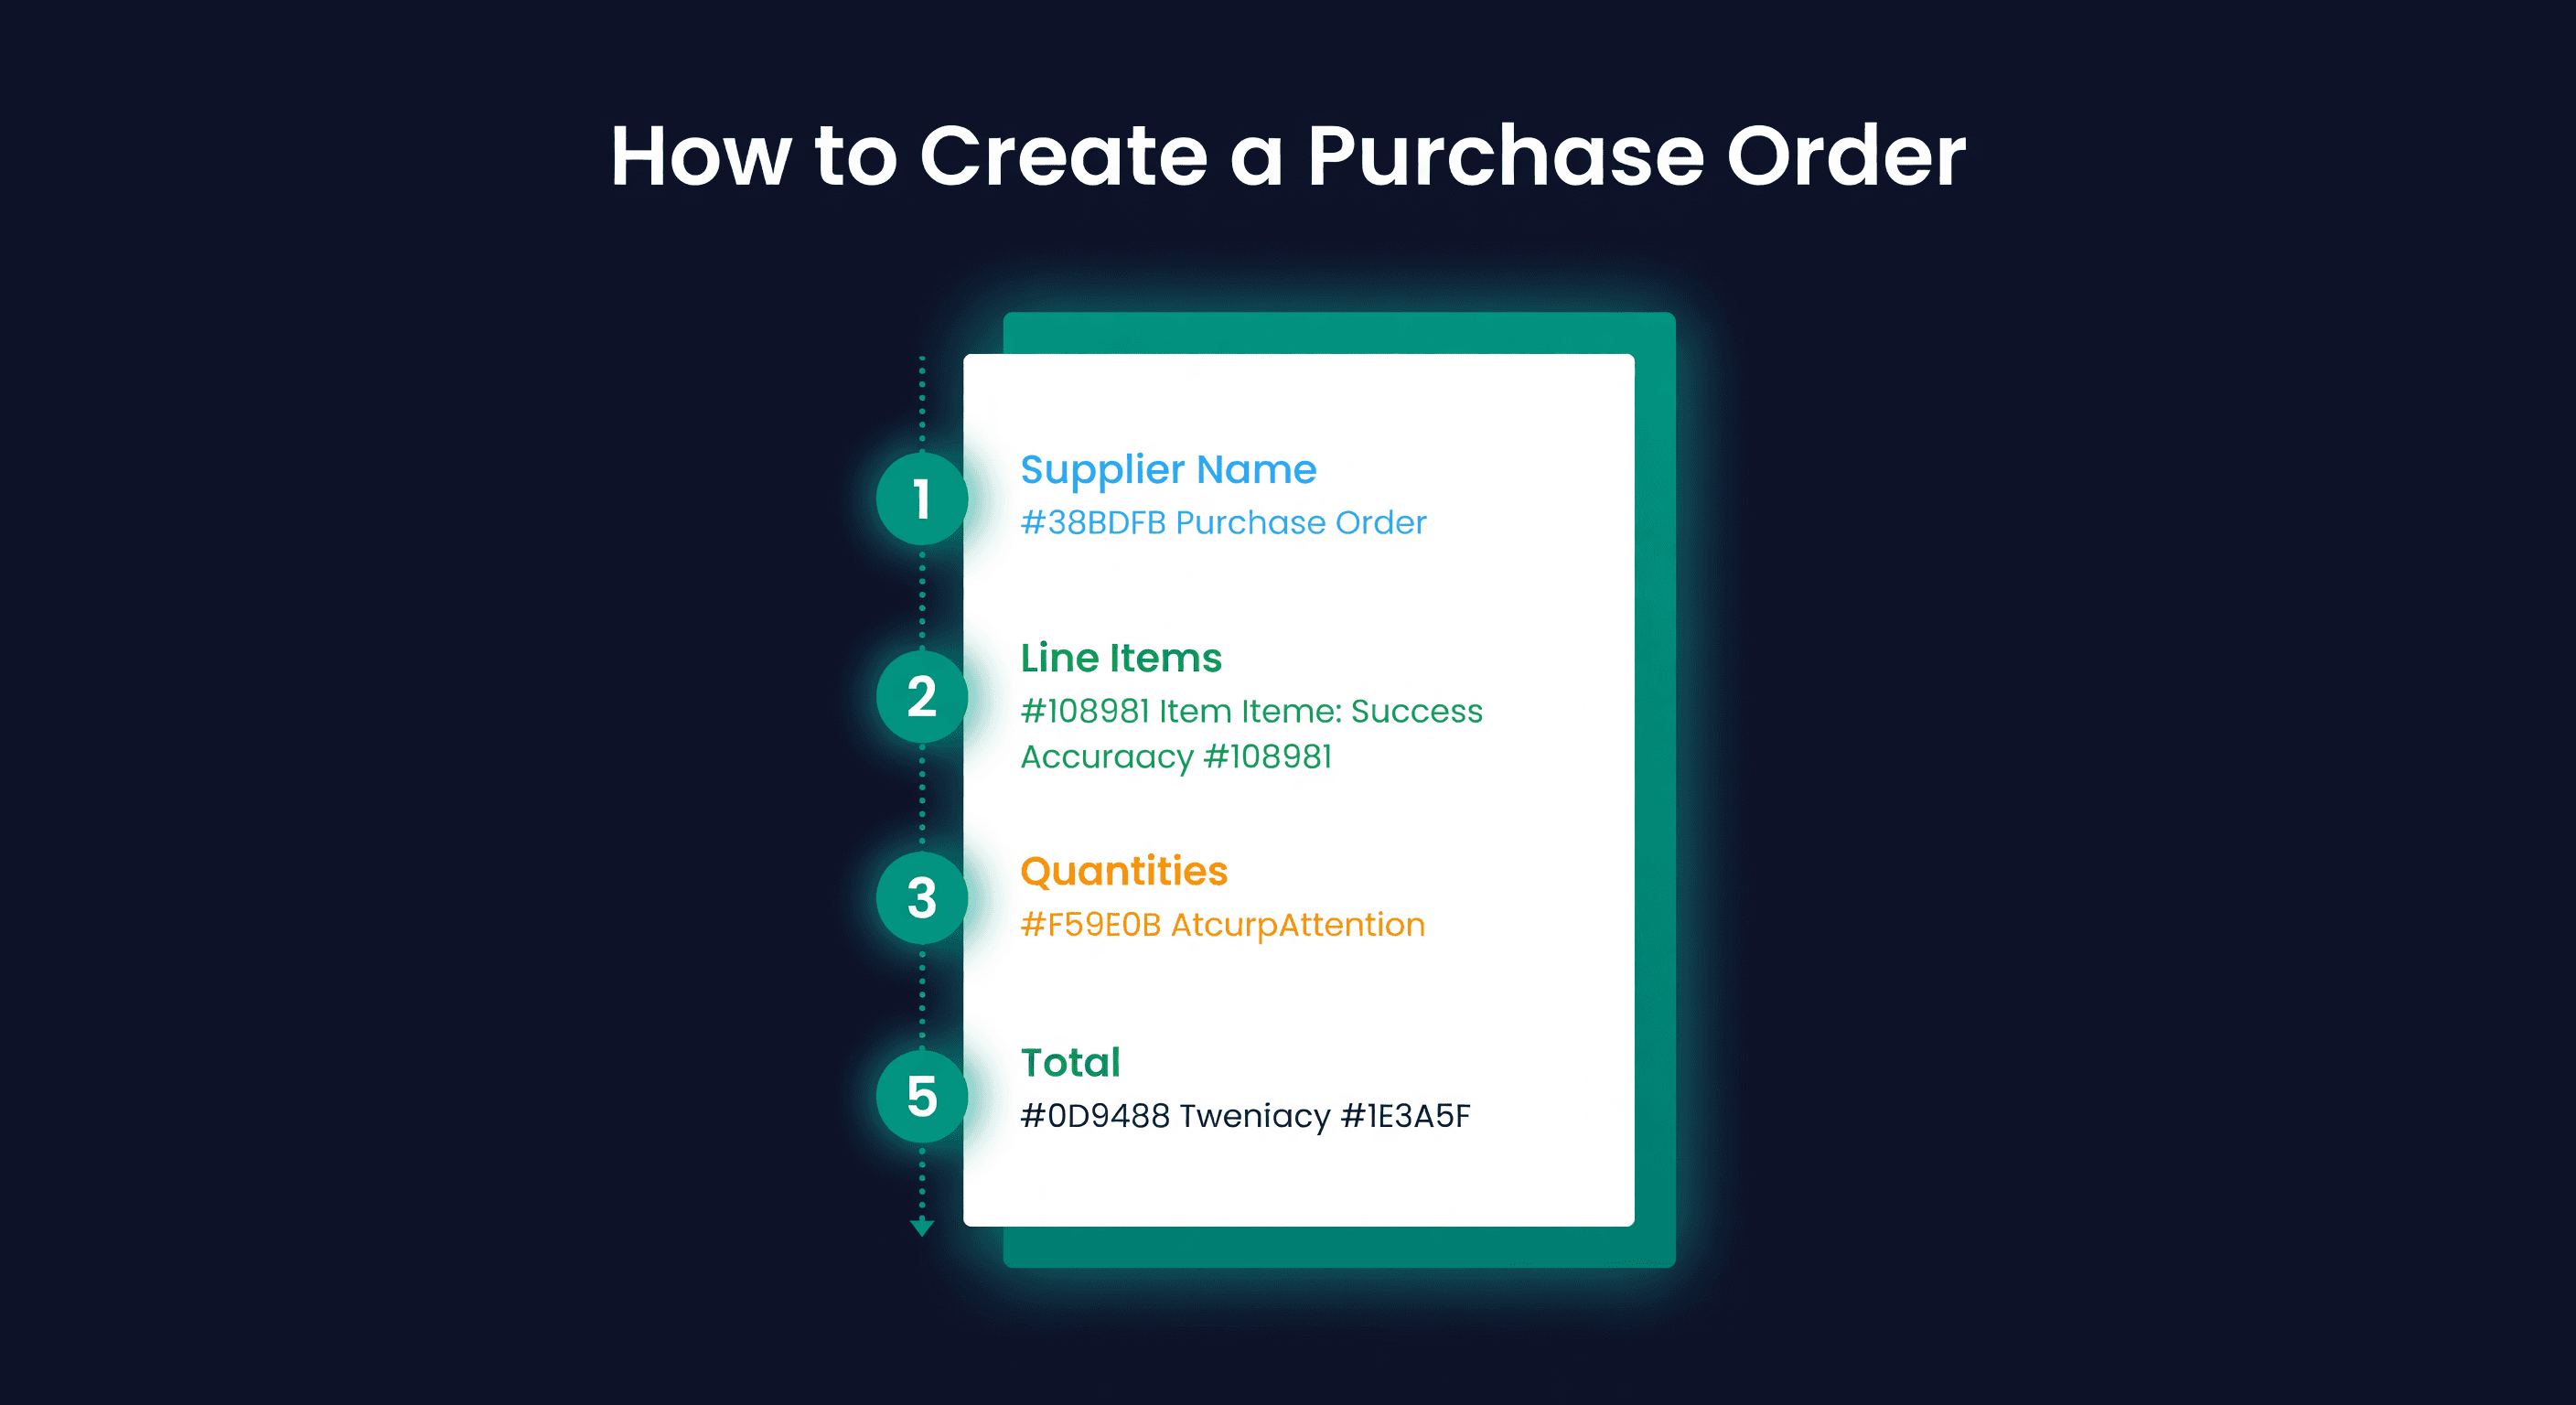
How to Create a Purchase Order (Step-by-Step)
How to create a purchase order for e-commerce, with a PO template, worked examples, and the ordering mistakes that cost sellers thousands.

The Bullwhip Effect in E-commerce
How a 20% demand spike becomes a 60% order increase upstream. What the bullwhip effect is, why it happens, and how to stop amplifying demand signals.
