Inventory Planning for Seasonal Products: Step-by-Step Guide
Key takeaway: Plan seasonal inventory 6 months ahead for overseas suppliers, 3 months for domestic. Adjust last year's sales data for growth rate and new channels. One stockout during peak season costs the full season, because there's no making it up in the off-season.
One Shot Per Year
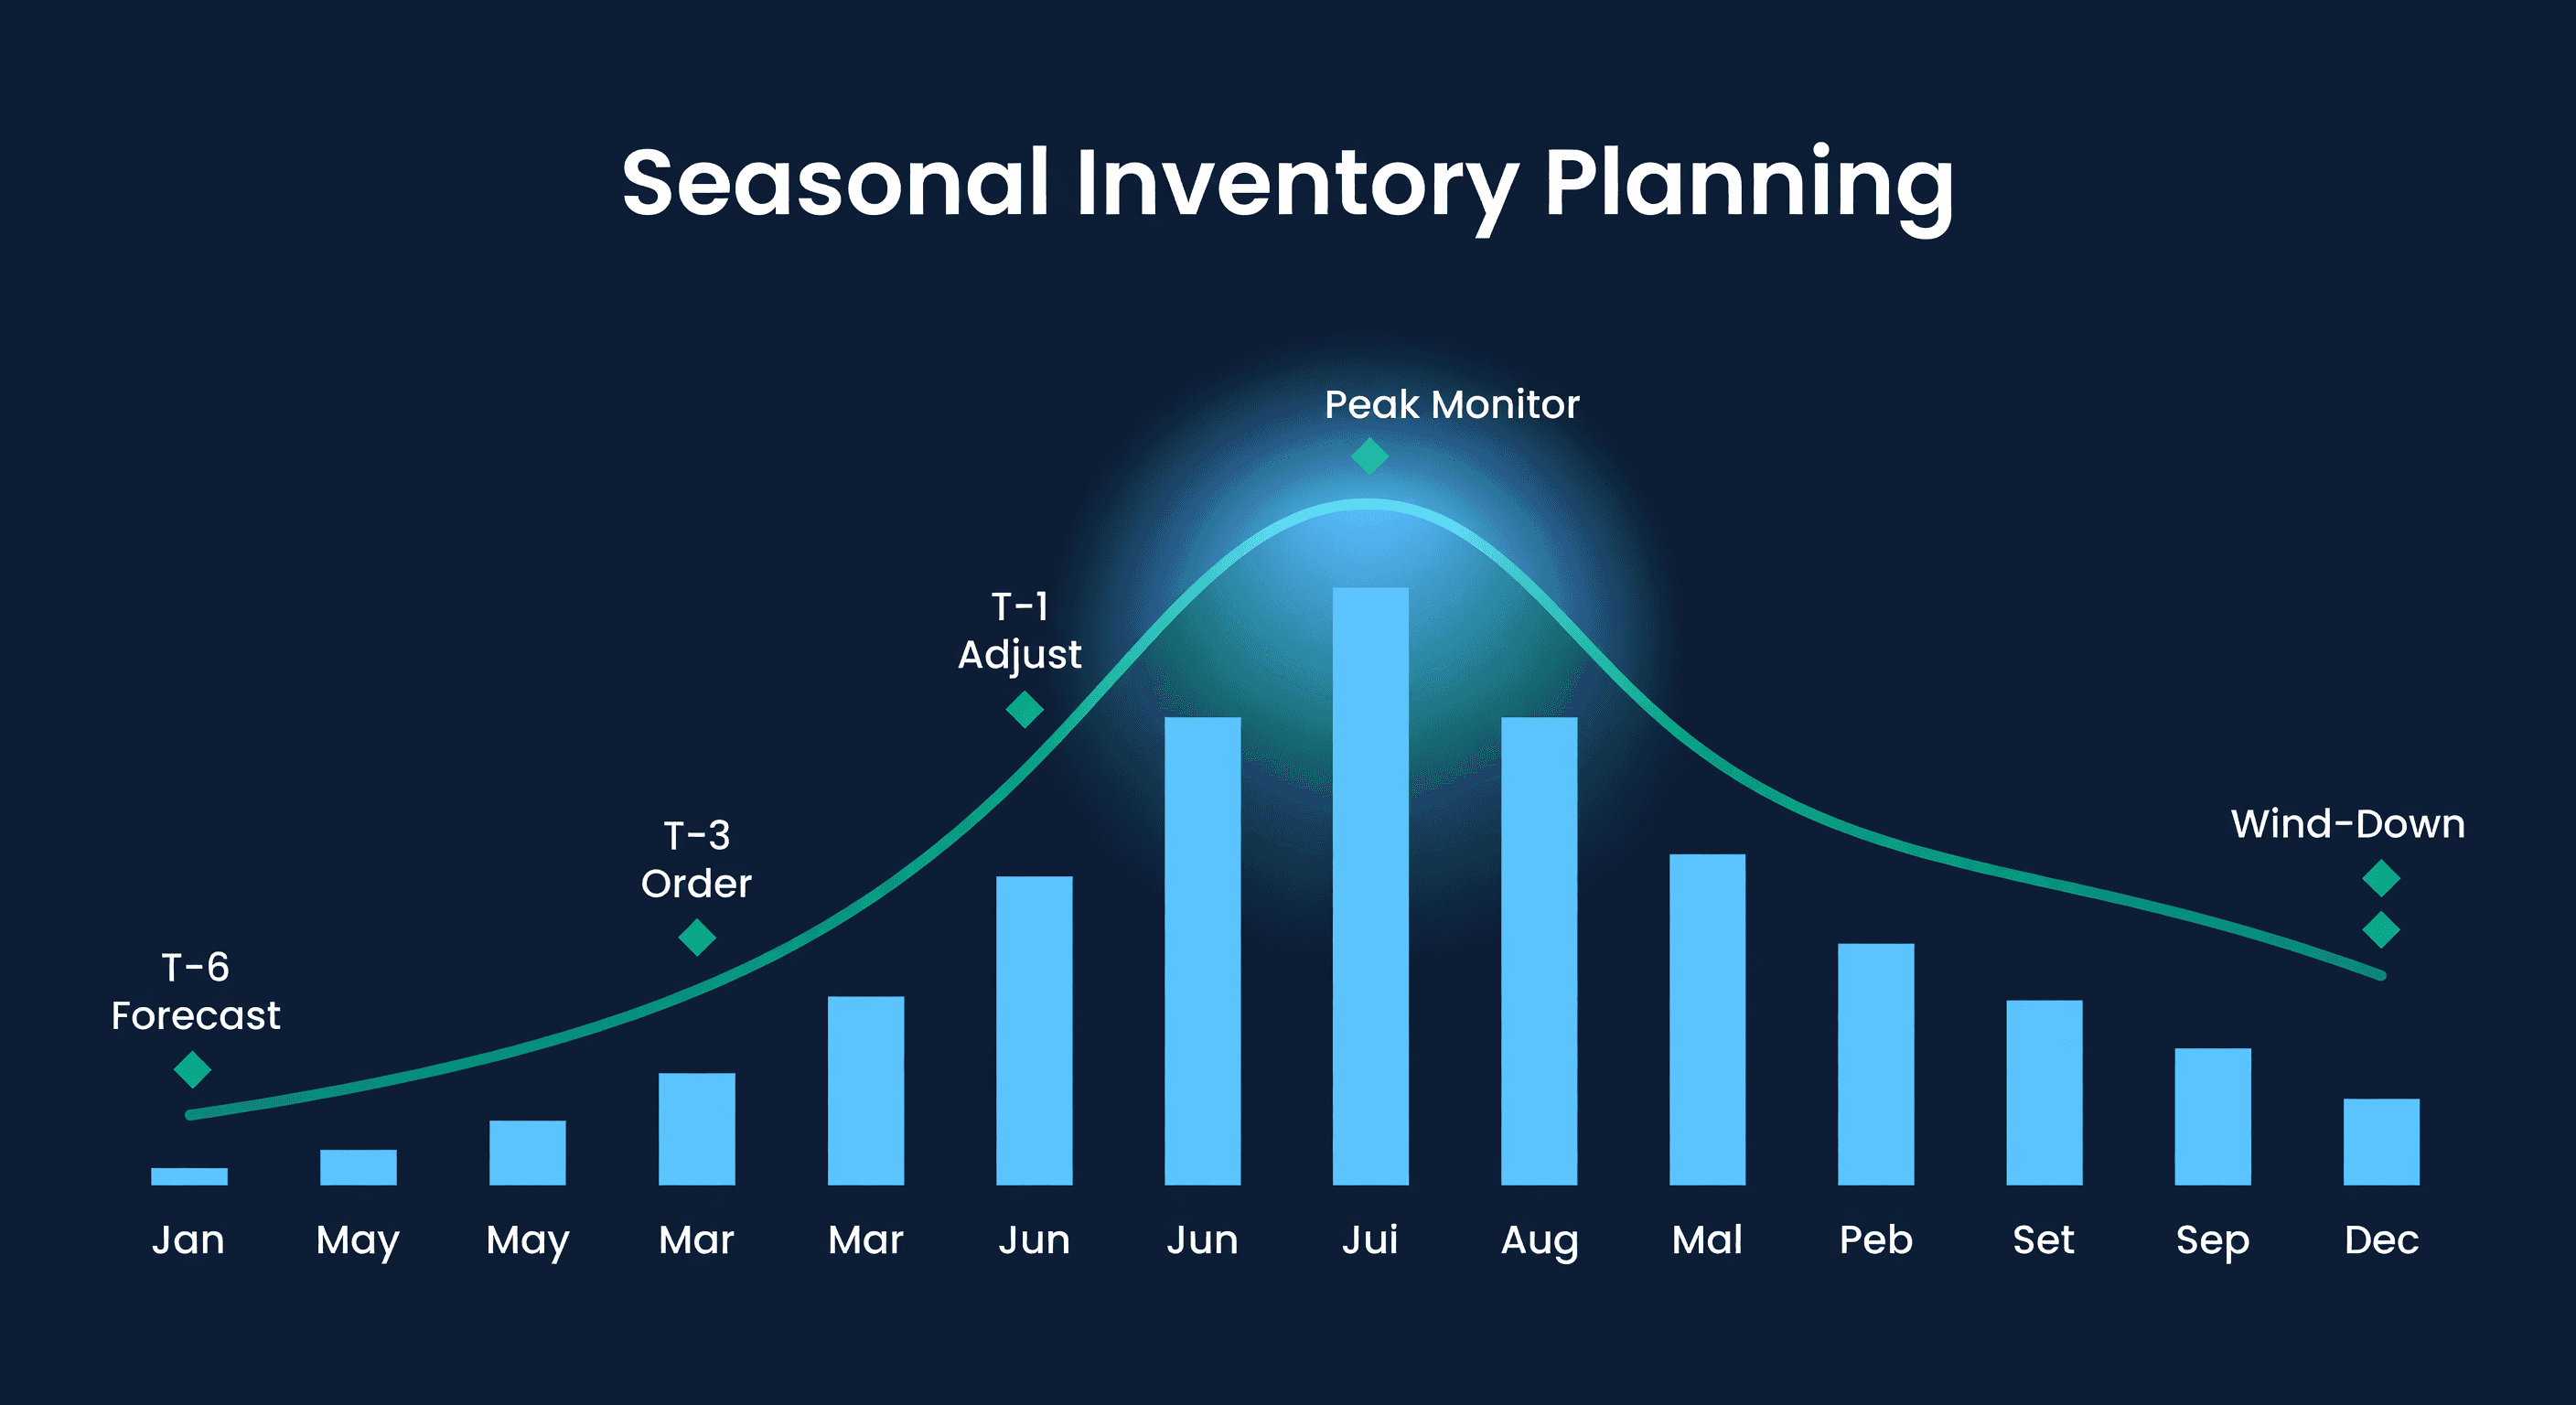
A pool supply seller does 60% of annual revenue between April and August. A holiday decor brand compresses 70% of sales into a 10-week window. Miss the peak and there is no making it up in February.
I have gotten this wrong in both directions. Ordered too conservatively one year and watched competitors sell through while I waited on a rush air freight shipment. Ordered too aggressively the next year and spent Q1 liquidating leftovers at 40 cents on the dollar. Seasonal inventory is the highest-stakes planning most e-commerce sellers do, and unlike evergreen products where a forecasting miss costs you a few days of sales, seasonal misses can define your entire year.
What Makes Seasonal Planning Hard
| Factor | Why It Hurts |
|---|---|
| Compressed selling window | You can't reorder mid-season if lead times are 30-60 days |
| Long lead times vs. short peaks | By the time you see real demand, it is too late to react |
| Uncertain demand magnitude | You know when demand comes, but not exactly how much |
| One shot per year | Unlike evergreen items, you get one chance to stock correctly |
Confirming What Is Actually Seasonal
Before you can plan, you need to confirm what is seasonal in your catalog versus what spiked once.
Step 1: Pull 24 months of sales data by SKU. You need at least two years to confirm a pattern repeats.
Step 2: Calculate each month's sales as a percentage of annual total:
SKU-A Monthly Sales:
Jan: 40  (3%)    Jul: 280 (22%)
Feb: 45  (4%)    Aug: 250 (20%)
Mar: 60  (5%)    Sep: 120 (10%)
Apr: 90  (7%)    Oct: 50  (4%)
May: 150 (12%)   Nov: 45  (4%)
Jun: 220 (17%)   Dec: 40  (3%)

Peak months (Jun-Aug): 59% of annual sales
Step 3: Apply the 3x rule. If any month exceeds 3x the average monthly sales, that SKU has meaningful seasonality. July at 280 units is 5.4x the monthly average of 116.
Step 4: Confirm the pattern repeats in Year 2. Same peak months both years = seasonal. Spike happened once = possibly a one-time trend.
Seasonal vs. Trending Products
This distinction matters because they require completely different strategies:
| Signal | Seasonal | Trending |
|---|---|---|
| Timing | Same months each year | Random, often sudden |
| Duration | Predictable (weeks/months) | Unpredictable |
| Historical pattern | Repeats 2+ years | First occurrence |
| External driver | Weather, holidays, school year | Social media, news, culture |
| Planning approach | Forecast from history | React fast, order conservatively |
Sunscreen sales spiking every May is seasonal. A specific brand spiking from a celebrity post is trending. For trending products, order conservatively and use air freight to chase demand. For seasonal products, commit to a forecast and execute the plan below.
The 6-Month Seasonal Planning Timeline
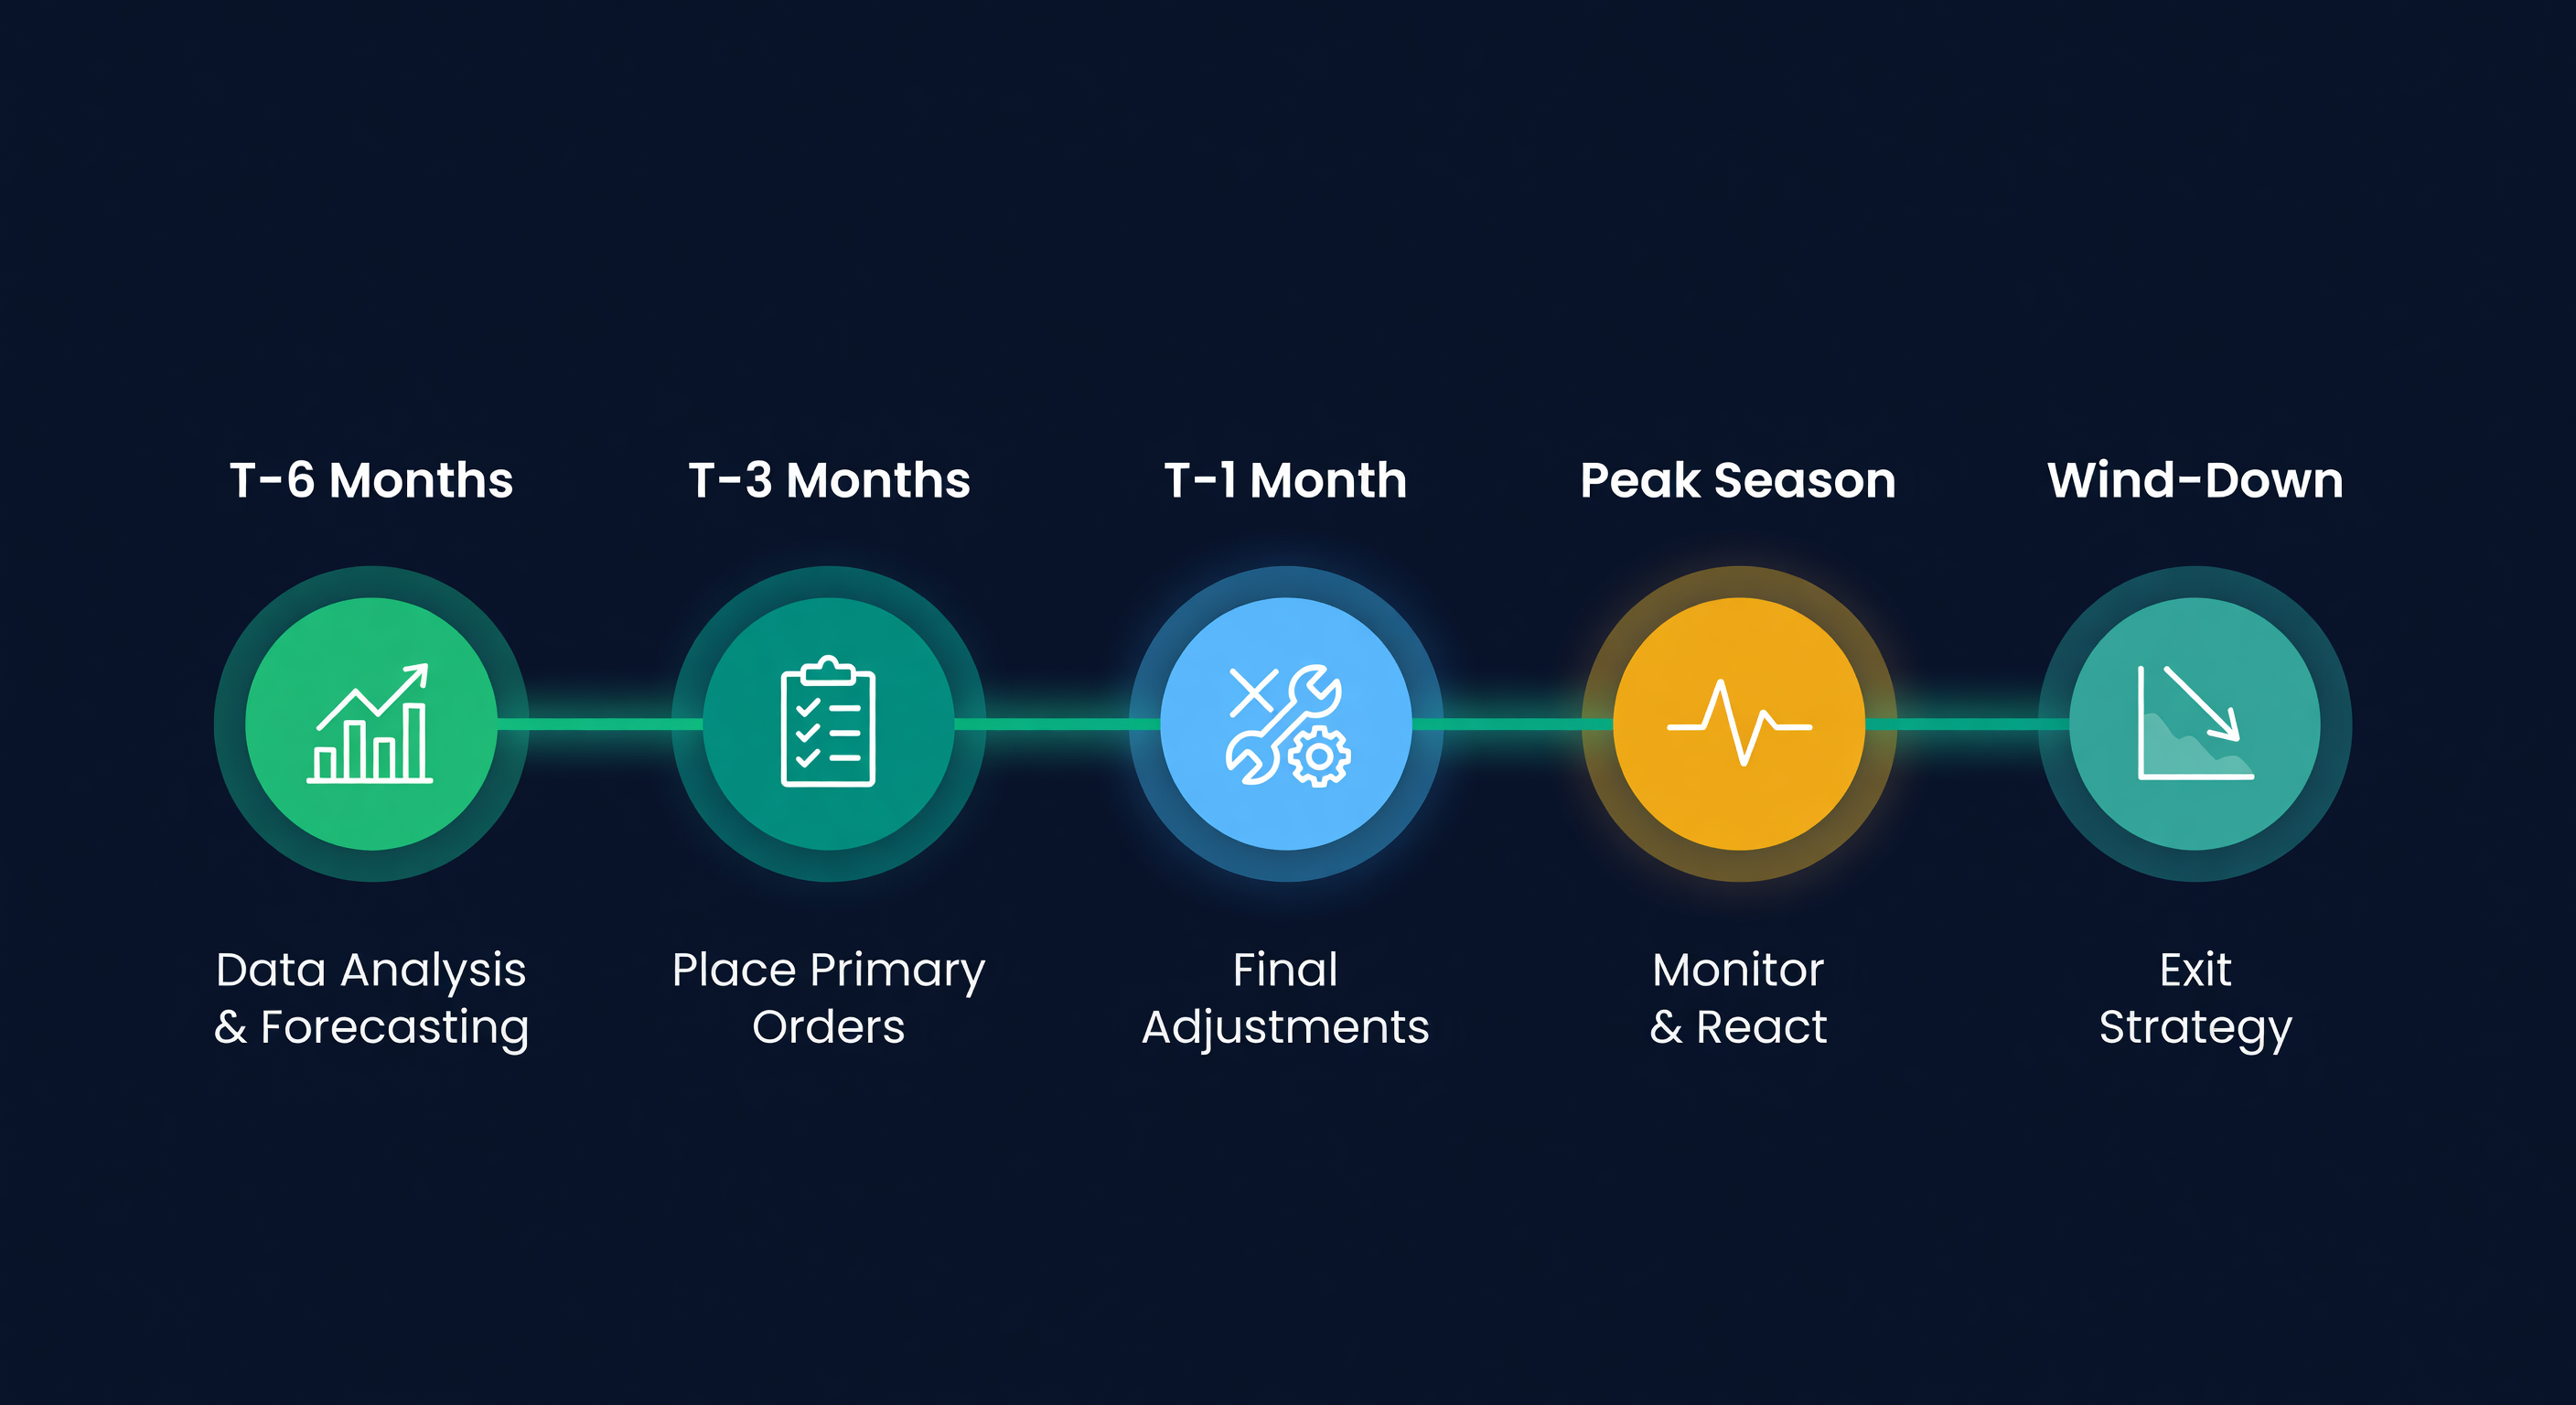
T-6 Months: Data Analysis and Forecasting
Pull last 2-3 years of seasonal sales data. Calculate peak-to-trough ratios by SKU. Build your initial demand forecast.
Last year's peak sales: 1,200 units
YoY growth rate: 15%
This year's forecast: 1,200 x 1.15 = 1,380 units
With 15% safety buffer: 1,380 x 1.15 = 1,587 units
Round to supplier MOQ: 1,600 units
T-3 Months: Place Primary Orders
Finalize forecast with any new market data. Place orders with overseas suppliers (45-60 day lead times). Confirm supplier capacity and delivery dates. This is the commitment point - after this, you are mostly locked in.
Units needed for season: 1,600
Current inventory: 200
Order quantity: 1,400 units
T-1 Month: Final Adjustments
Check early-season demand signals. Place domestic rush orders if forecast looks low. Verify FBA shipment timelines if selling on Amazon.
Peak Season: Monitor and React
Track daily sell-through vs. forecast. Identify fast movers that may need air freight replenishment. Reallocate inventory between channels if needed. Begin markdown planning for items selling below forecast.
Wind-Down: The Part Most Sellers Skip
This is where I see the most money wasted. You need an exit strategy before the season starts, not after it ends. Reduce prices on remaining seasonal inventory. Bundle slow movers with popular items. Transfer to secondary channels or liquidation partners. And - this matters for next year - calculate actual vs. forecast so your data gets better.
Safety Stock for Seasonal Products
Seasonal items need a different safety stock approach than evergreen products. Ramp up before the peak. Draw down deliberately as the season ends.
| Period | Safety Stock Level | Rationale |
|---|---|---|
| Pre-season (2 months out) | Building to 3-4 weeks | Stock arriving, demand still low |
| Early peak | 3-4 weeks | Demand ramping, can't reorder fast |
| Mid peak | 2-3 weeks | Selling fast, monitoring closely |
| Late peak | 1-2 weeks | Winding down, avoiding overstock |
| Off-season | 1 week or zero | Minimal demand, minimize holding costs |
Peak daily sales: 50 units/day
Safety stock at 3 weeks: 50 x 21 = 1,050 units
Safety stock at 1 week (late peak): 50 x 7 = 350 units
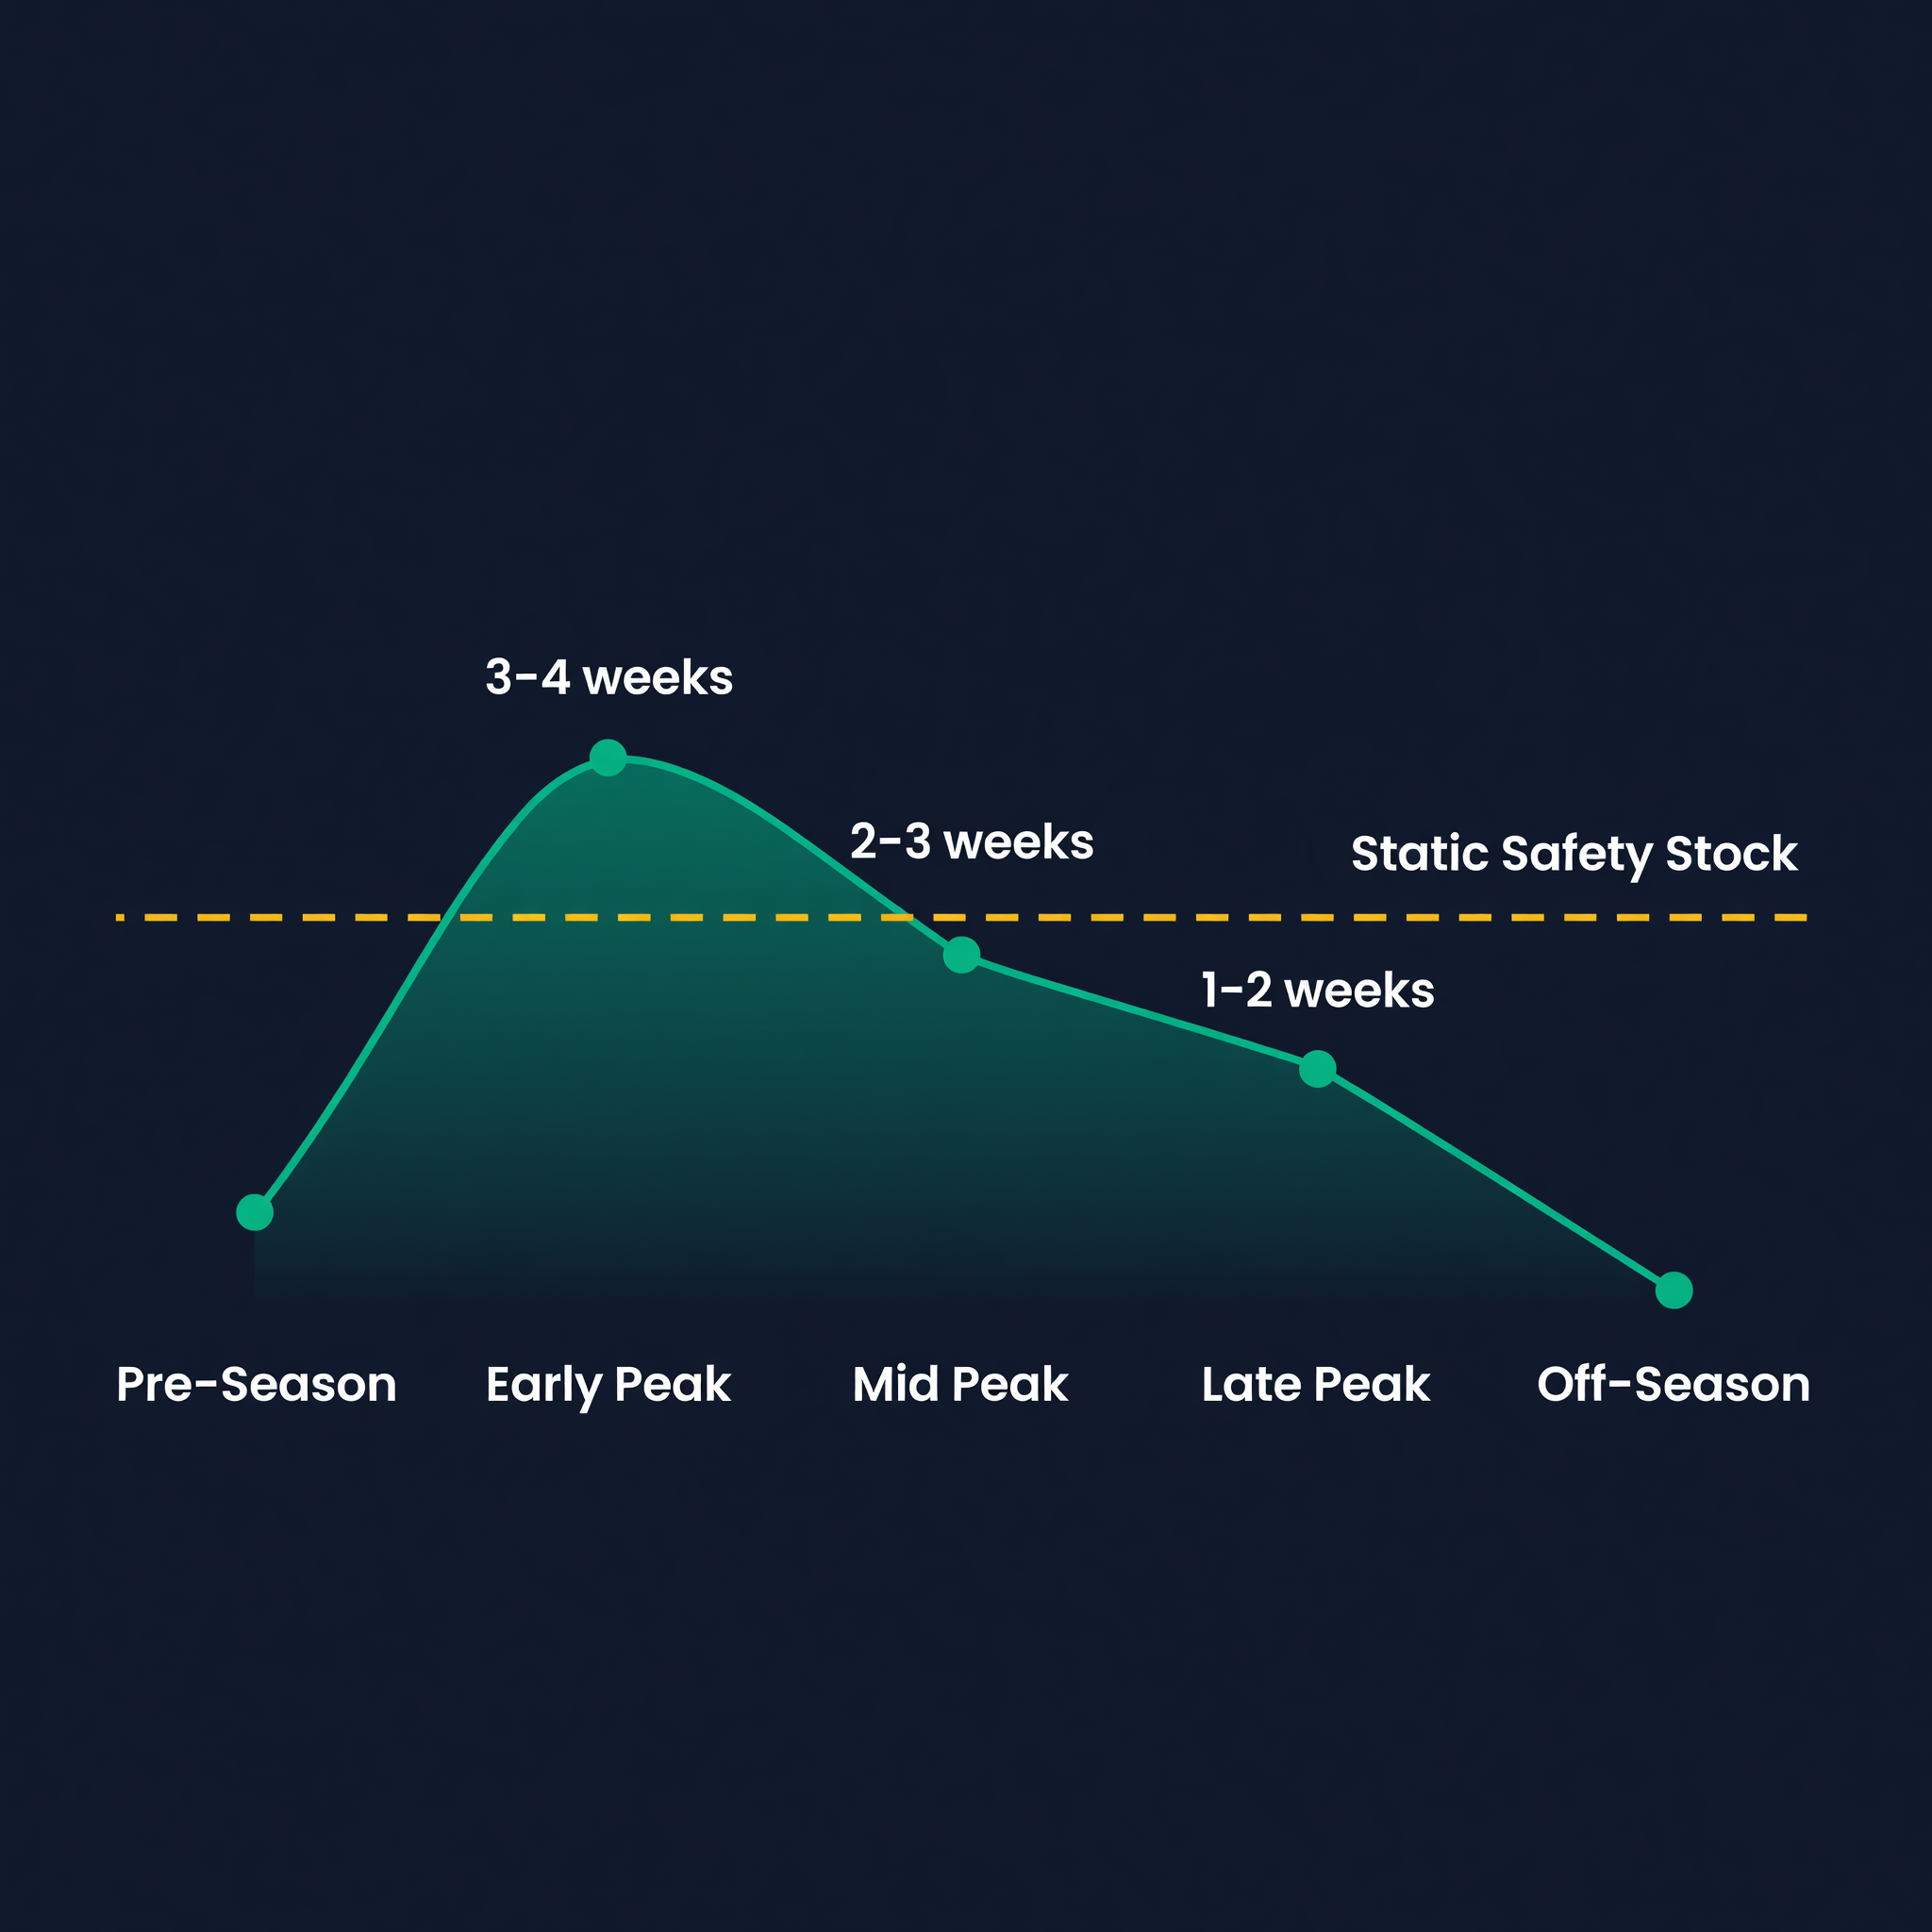
The difference of 700 units represents real money in carrying costs and dead stock risk.
Common Seasonal Planning Mistakes
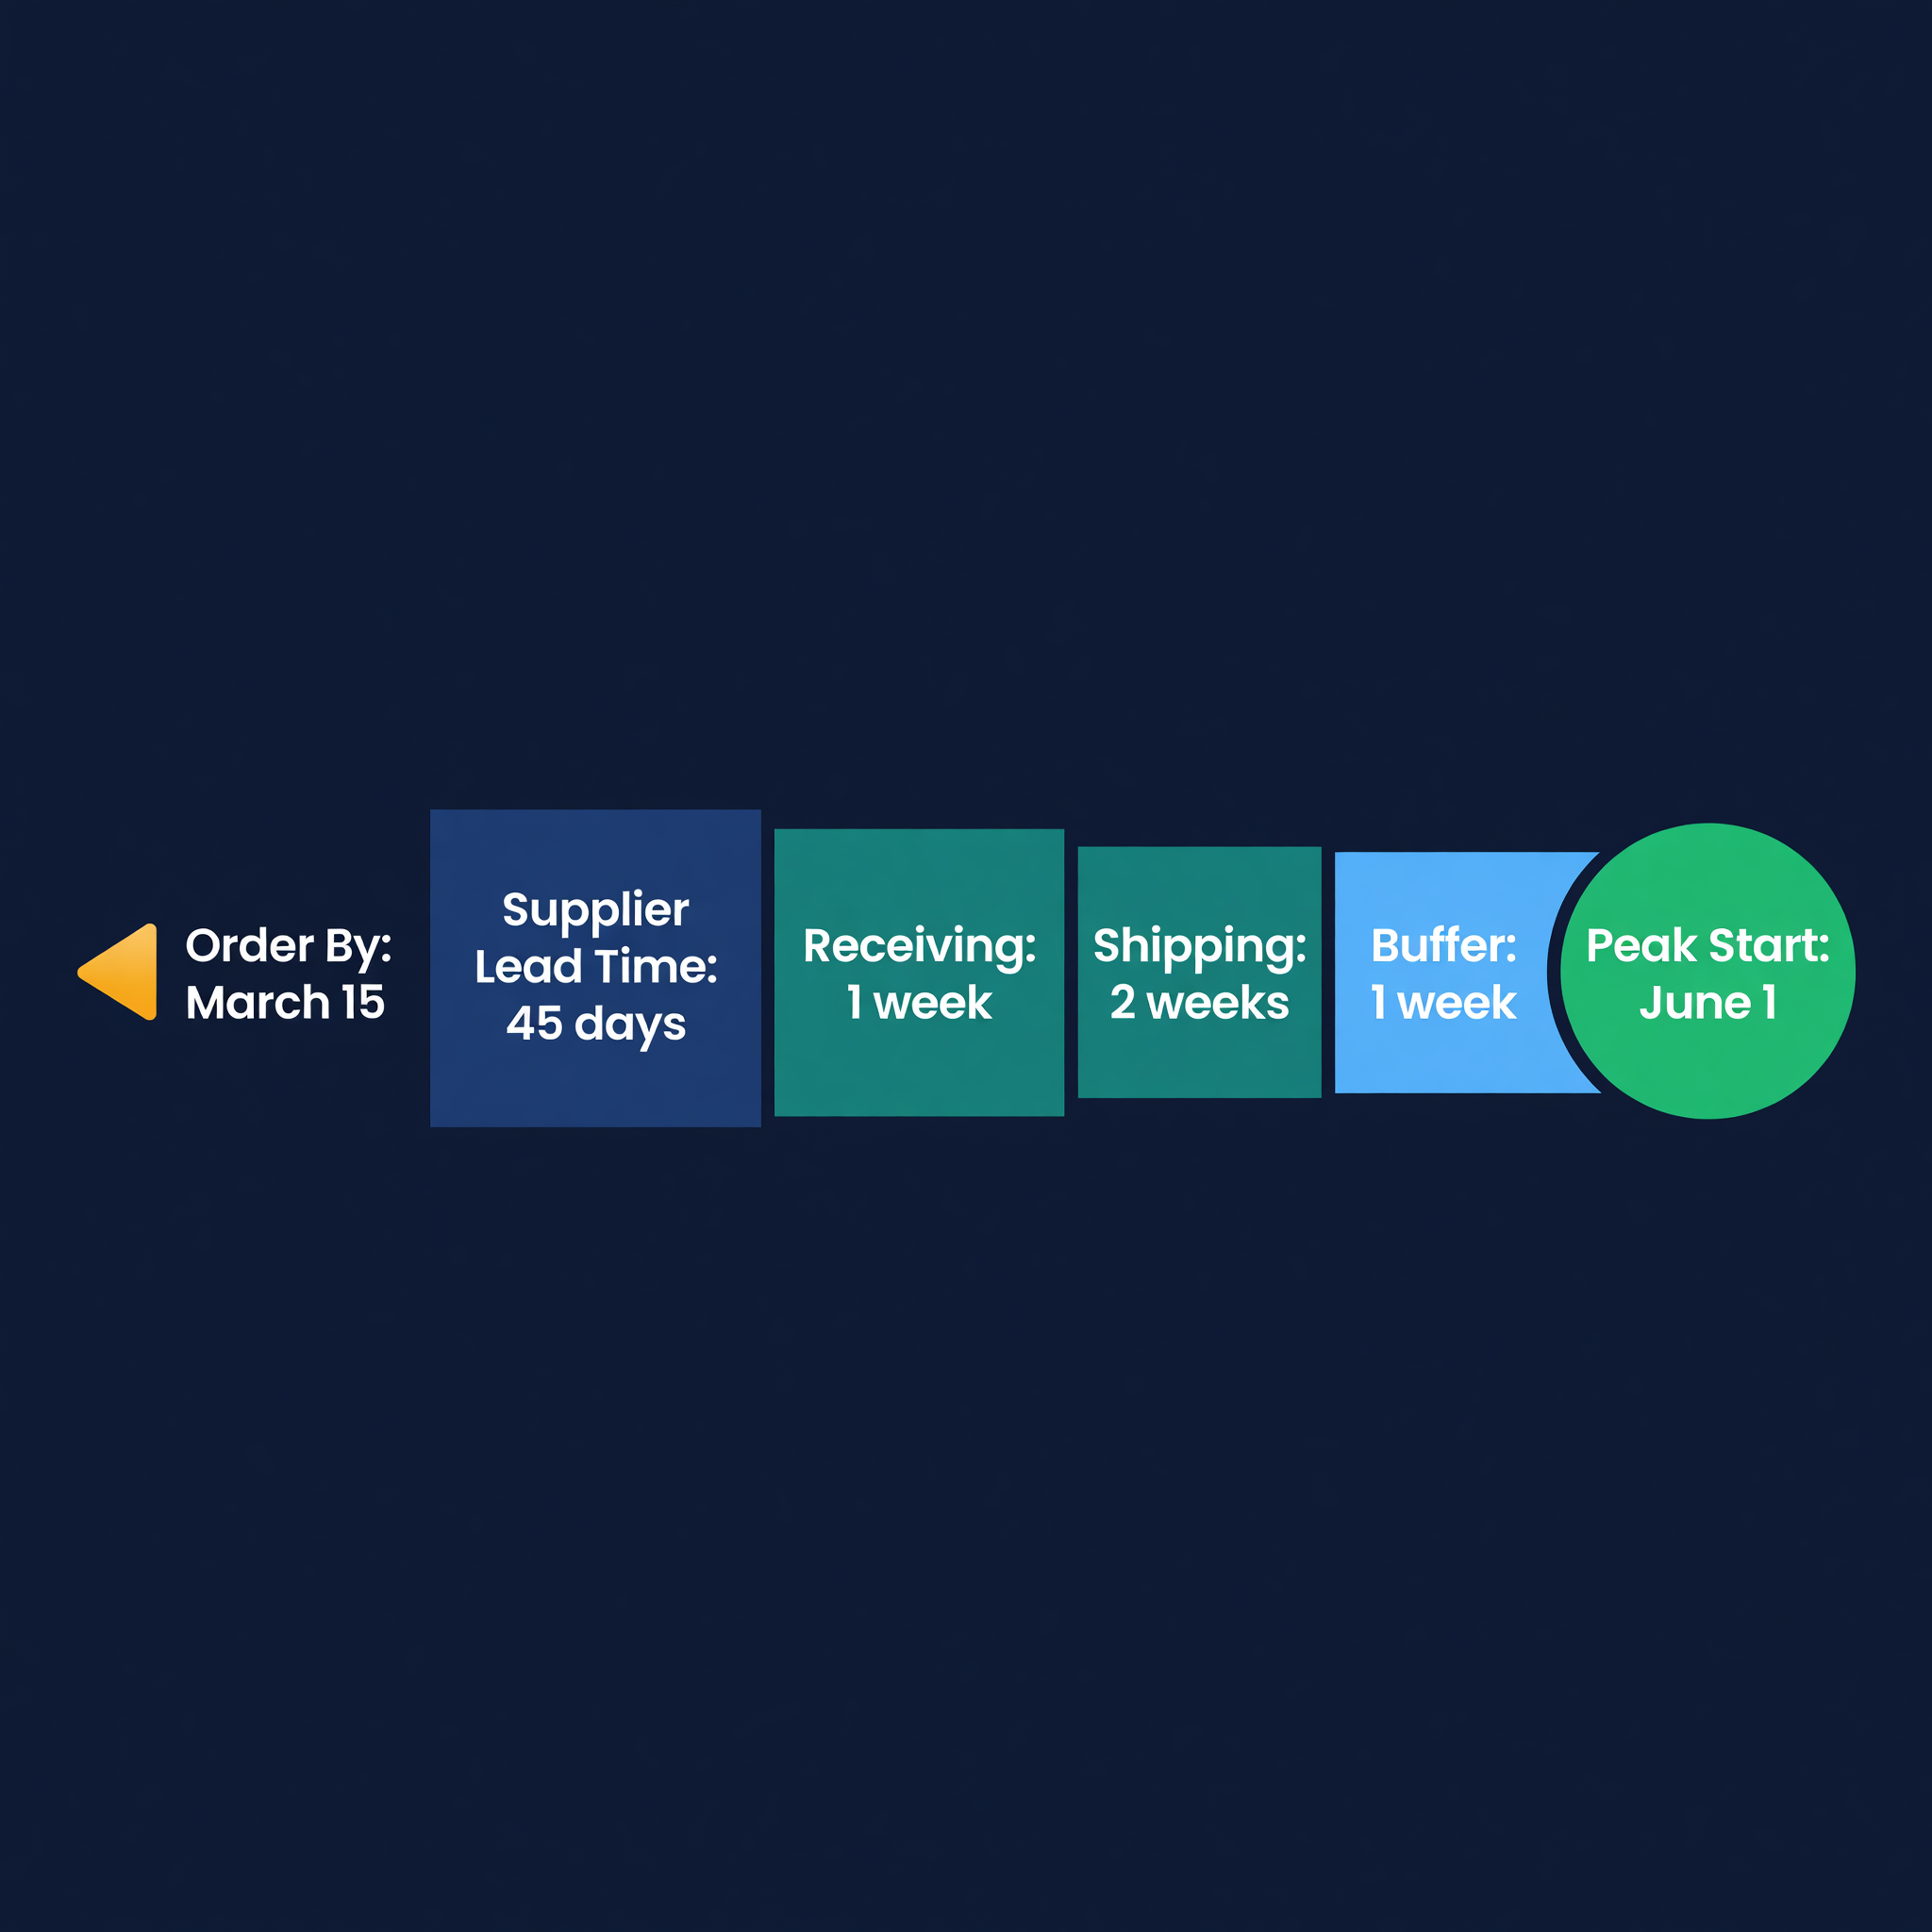
Ordering too late. If your supplier needs 45 days and your peak starts June 1, ordering May 1 means stock arrives mid-July. Work backward from your peak start date: supplier lead time + shipping + receiving + buffer.
No exit strategy. Planning how much to buy without planning how to sell leftovers is half a plan. Before placing your order, define markdowns at 4 weeks post-peak, liquidation at 8 weeks, and the maximum loss you will accept.
Ignoring liquidation costs. That $15 product marked down to $8 does not just lose $7 in revenue. Factor in storage costs, tied-up capital, and markdown labor. If projected markdowns make the season unprofitable, reduce your order.
Treating every year the same. A product that sold 2,000 units last summer might face new competitors or economic headwinds this year. Use historical data as a baseline, not a guarantee.
Not tracking weekly during peak. These three metrics, checked weekly, will tell you if you are on track:
| Metric | Target | Action if Off-Track |
|---|---|---|
| Sell-through rate | 80%+ by season end | Markdown or reallocate |
| Days of supply | Matches remaining season length | Adjust orders or pricing |
| Gross margin after markdowns | Above 25% | Reduce next year's order |
Forecasting with Seasonality Built In
We built ReplenishRadar's forecasting engine to detect seasonality patterns automatically from your Shopify and Amazon sales history. At T-6 months, you see forecasted seasonal demand for each SKU based on 2-3 years of data. At T-3 months, the system generates purchase order recommendations sized for the peak. During the season, daily monitoring flags SKUs selling faster or slower than expected so you can react while it still matters - not after the season closes.
The safety stock recommendations ramp up before peaks and draw down afterward, which is the part that is hardest to replicate in a spreadsheet. A static safety stock calculation either leaves you exposed during the ramp or overstocked during the wind-down. The dynamic version costs less and protects better.
If you sell seasonal products and still plan from gut feel and last year's spreadsheet, you are gambling with your biggest revenue months. Try ReplenishRadar free for 14 days ->
Related Reading:
Frequently Asked Questions
Get notified when it matters
Amazon and Shopify change the rules constantly. We'll email you when something affects your business.
See what your inventory is really doing
Doing $5M+ in revenue? Talk to our team
Related Posts
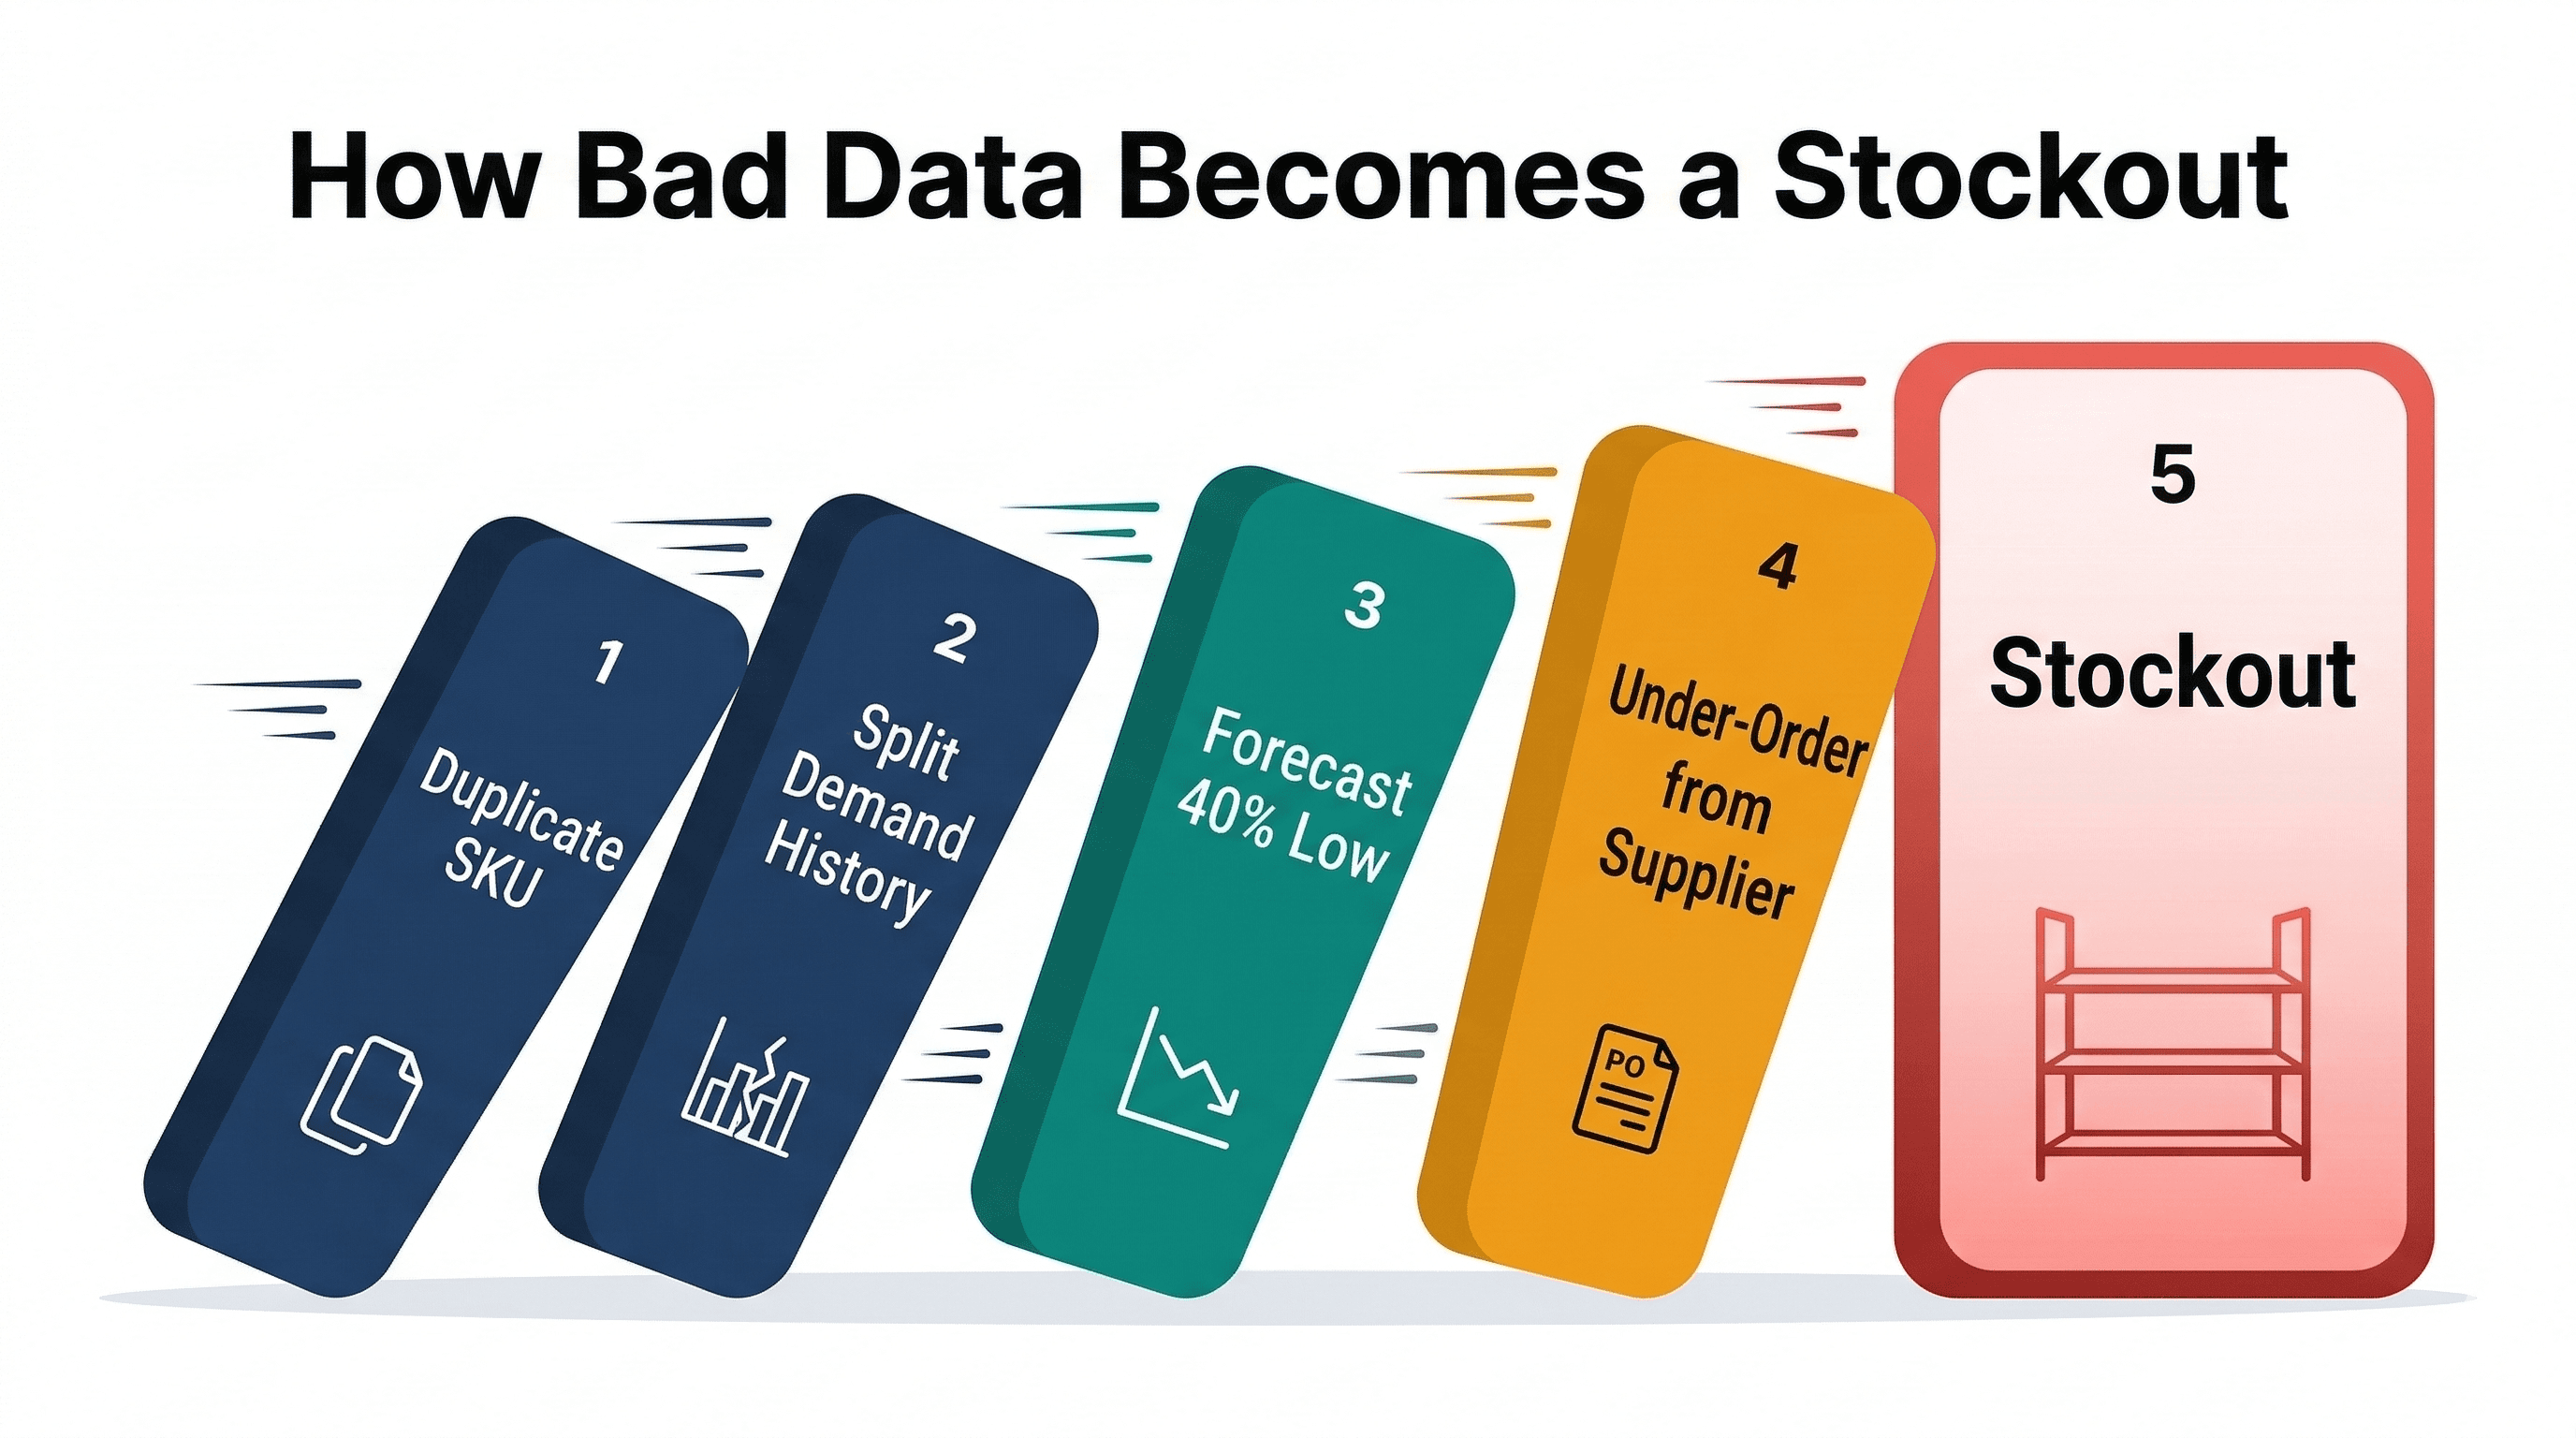
Your Inventory Data Is Wrong
How bad SKU data (duplicates, missing costs, unmatched listings, missing demand) breaks inventory forecasting and costs real money.
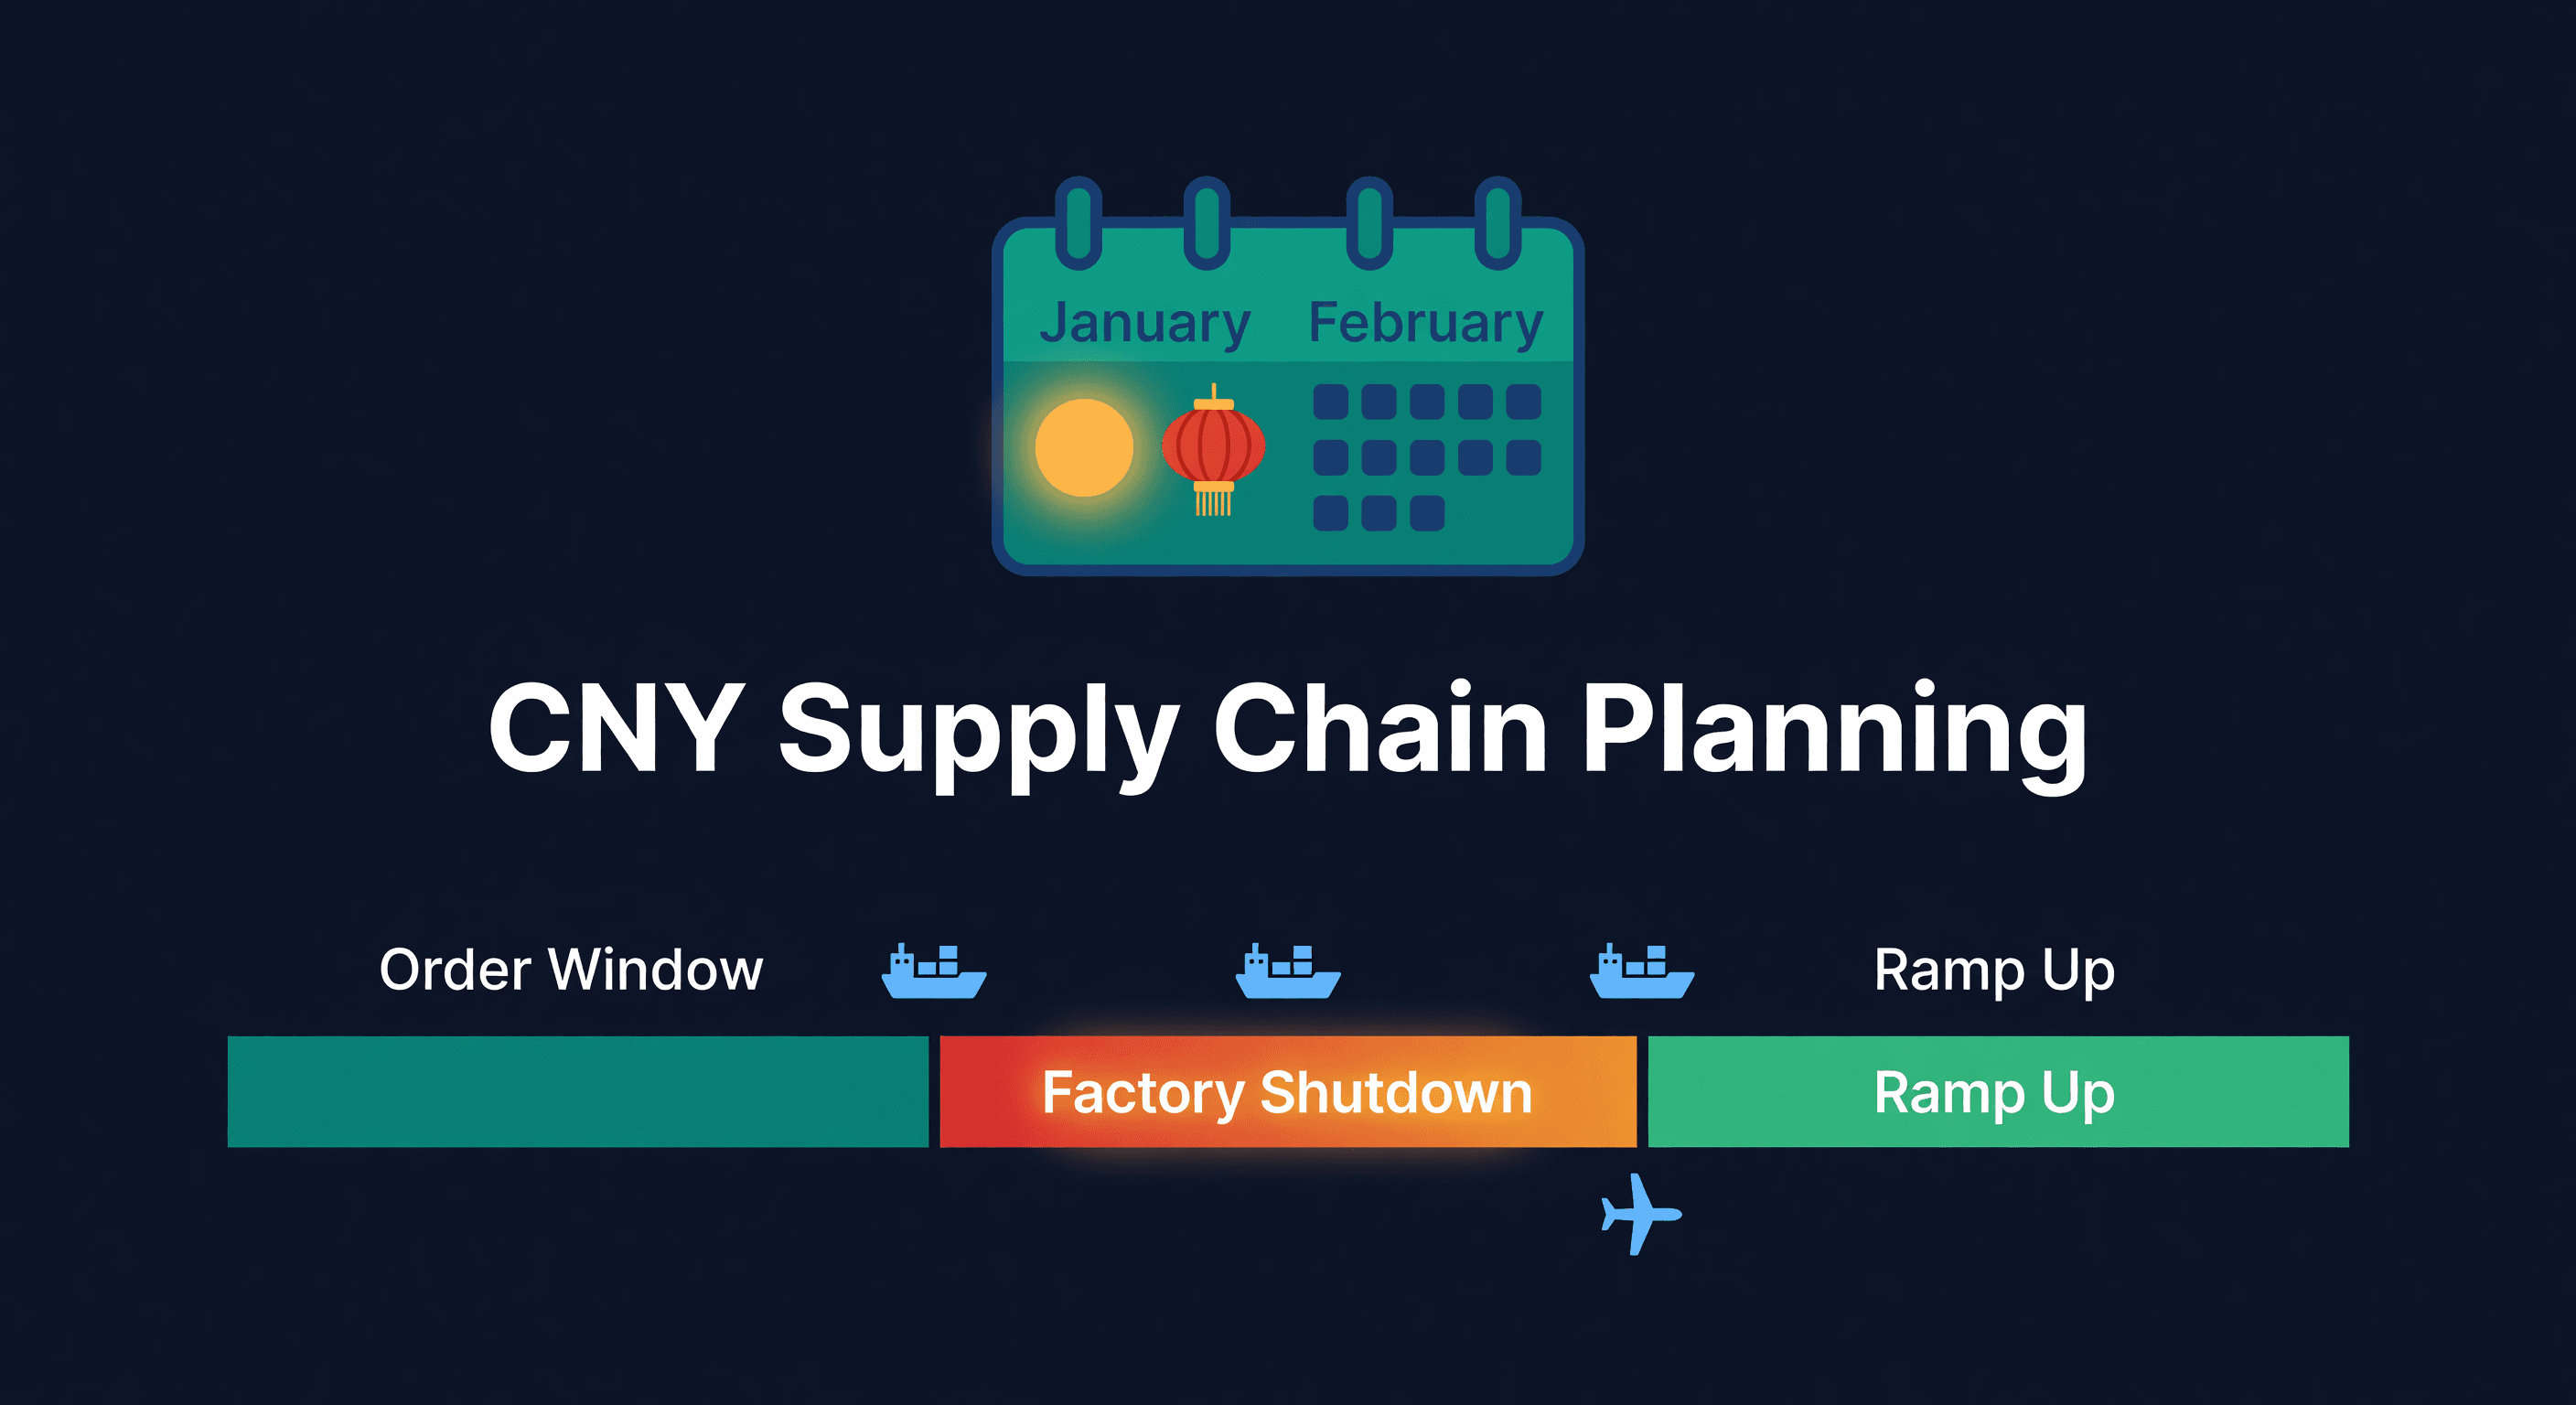
Chinese New Year Supply Chain Planning Guide
How to plan inventory around Chinese New Year factory shutdowns. Timelines, buffer calculations, and the mistakes that leave sellers out of stock for 6 weeks.
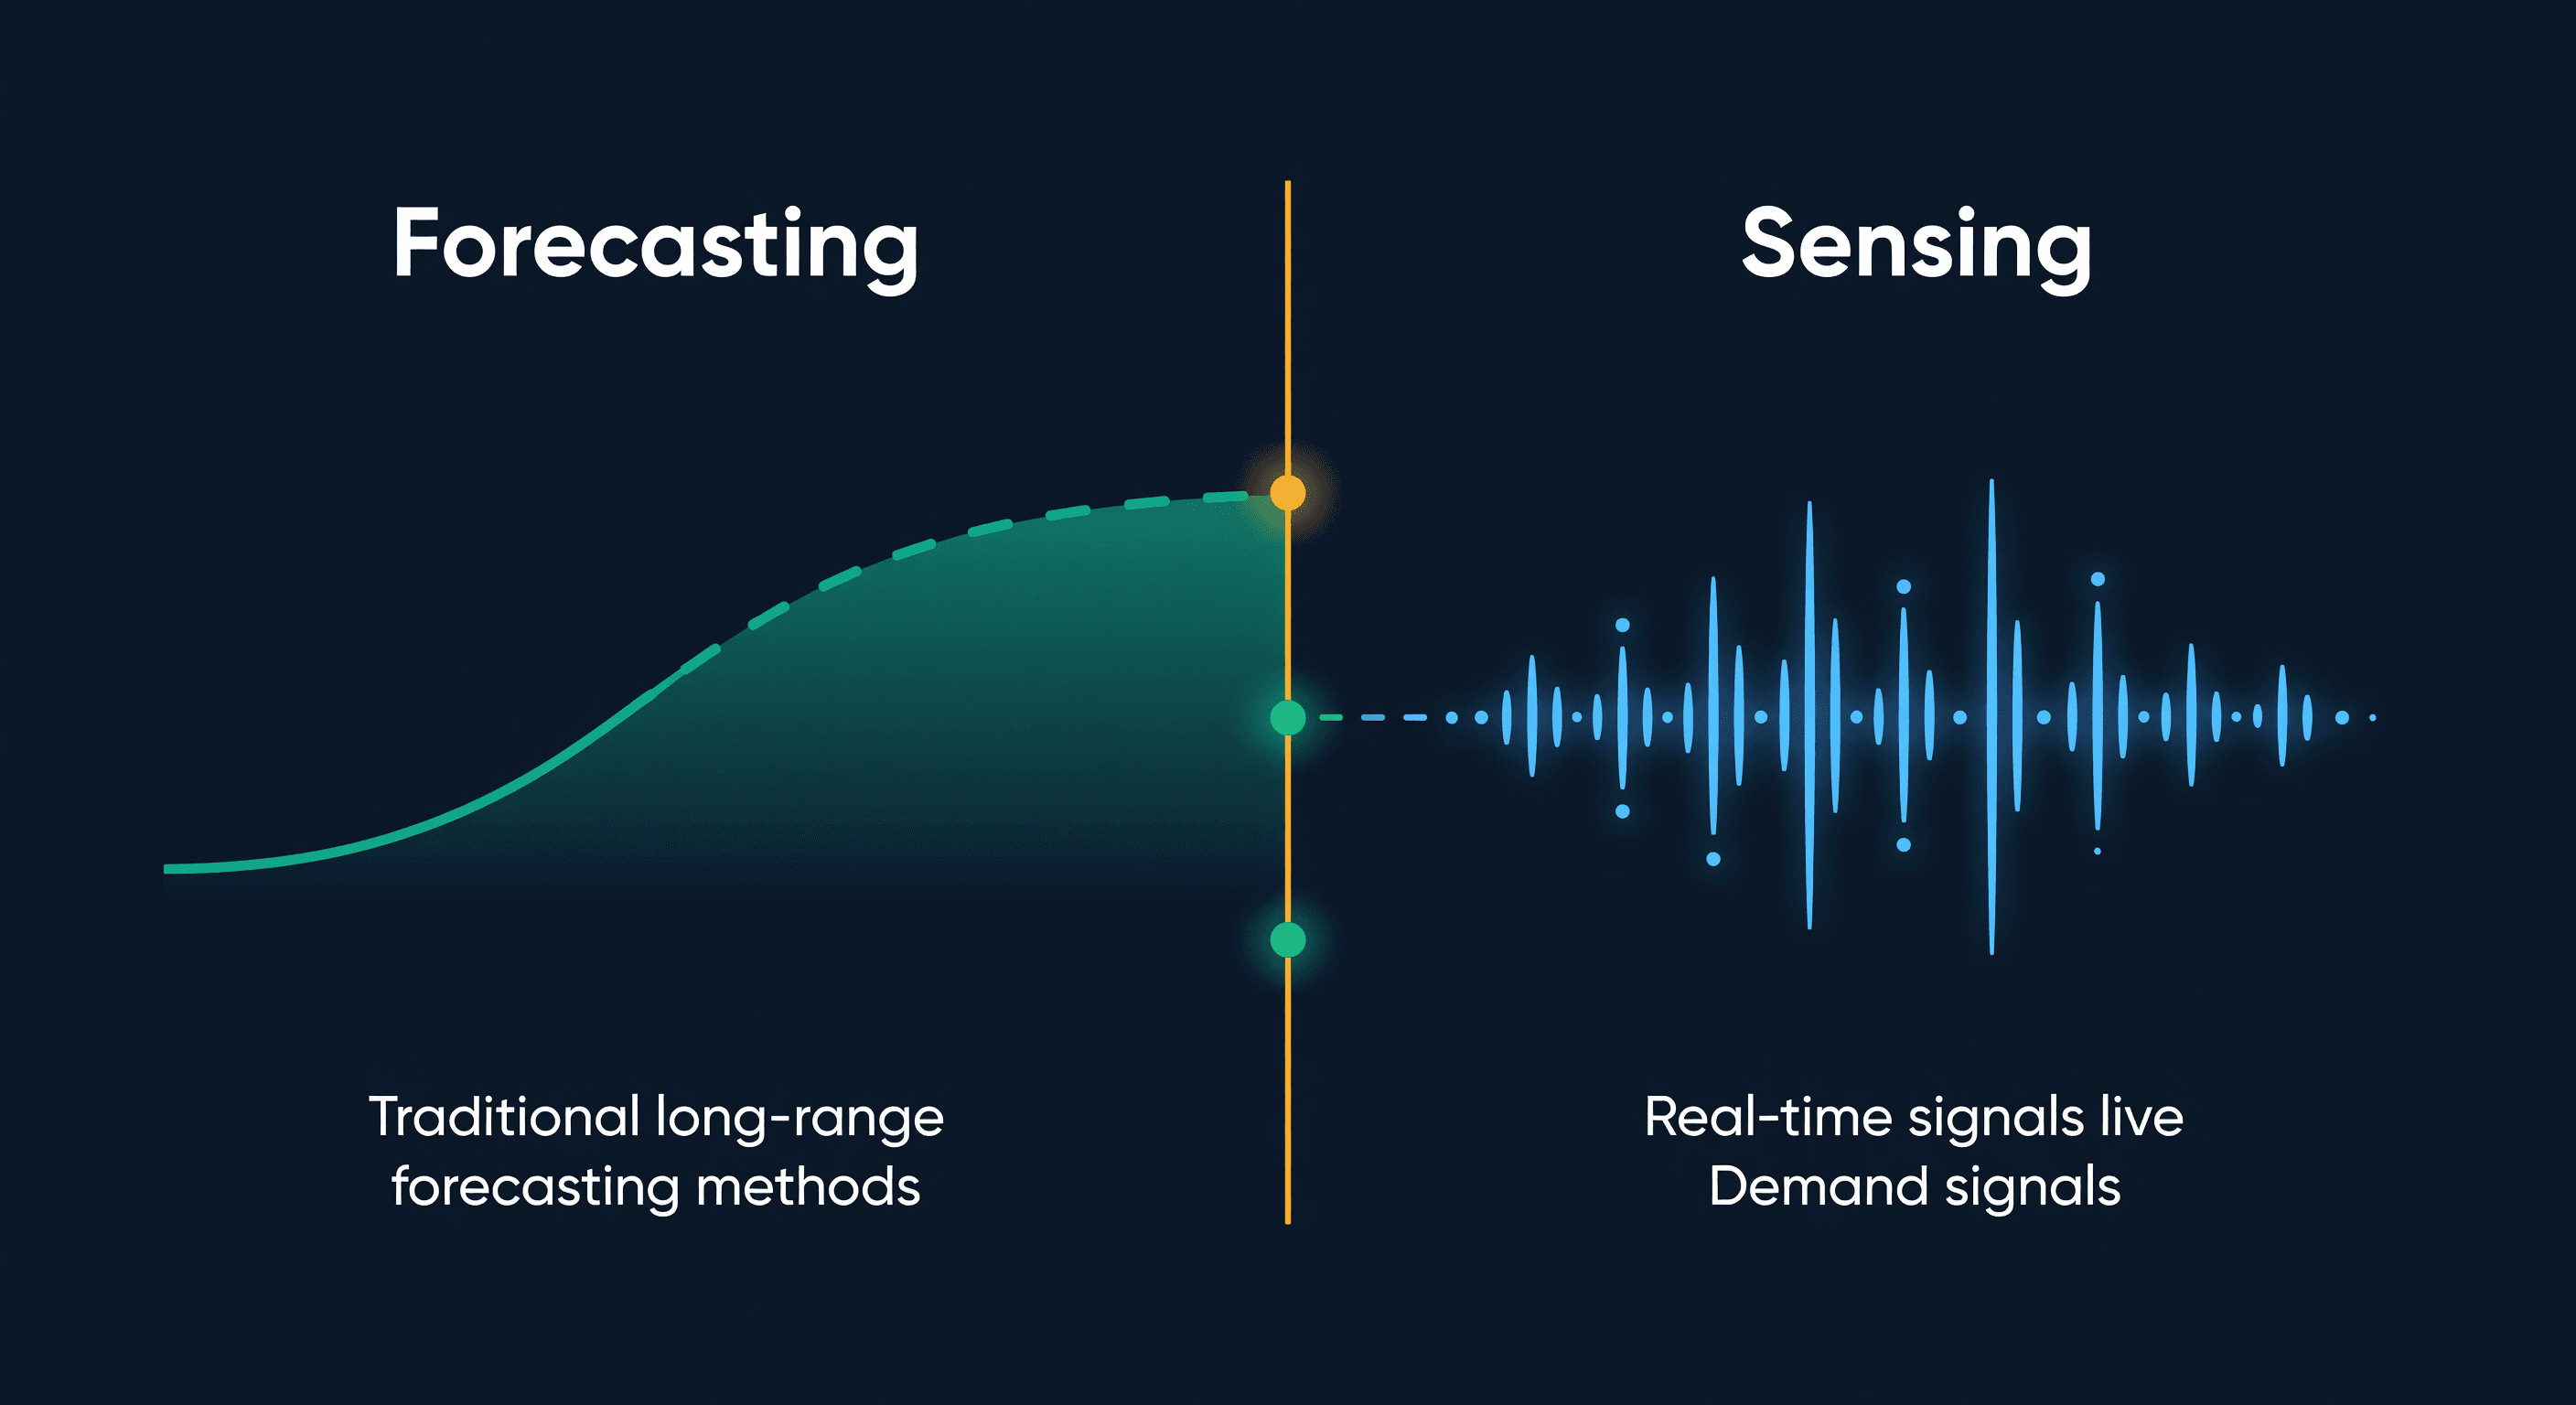
Demand Sensing vs Forecasting for E-commerce
What demand sensing actually is, how it differs from forecasting, why most e-commerce sellers only need one of them, and the practical middle ground.
