7 Inventory Mistakes That Kill Cash Flow
Key takeaway: The seven biggest inventory cash drains: over-ordering safety stock, ignoring slow movers, poor multi-channel coordination, no demand forecasting, wrong reorder points, overstocking seasonal items, and not tracking inventory KPIs.
I have wasted more money on bad inventory decisions than I care to admit. Not from catastrophic failures - from slow, invisible mistakes that bled cash for months before I noticed. These are the seven that cost the most.
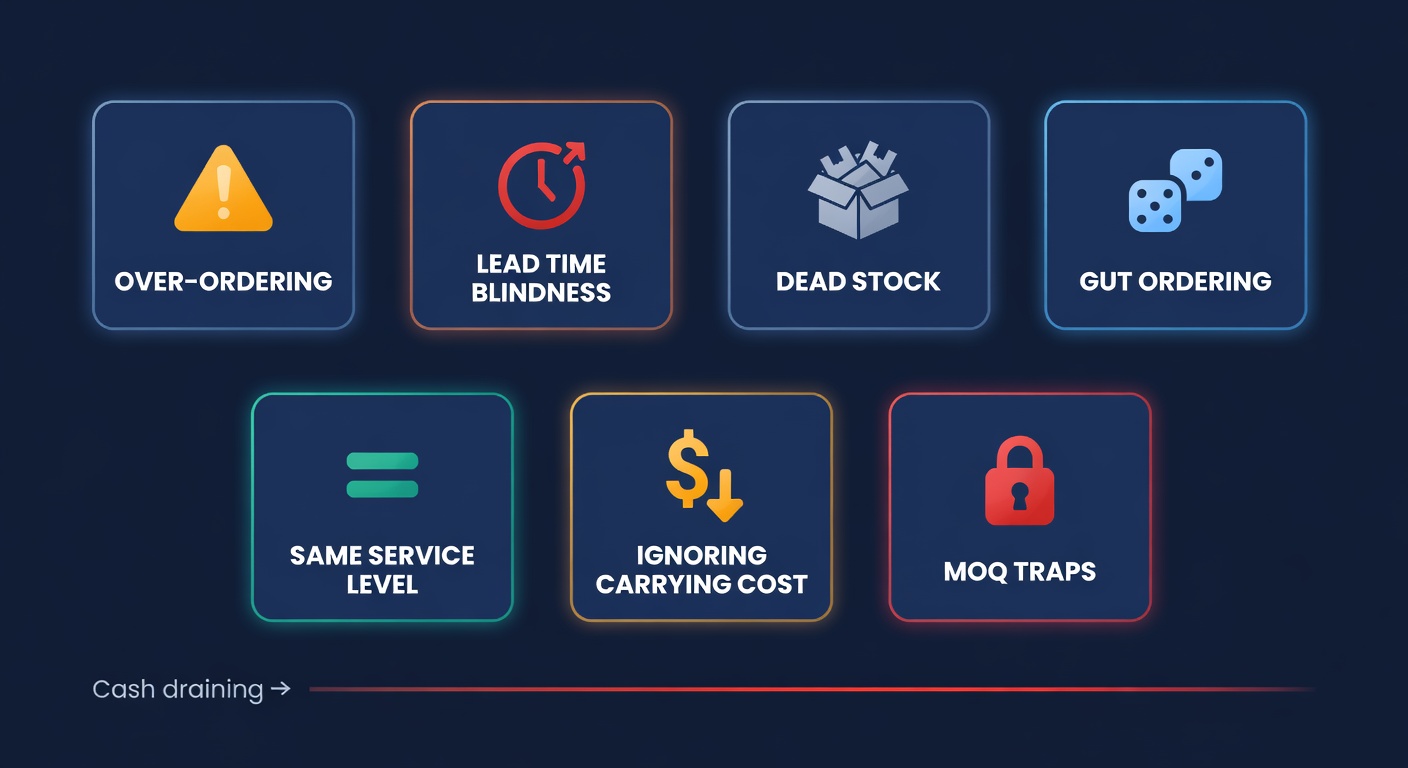
1. Over-ordering "just in case"
This is the most natural mistake in inventory management. Demand feels unpredictable, stockouts are terrifying, so you pad every order by 20-30% "for safety."
The problem is math. Carrying costs run 20-30% of inventory value per year. That includes warehousing, insurance, depreciation, capital cost, and shrinkage. On a $50 product, you are paying $10-$15 annually just to hold each unit.
Here is what that looks like at scale:
| Monthly units sold | "Just in case" buffer (25%) | Extra units/year | Carrying cost @ 25% on $50 item |
|---|---|---|---|
| 200 | 50 | 600 | $7,500 |
| 500 | 125 | 1,500 | $18,750 |
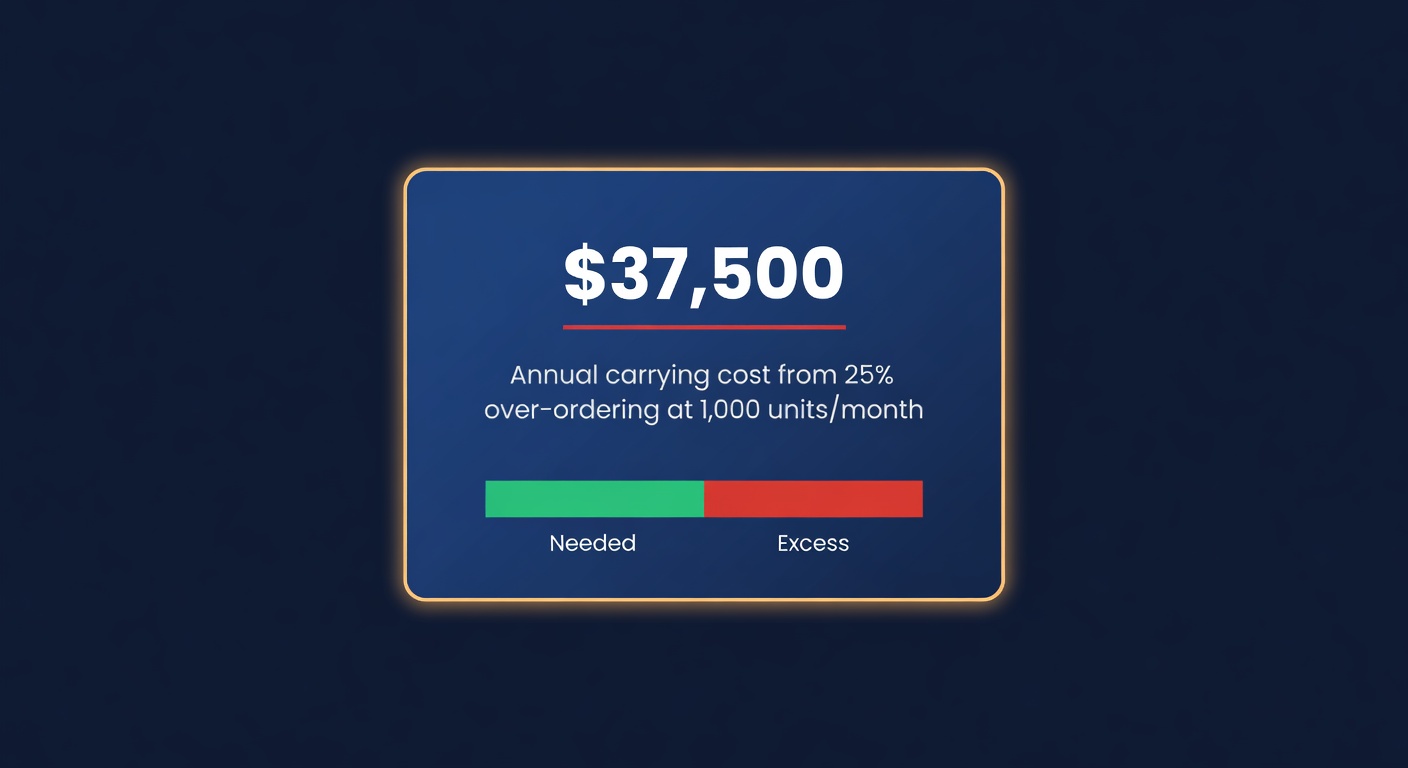
| 1,000 | 250 | 3,000 | $37,500 |
A seller doing 1,000 units/month who pads by 25% is burning $37,500 per year in unnecessary carrying costs. That is not safety. That is a cash flow leak disguised as prudence.
The fix: Calculate safety stock using actual demand variability and lead time data. Safety stock has a formula. "Just in case" does not.
2. Ignoring lead time variability
Most sellers enter a lead time once - the number their supplier quoted - and never update it. The supplier said 21 days, so 21 days it is. Forever.
Except it is not 21 days. Not really. It is 16 days sometimes and 31 days other times, depending on the season, their production backlog, and shipping conditions. That spread matters enormously for your reorder point. If you plan for 21 days and your supplier takes 28, you stock out for a week. If they take 16, you are sitting on extra inventory for 5 days. Neither is free.
I tracked one supplier's actual delivery times over a year. Here is what I found:
| Metric | Quoted | Actual |
|---|---|---|
| Average lead time | 21 days | 23 days |
| Shortest delivery | - | 16 days |
| Longest delivery | - | 34 days |
| Standard deviation | - | 6 days |
My reorder point calculated at "21 days" was wrong by enough to cause three stockouts in 12 months. Each stockout cost roughly $4,000 in lost sales and rank recovery on Amazon. That is $12,000 in a year because I trusted a quoted number instead of measuring the real one.
The fix: Track actual lead times from PO dates. Use the mean, not the quote. Factor the standard deviation into your safety stock. If you cannot stomach the math, at least add the standard deviation to your quoted lead time as a buffer.
3. Not tracking dead stock
Dead stock does not announce itself. It sits in your warehouse, taking up space, costing you money, looking like a normal line item on your inventory report. Nobody panics about 47 units of a product that sold great two years ago.
Dead stock typically represents 20-30% of SKUs for the average e-commerce seller. Those SKUs generate less than 5% of total revenue. But they consume warehouse space, tie up capital, and - if you are using FBA - rack up storage fees every month.
The real cost is not the storage fee. It is the opportunity cost. That $15,000 in dead inventory could be $15,000 of your best-seller. At a 4x annual turnover rate, that is $60,000 in revenue you are not generating.
The fix: Run a dead stock report every 90 days. Anything with fewer than 5 units sold in the last 90 days and more than 30 days of supply gets flagged. Liquidate, bundle, discount, or donate. Holding it is not a strategy.
4. Ordering by gut instead of data
This one is personal. I spent two years ordering based on "feel" - a quick glance at what sold last month, a rough guess at what would sell next month, and a prayer. My average forecast error was north of 40%. I did not know that at the time, of course. I only measured it later, retroactively, and the number made me wince.
A 40% forecast error on a product with $10 cost and 200 units/month means you are routinely ordering 80 units too many or too few. Over-order and you are holding $800 in excess for months. Under-order and you stock out, losing the revenue and paying to recover your search ranking.
The compounding effect is what kills you. One month you over-order. Next month you under-order to compensate. Your stock levels swing wildly while your cash is tied up in the wrong products.
Data-driven ordering does not mean you need a PhD. It means:
- Pull the last 12 months of sales data
- Calculate the monthly average and standard deviation
- Use that instead of your gut
That is it. Three steps. The difference between a 40% forecast error and a 20% error on a $50,000/month product line is roughly $120,000 in annual working capital freed up. I know because I measured it when I finally switched.
5. Treating all SKUs the same
If you set the same 95% in-stock target across your entire catalog, you are over-investing in your bottom performers and under-investing in your top sellers. A 95% service level on a C-item that sells 3 units per month is a waste of safety stock. A 95% service level on your A-item that sells 300 units per month might not be high enough.
ABC analysis is not complicated. Sort your SKUs by revenue contribution. The top 20% of SKUs (your A items) typically account for 80% of revenue. These get the aggressive service levels, the tighter reorder points, the priority PO slots. Your C items - the bottom 50% by revenue - get wider reorder windows and lower safety stock.
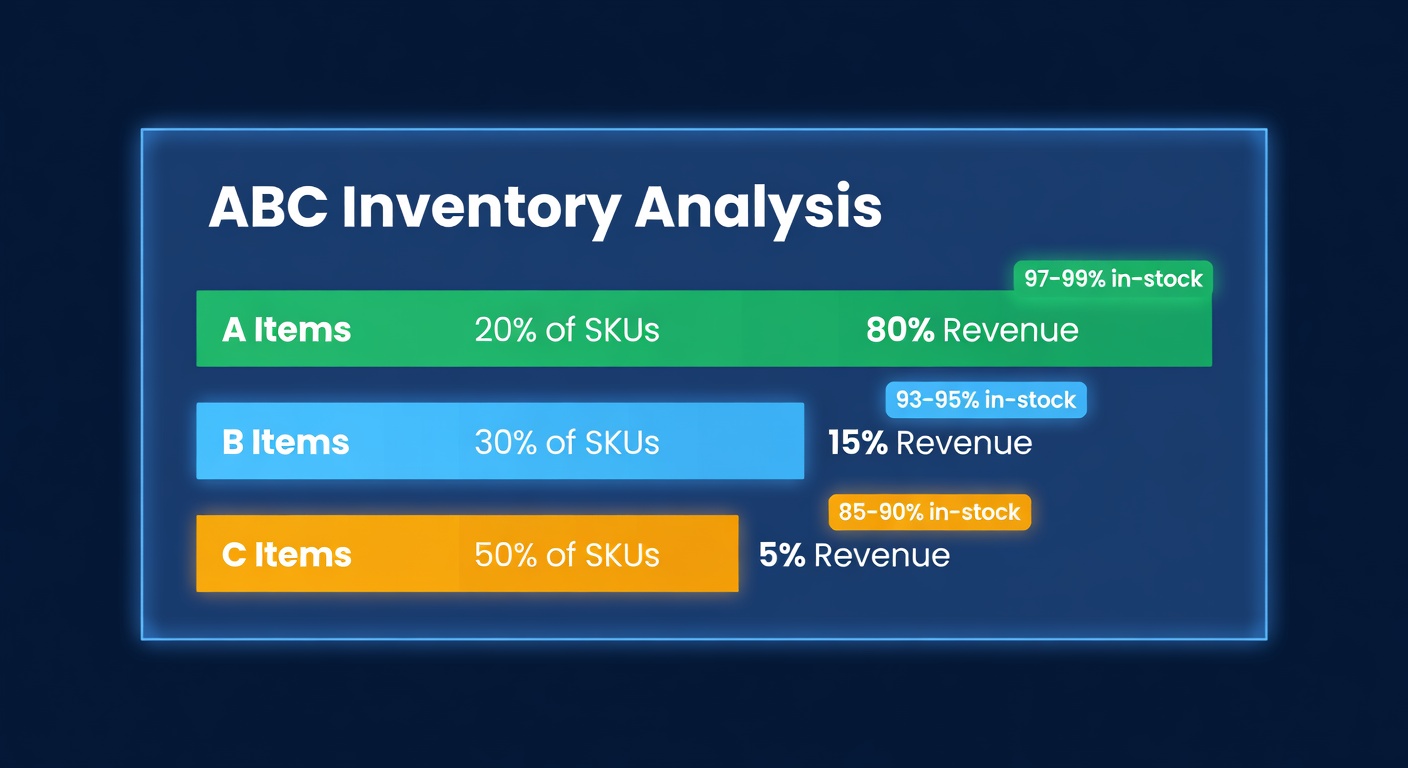
Here is what the service level targets should look like:
| Category | % of SKUs | % of revenue | Target in-stock rate | Safety stock approach |
|---|---|---|---|---|
| A | 20% | 80% | 97-99% | Full formula, reviewed monthly |
| B | 30% | 15% | 93-95% | Standard formula, reviewed quarterly |
| C | 50% | 5% | 85-90% | Minimal, reviewed when reordering |
I have seen sellers carrying 6 months of C-item inventory while their A items stock out twice a quarter. That is the opposite of good capital allocation.
6. Ignoring carrying costs in order decisions
"We got a 15% volume discount!" Great. How long will it take to sell through that volume?
If a 15% discount requires buying 6 months of supply instead of 2, and your carrying cost is 25% annually, here is the math:
- Volume discount savings: 15% on $10,000 order = $1,500
- Additional carrying cost: $10,000 extra inventory x 25% x 4 months = $833
- Net savings: $667
That $1,500 discount is actually worth $667 once you account for the cost of holding the extra inventory. Still positive, but not the slam dunk it felt like. And if the product is seasonal or demand drops, that $833 grows fast.
The EOQ calculator exists precisely for this tradeoff. It balances ordering costs against holding costs to find the quantity that minimizes total cost. Most sellers skip it because the formula looks intimidating. It is just arithmetic.
The fix: Before accepting a volume discount, calculate whether the holding cost eats the savings. If the payback period exceeds 3 months for a non-seasonal product, the discount is probably not worth it.
7. Not factoring MOQs into order timing
Supplier minimum order quantities create a timing problem that most sellers ignore. If your MOQ is 500 units and your monthly demand is 150, you are buying 3.3 months of supply with every order. That means you are placing an order roughly every 3 months, and each time you are committing significant capital.
The mistake is treating MOQs as fixed. They are not - they are a negotiation starting point. But even when they are truly fixed, the timing matters. Place that 500-unit order one week too early and you are holding an extra week of inventory. Place it one week too late and you risk stocking out during lead time.
The worst version of this is sellers who order the MOQ even when demand has dropped. Your supplier's MOQ is 500, demand fell from 150/month to 80/month, and now you are sitting on 6+ months of supply. I have done this. It hurts.
Here is a quick check: take your MOQ, divide by monthly demand. If the result is above 4, you have a problem worth solving.
| MOQ | Monthly demand | Months of supply per order | Verdict |
|---|---|---|---|
| 500 | 200 | 2.5 | Fine |
| 500 | 150 | 3.3 | Acceptable |
| 500 | 80 | 6.3 | Too much capital committed |
| 1,000 | 120 | 8.3 | Negotiate or find a new supplier |
The fix: Review MOQ economics quarterly. If your MOQ represents more than 4 months of supply, either negotiate a lower MOQ, consolidate SKUs in the same order, or accept a slightly higher unit cost for the flexibility. Sometimes paying 5% more per unit to buy half as many is the smarter financial move.
Where the Real Money Goes
Run these numbers on your own catalog. Pull the last 12 months of data and ask: how much did we spend on carrying costs for excess inventory? How much revenue did we lose to stockouts? What is our dead stock percentage?
We built ReplenishRadar to answer those questions on every sync. The system runs ABC classification automatically, tracks actual supplier lead times against quoted ones, flags dead stock before it hits 90 days, and calculates reorder points using your real demand variability - not a gut feeling padded by 25%. The sellers who switch from spreadsheet-based ordering to data-driven reorder points typically see working capital free up by 15-25% within the first quarter.
Try ReplenishRadar free for 14 days
Related Reading:
Frequently Asked Questions
Get notified when it matters
Amazon and Shopify change the rules constantly. We'll email you when something affects your business.
See what your inventory is really doing
Doing $5M+ in revenue? Talk to our team
Related Posts
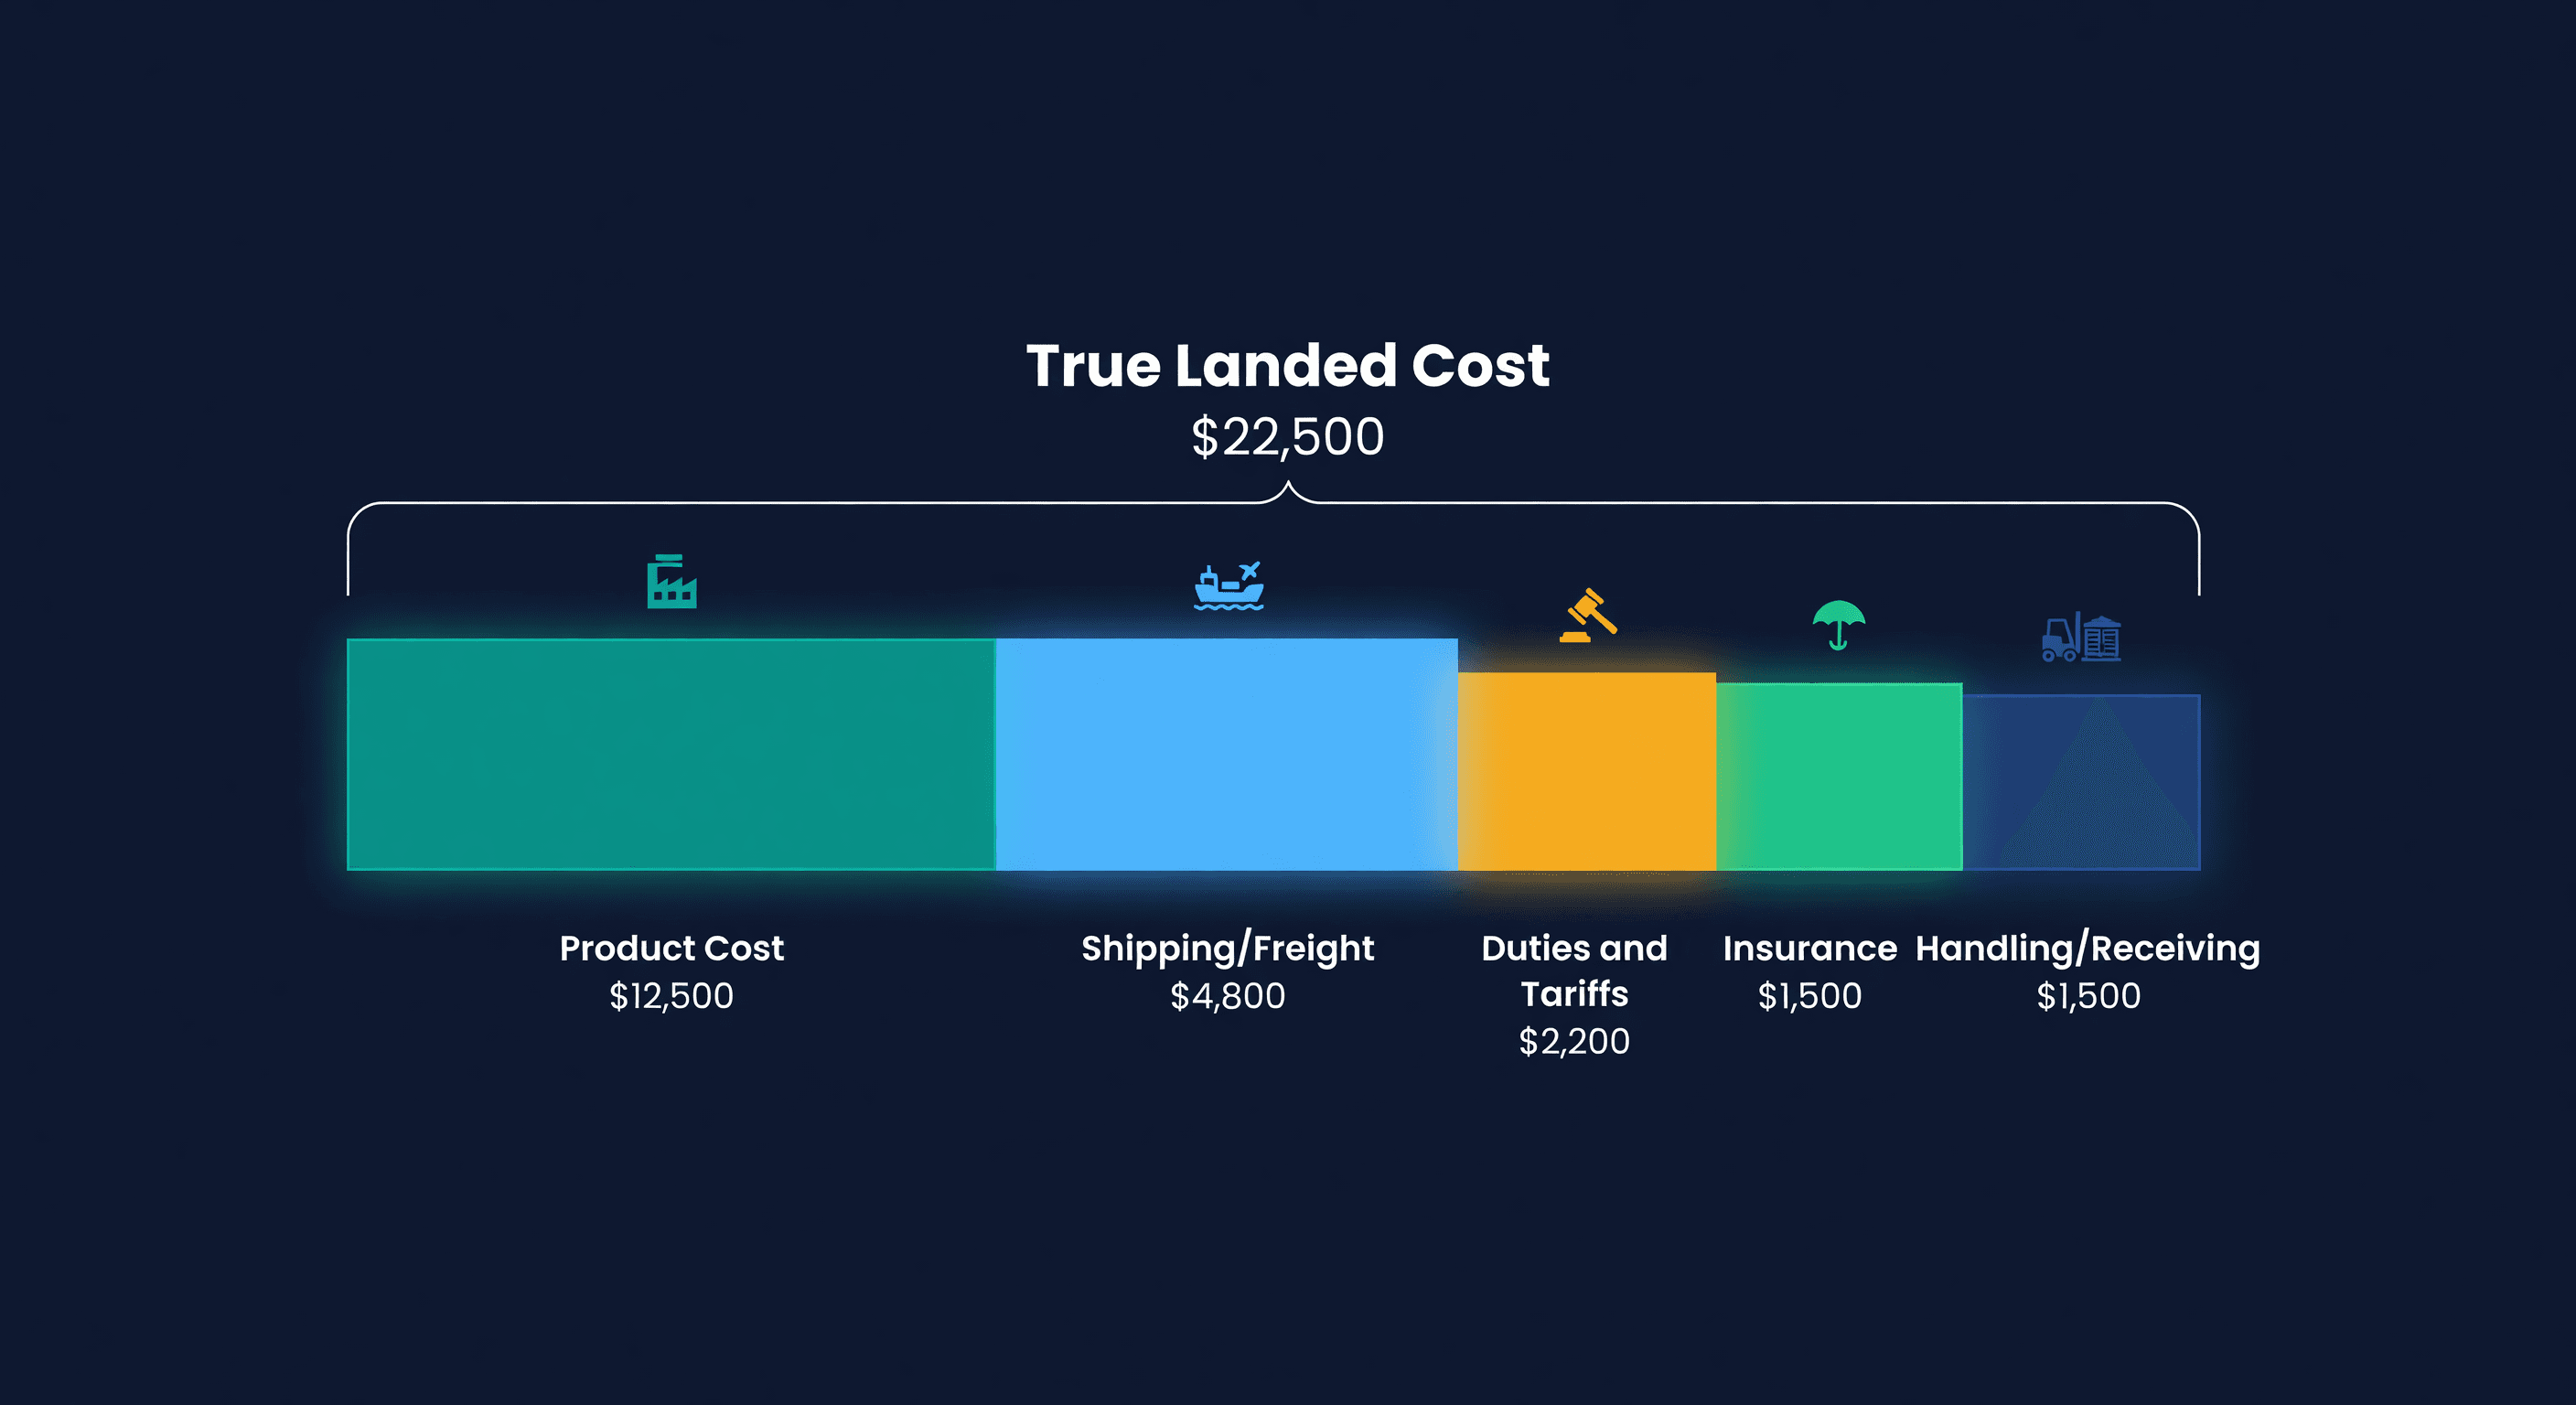
How to Calculate True Landed Cost
Your supplier invoice is not your real cost. Here's the landed cost formula with a worked example showing every hidden expense per unit.
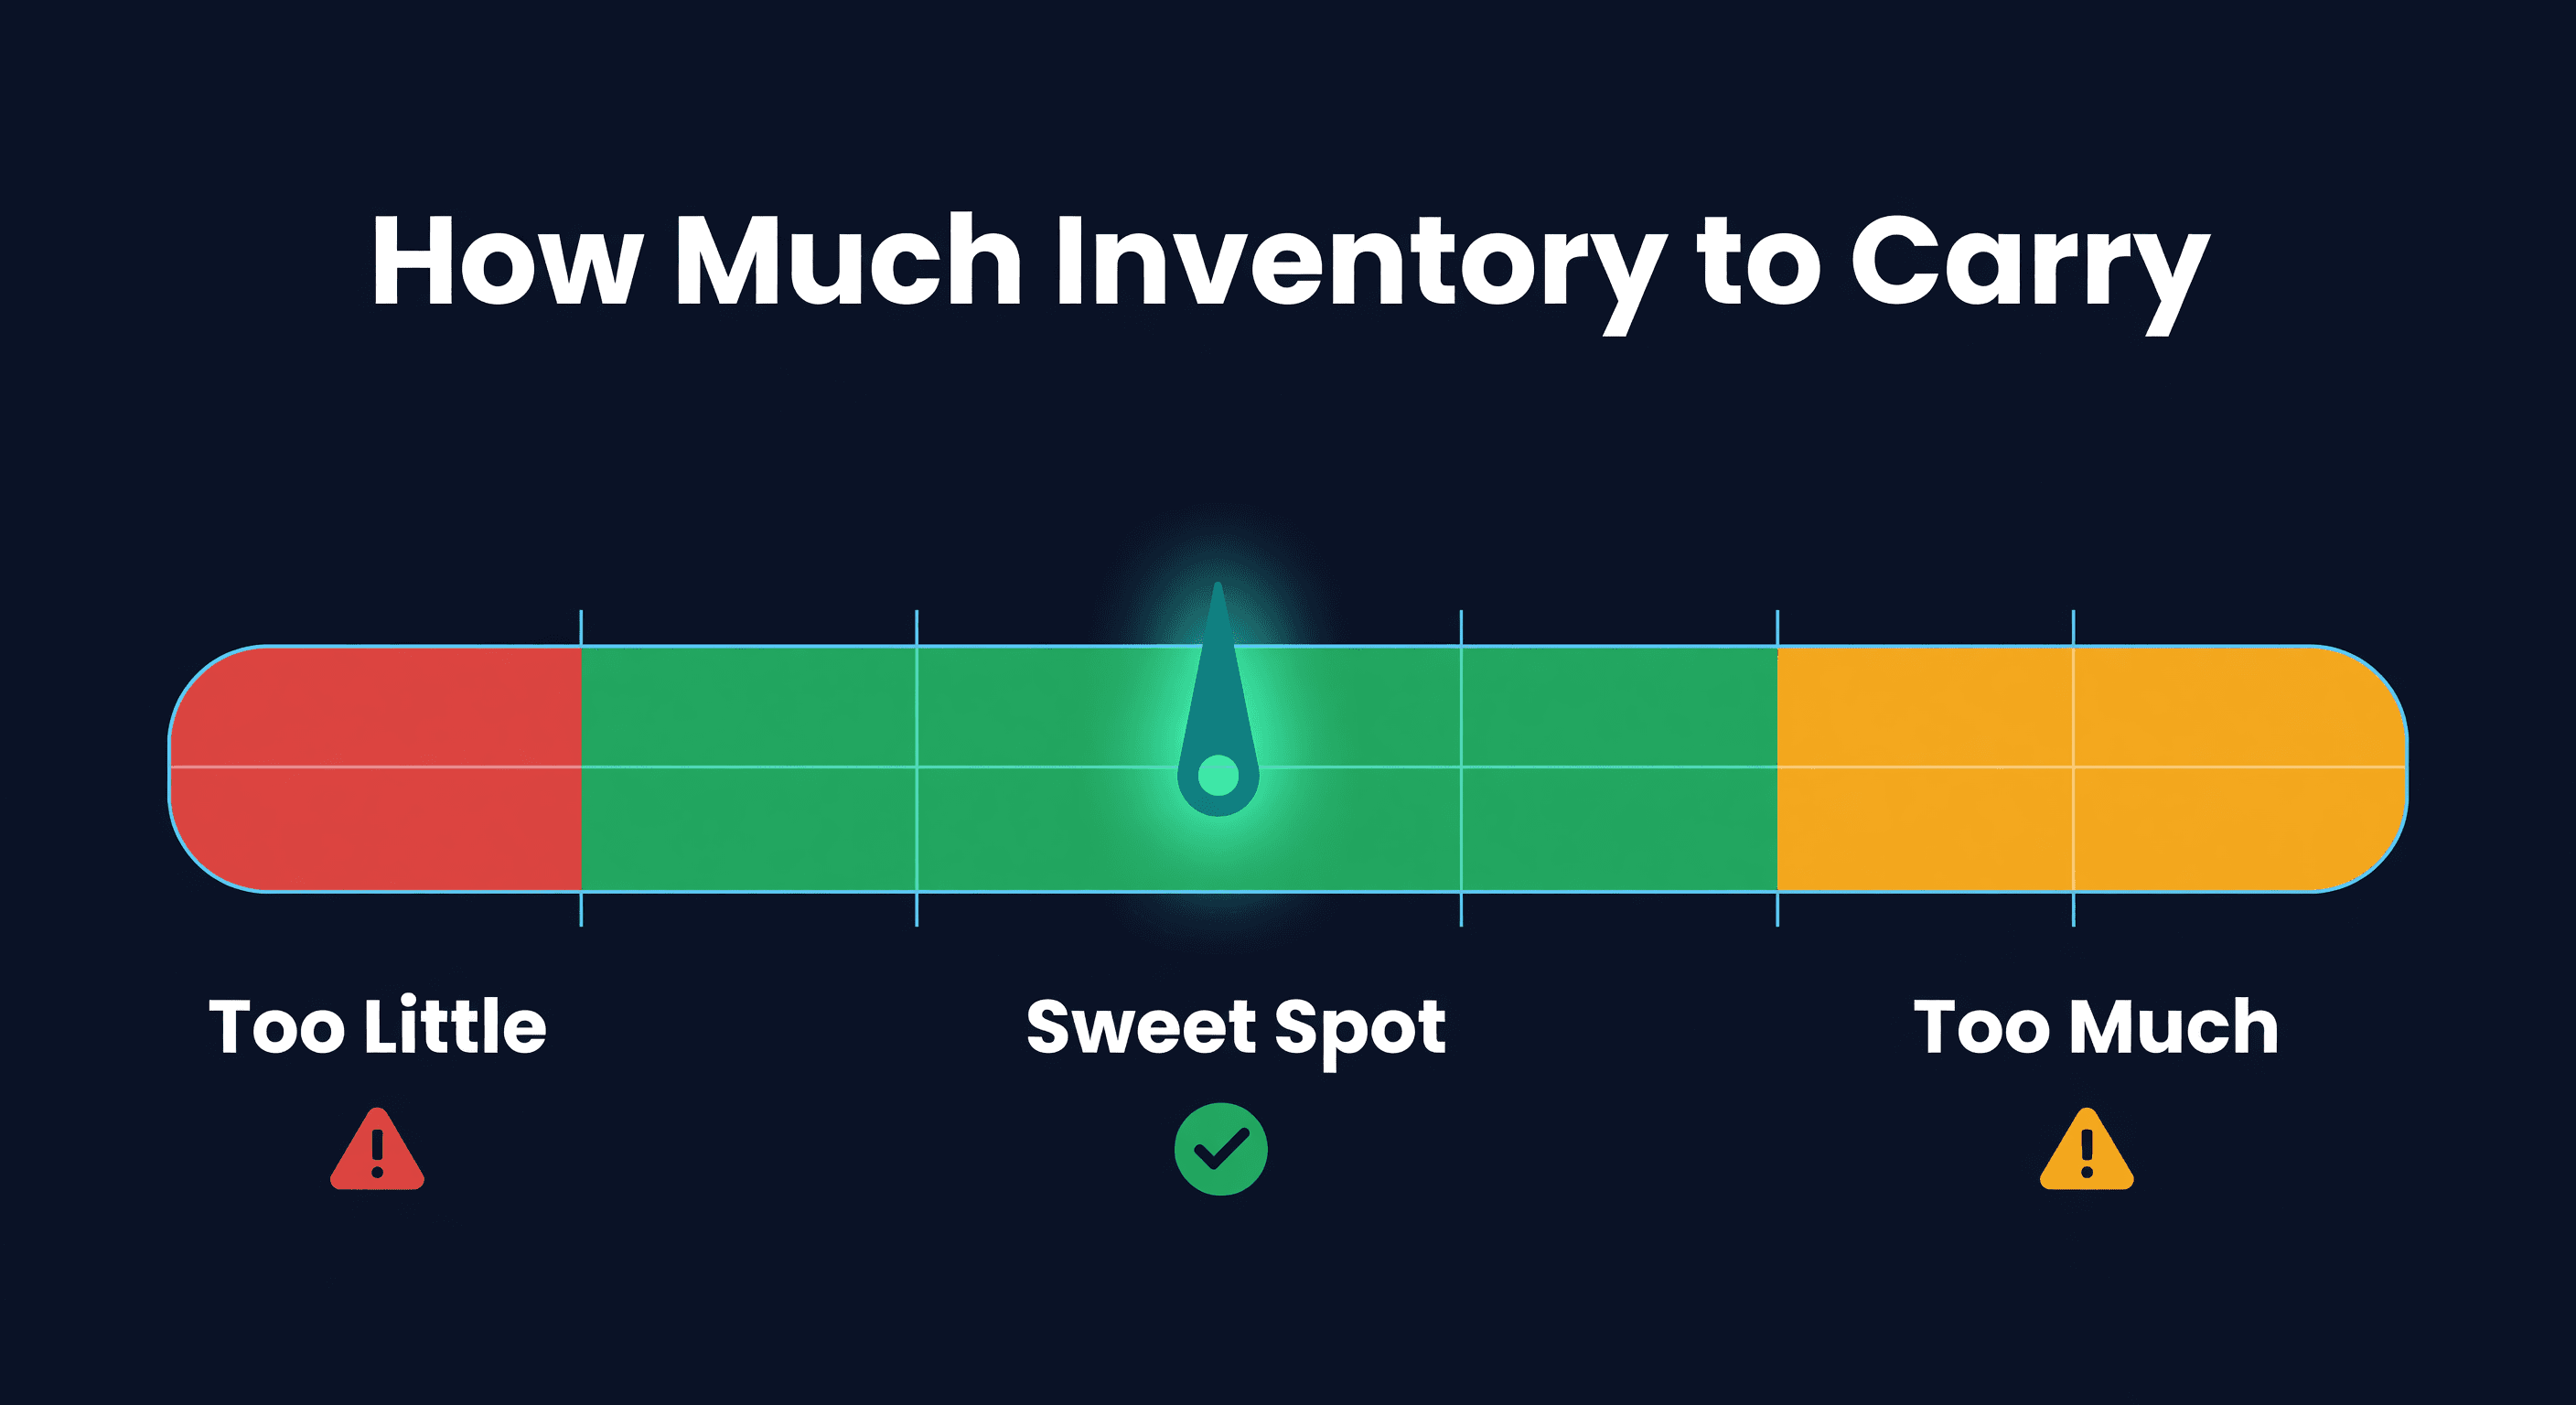
How Much Inventory Should You Carry?
The formula for optimal inventory levels, carrying cost math, and a worked example for a $500K inventory business. Stop guessing, start calculating.
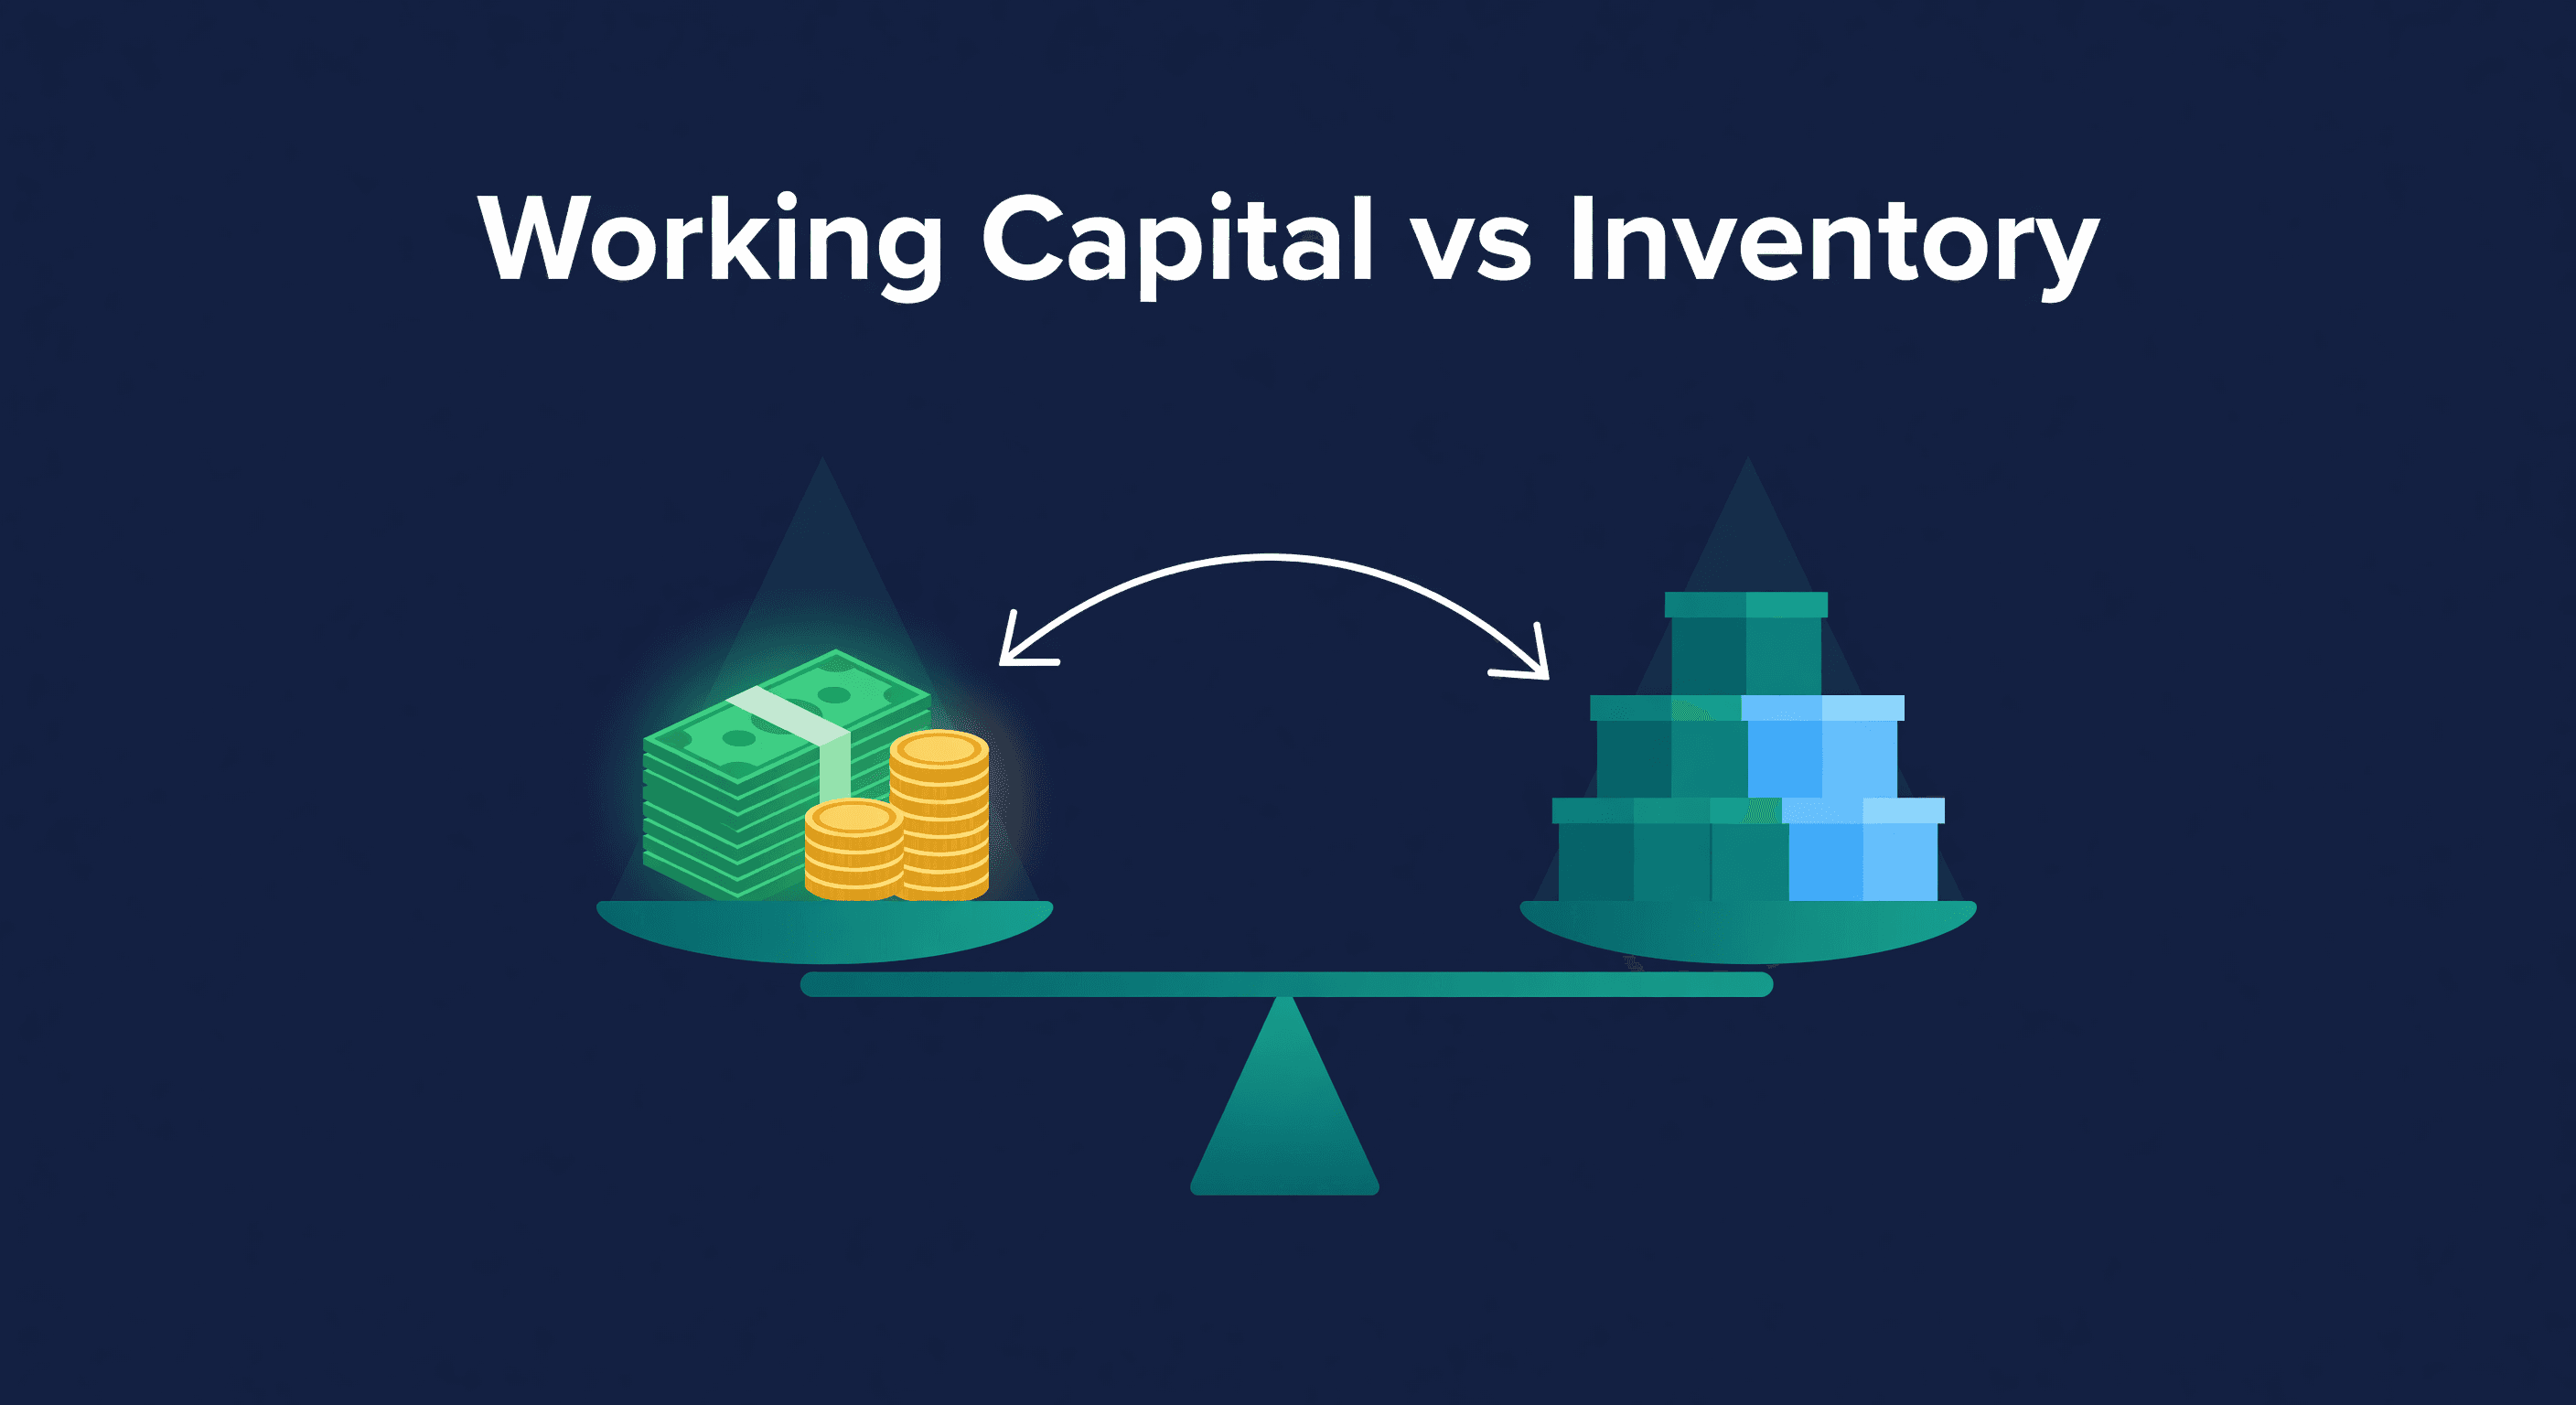
Working Capital and Inventory: Improve E-commerce Cash Flow
How inventory ties up working capital and what to do about it. Reduce tied-up cash while keeping products in stock across Shopify and Amazon.
