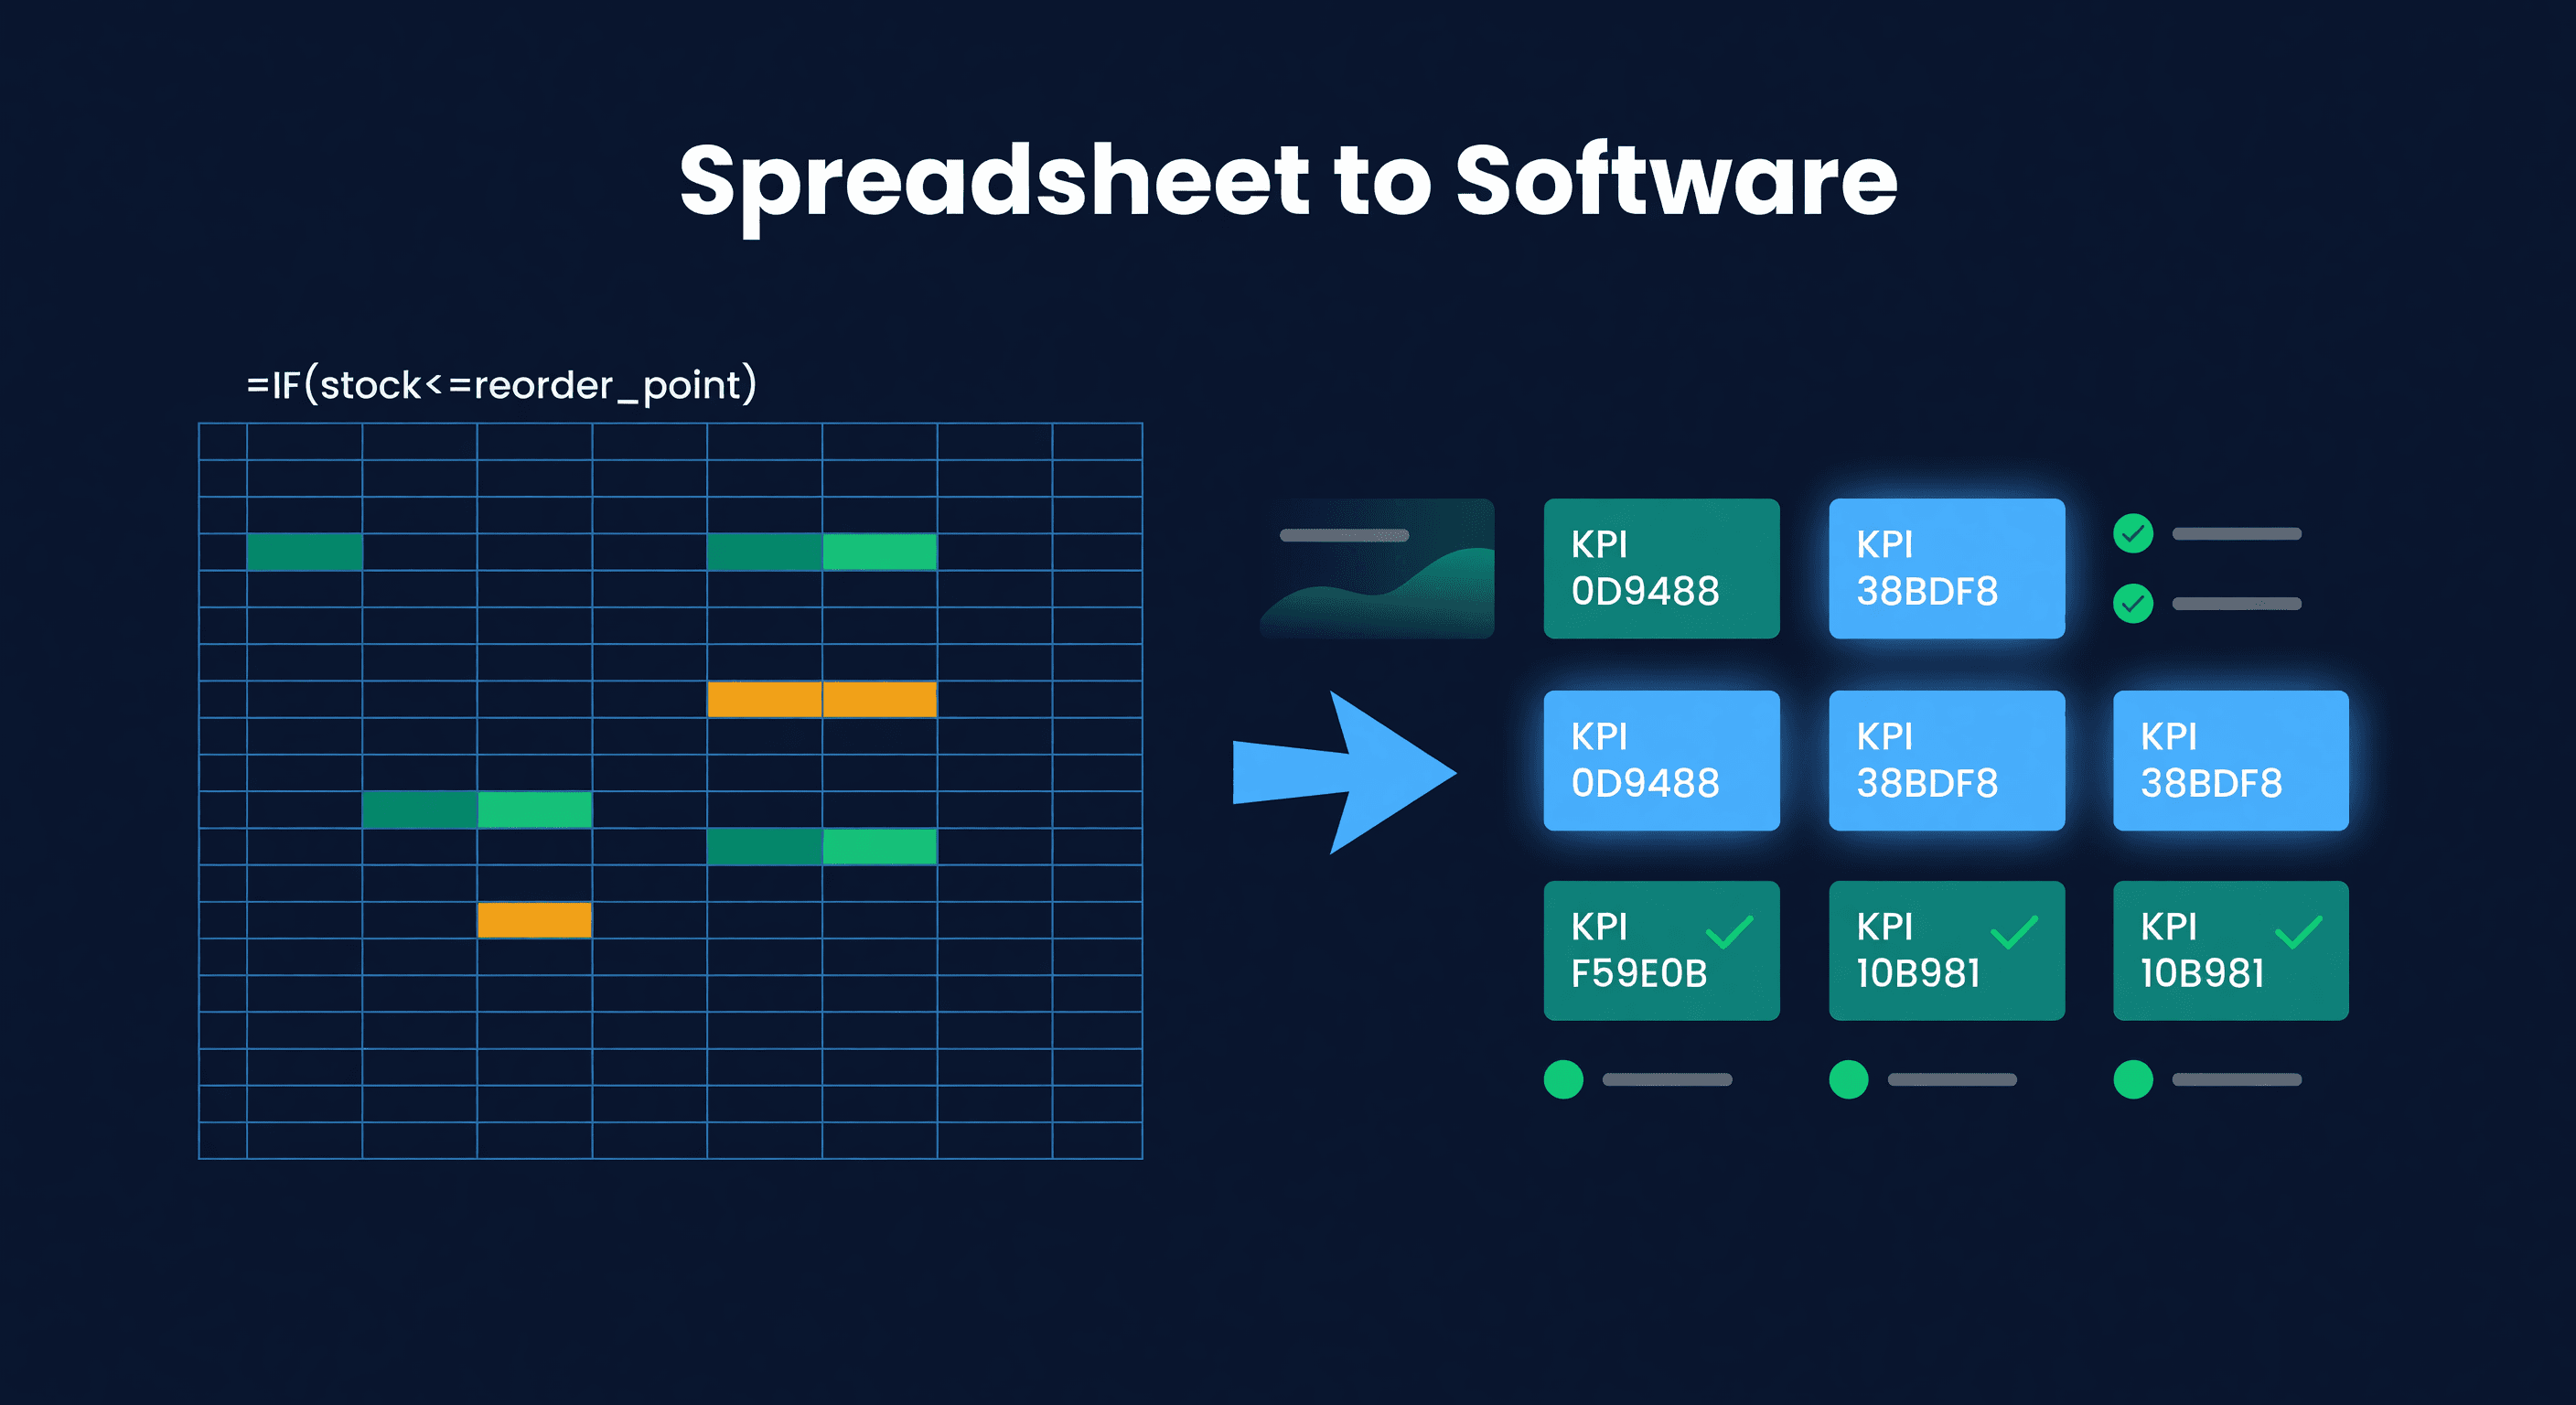
Inventory Spreadsheet Templates (+ When to Quit)
Key takeaway: Spreadsheets work for inventory management up to about 50 SKUs and one sales channel. Above 200 SKUs, they cause stockouts from stale data and broken formulas. If you're spending more than 5 hours per week maintaining spreadsheets, it's time to upgrade.
I ran my entire business on a Google Sheet for two years. Not a bad spreadsheet, either - it had VLOOKUP formulas, conditional formatting for low stock alerts, and a reorder calculator tab that I was genuinely proud of. It worked. Until it did not.
This post is the guide I wish I had back then. I am going to give you three spreadsheet templates that actually work, show you the formulas, and be honest about exactly where each one breaks down. Spreadsheets are a perfectly good tool for early-stage inventory management. The mistake is not starting with them. The mistake is staying with them too long.
What a Good Inventory Spreadsheet Needs
Bad inventory spreadsheets are just lists of products and quantities. Good ones calculate things for you. Here are the columns that matter:
| Column | What it does | Formula or manual? |
|---|---|---|
| SKU | Unique identifier | Manual |
| Product name | Human-readable | Manual |
| Current stock | Units on hand right now | Manual (this is the problem) |
| Unit cost | What you pay per unit | Manual |
| Daily sales rate | Average units sold per day | Formula: last 30 days sales / 30 |
| Days of supply | How long until stockout | Formula: current stock / daily rate |
| Lead time | Days from PO to delivery | Manual |
| Reorder point | When to order | Formula: daily rate x lead time |
| Safety stock | Buffer for variability | Formula (see below) |
| Status | Order now / soon / OK | Formula: IF logic |
The daily sales rate is where most spreadsheets fall apart first. Someone has to update "last 30 days sales" regularly. If that number is stale, every downstream formula is wrong. Days of supply, reorder point, status alerts - all garbage.
Template 1: Simple Stock Tracker
This is the starter. Good for under 30 SKUs and one sales channel.
In column J, your reorder alert formula:
=IF(D2 <= H2, "ORDER NOW", IF(D2 <= H2 * 1.25, "ORDER SOON", "OK"))
Where D2 is current stock and H2 is your reorder point. The 1.25 multiplier gives you a warning zone before you actually hit the trigger.
For days of supply in column G:
=IF(F2 > 0, D2 / F2, "NO SALES")
This handles the division-by-zero case for products with no recent sales. Those are worth flagging for a different reason - they might be dead stock.
I kept this template running for my first 6 months of selling. Updated it every Monday morning with weekend sales. Took about 20 minutes. Totally fine at 15 SKUs.
Template 2: Reorder Point Calculator
This one adds the math. Instead of manually setting reorder points, you calculate them from demand and lead time.
The reorder point formula in a spreadsheet:
=F2 * H2 + I2
Where F2 is average daily demand, H2 is lead time in days, and I2 is safety stock.
For safety stock, the proper formula is:
=1.65 * STDEV(range_of_daily_sales) * SQRT(H2)
The 1.65 is the Z-score for a 95% service level. If you want 99%, use 2.33. If 90% is fine for this SKU, use 1.28. Here is the lookup:
| Service level | Z-score | What it means |
|---|---|---|
| 90% | 1.28 | Stock out ~1 month per year |
| 95% | 1.65 | Stock out ~2.6 weeks per year |
| 97.5% | 1.96 | Stock out ~1.3 weeks per year |
| 99% | 2.33 | Stock out ~3.6 days per year |
A worked example: your product sells an average of 8 units/day with a standard deviation of 3, and your supplier delivers in 14 days. Reorder point = (8 x 14) + (1.65 x 3 x SQRT(14)) = 112 + 18.5 = 131 units. When your stock hits 131, place the order.
This template is solid. I used a version of it for over a year. The problem is the STDEV formula - you need a column (or a separate sheet) tracking daily sales for each SKU over at least 30 days. At 50 SKUs, that is 1,500 data points per month. The spreadsheet gets heavy.
Template 3: ABC Analysis
ABC classification tells you where to focus. You do not need the same rigor on every SKU. This template sorts your catalog by revenue contribution.
The key formula: cumulative revenue percentage. Sort your SKUs by revenue (descending), then in the cumulative % column:
=SUM($G$2:G2) / SUM($G$2:$G$100)
Where column G is revenue per SKU. Then classify:
=IF(K2 <= 0.8, "A", IF(K2 <= 0.95, "B", "C"))
Top 80% of cumulative revenue = A items. Next 15% = B. Last 5% = C.
Here is what this typically reveals when you run it for the first time: 15-20% of your SKUs generate 80% of your revenue. You have been spending equal time managing the top 20% and the bottom 50%. That bottom 50% deserves less safety stock, less frequent reorder checks, and honestly, some of it deserves to be cut.
Where Spreadsheets Break
I am not going to pretend spreadsheets are bad. They are good tools with hard limits. Here are the five walls you will hit, roughly in order:
Wall 1: Stale data. Someone has to update stock counts manually. At 30 SKUs, that is 20 minutes. At 200 SKUs across Shopify and Amazon, you are spending 2+ hours per week on data entry that is already outdated by the time you finish.
Wall 2: Multi-channel math. You sell on Shopify and Amazon. Your spreadsheet has one "current stock" column. But stock at FBA is not the same as stock in your warehouse. Now you need two columns, and your reorder logic needs to know which channel to replenish. The formulas triple in complexity.
Wall 3: No history. Spreadsheets show you right now. They do not track how your lead times have drifted, how your demand patterns have shifted, or whether your supplier's reliability has changed. You need that history for good safety stock calculations. Without it, you are guessing.
Wall 4: Collaboration breaks. Two people update the spreadsheet. One overwrites the other's changes. Google Sheets handles simultaneous editing better than Excel, but it does not handle conflicting inventory updates. Someone marks 50 units received while someone else is entering a sales adjustment. The numbers stop reconciling.
Wall 5: You stop trusting it. This is the real death of the spreadsheet. After the third time a formula was wrong because someone edited a cell they should not have touched, you start double-checking everything. The spreadsheet becomes a suggestion that you verify against Seller Central and Shopify Admin. At that point, you have two inventory systems and trust neither.
I hit wall 3 first, then wall 1 and 5 simultaneously. The move from spreadsheets to software happened for me at about 60 SKUs and two sales channels. Not because the spreadsheet could not technically hold the data, but because I spent more time maintaining it than using it.
What Changed When I Switched
I am not going to pretend this is a neutral post. We built ReplenishRadar, so I have an obvious bias. But I also used spreadsheets for two years before building it, so I know exactly what I was replacing.
The spreadsheet took 4-6 hours per week to maintain. Stock counts, sales data, reorder calculations, PO tracking, lead time updates. ReplenishRadar syncs with Shopify and Amazon directly, so the stock counts update automatically. The reorder points recalculate when demand or lead times change. I went from 4-6 hours of spreadsheet maintenance to about 30 minutes of reviewing what the system flagged.
The bigger change was accuracy. My spreadsheet reorder points were based on whatever demand data I had remembered to update. Actual demand was often 15-20% different from what my sheet said. Automated syncing closed that gap because the numbers are current, not last-Monday current.
If you are under 50 SKUs on a single channel, keep the spreadsheet. Seriously. The templates above work. But if you have hit two or more of those five walls, the spreadsheet is costing more than it is saving. See how ReplenishRadar works - free inventory report.
Related Reading:
Frequently Asked Questions
Get notified when it matters
Amazon and Shopify change the rules constantly. We'll email you when something affects your business.
See what your inventory is really doing
Doing $5M+ in revenue? Talk to our team
Related Posts

Best AI Agent Setup for Amazon and Shopify (2026)
Four ways to connect an AI agent to your inventory data. Claude Desktop, OpenClaw, custom Python, and n8n compared with honest pros and cons.
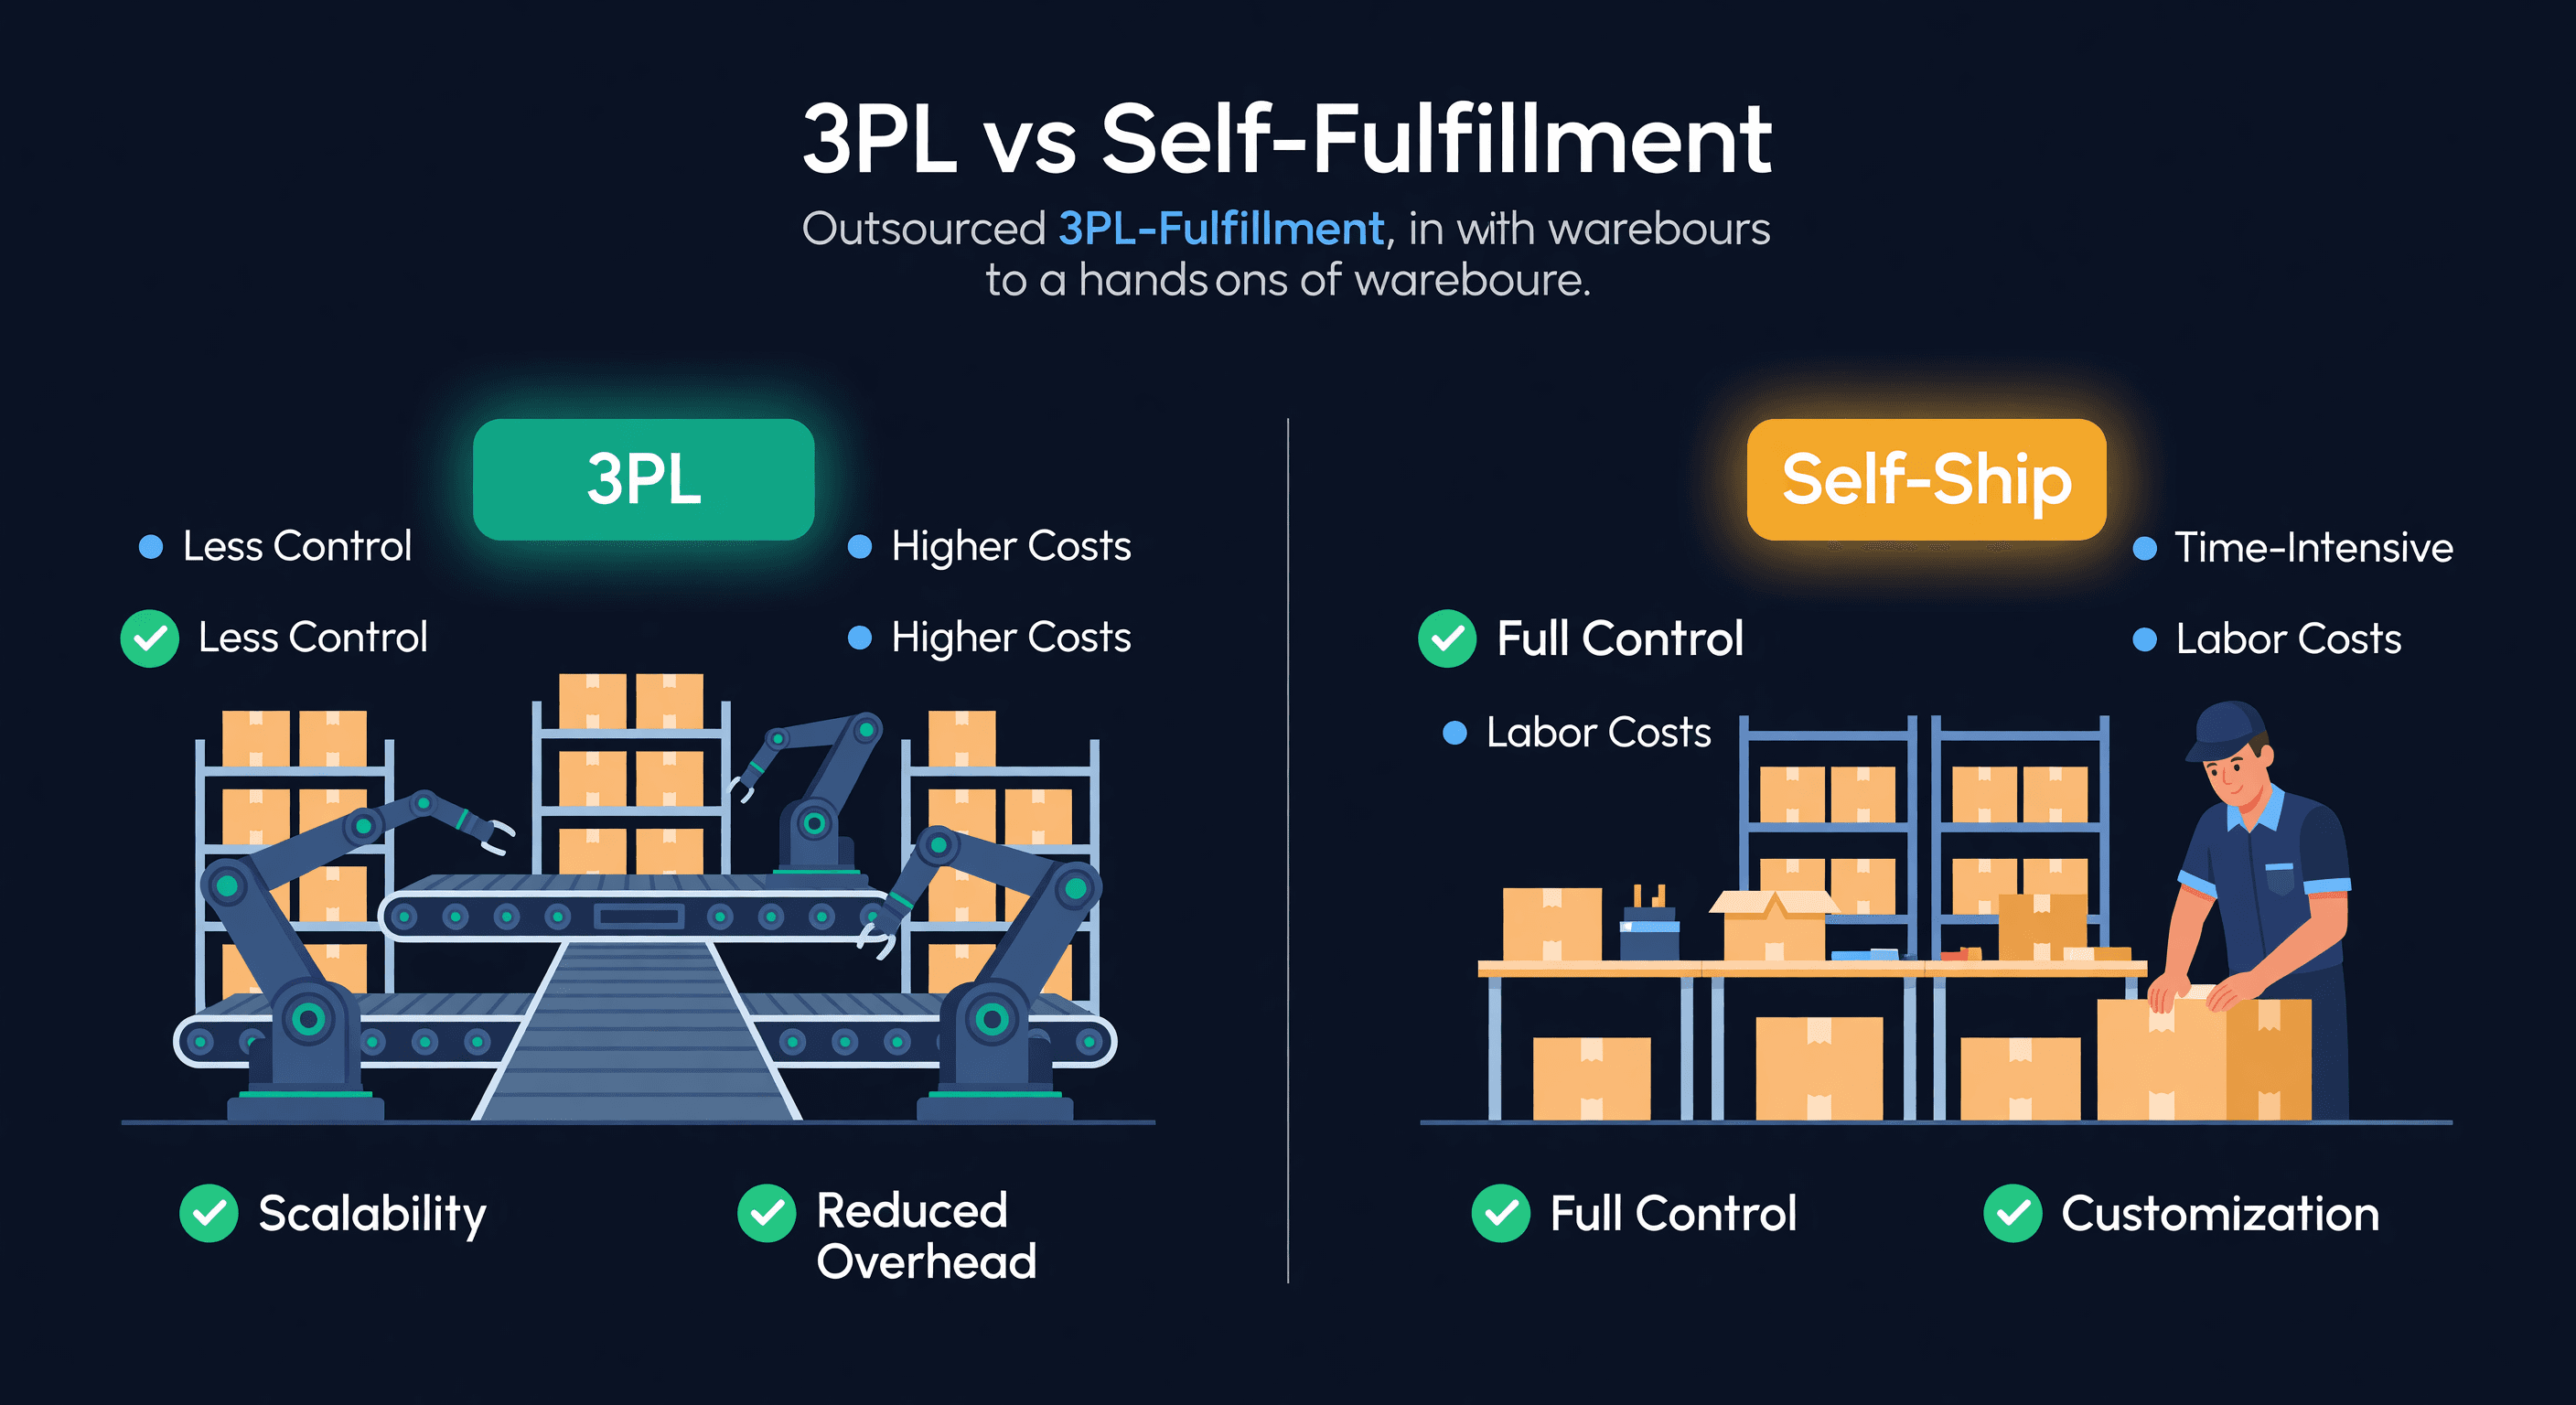
3PL vs Self-Fulfillment for E-commerce
A real cost comparison of 3PL vs self-fulfillment, with the math on when to outsource, when to keep it in-house, and why hybrid models win.
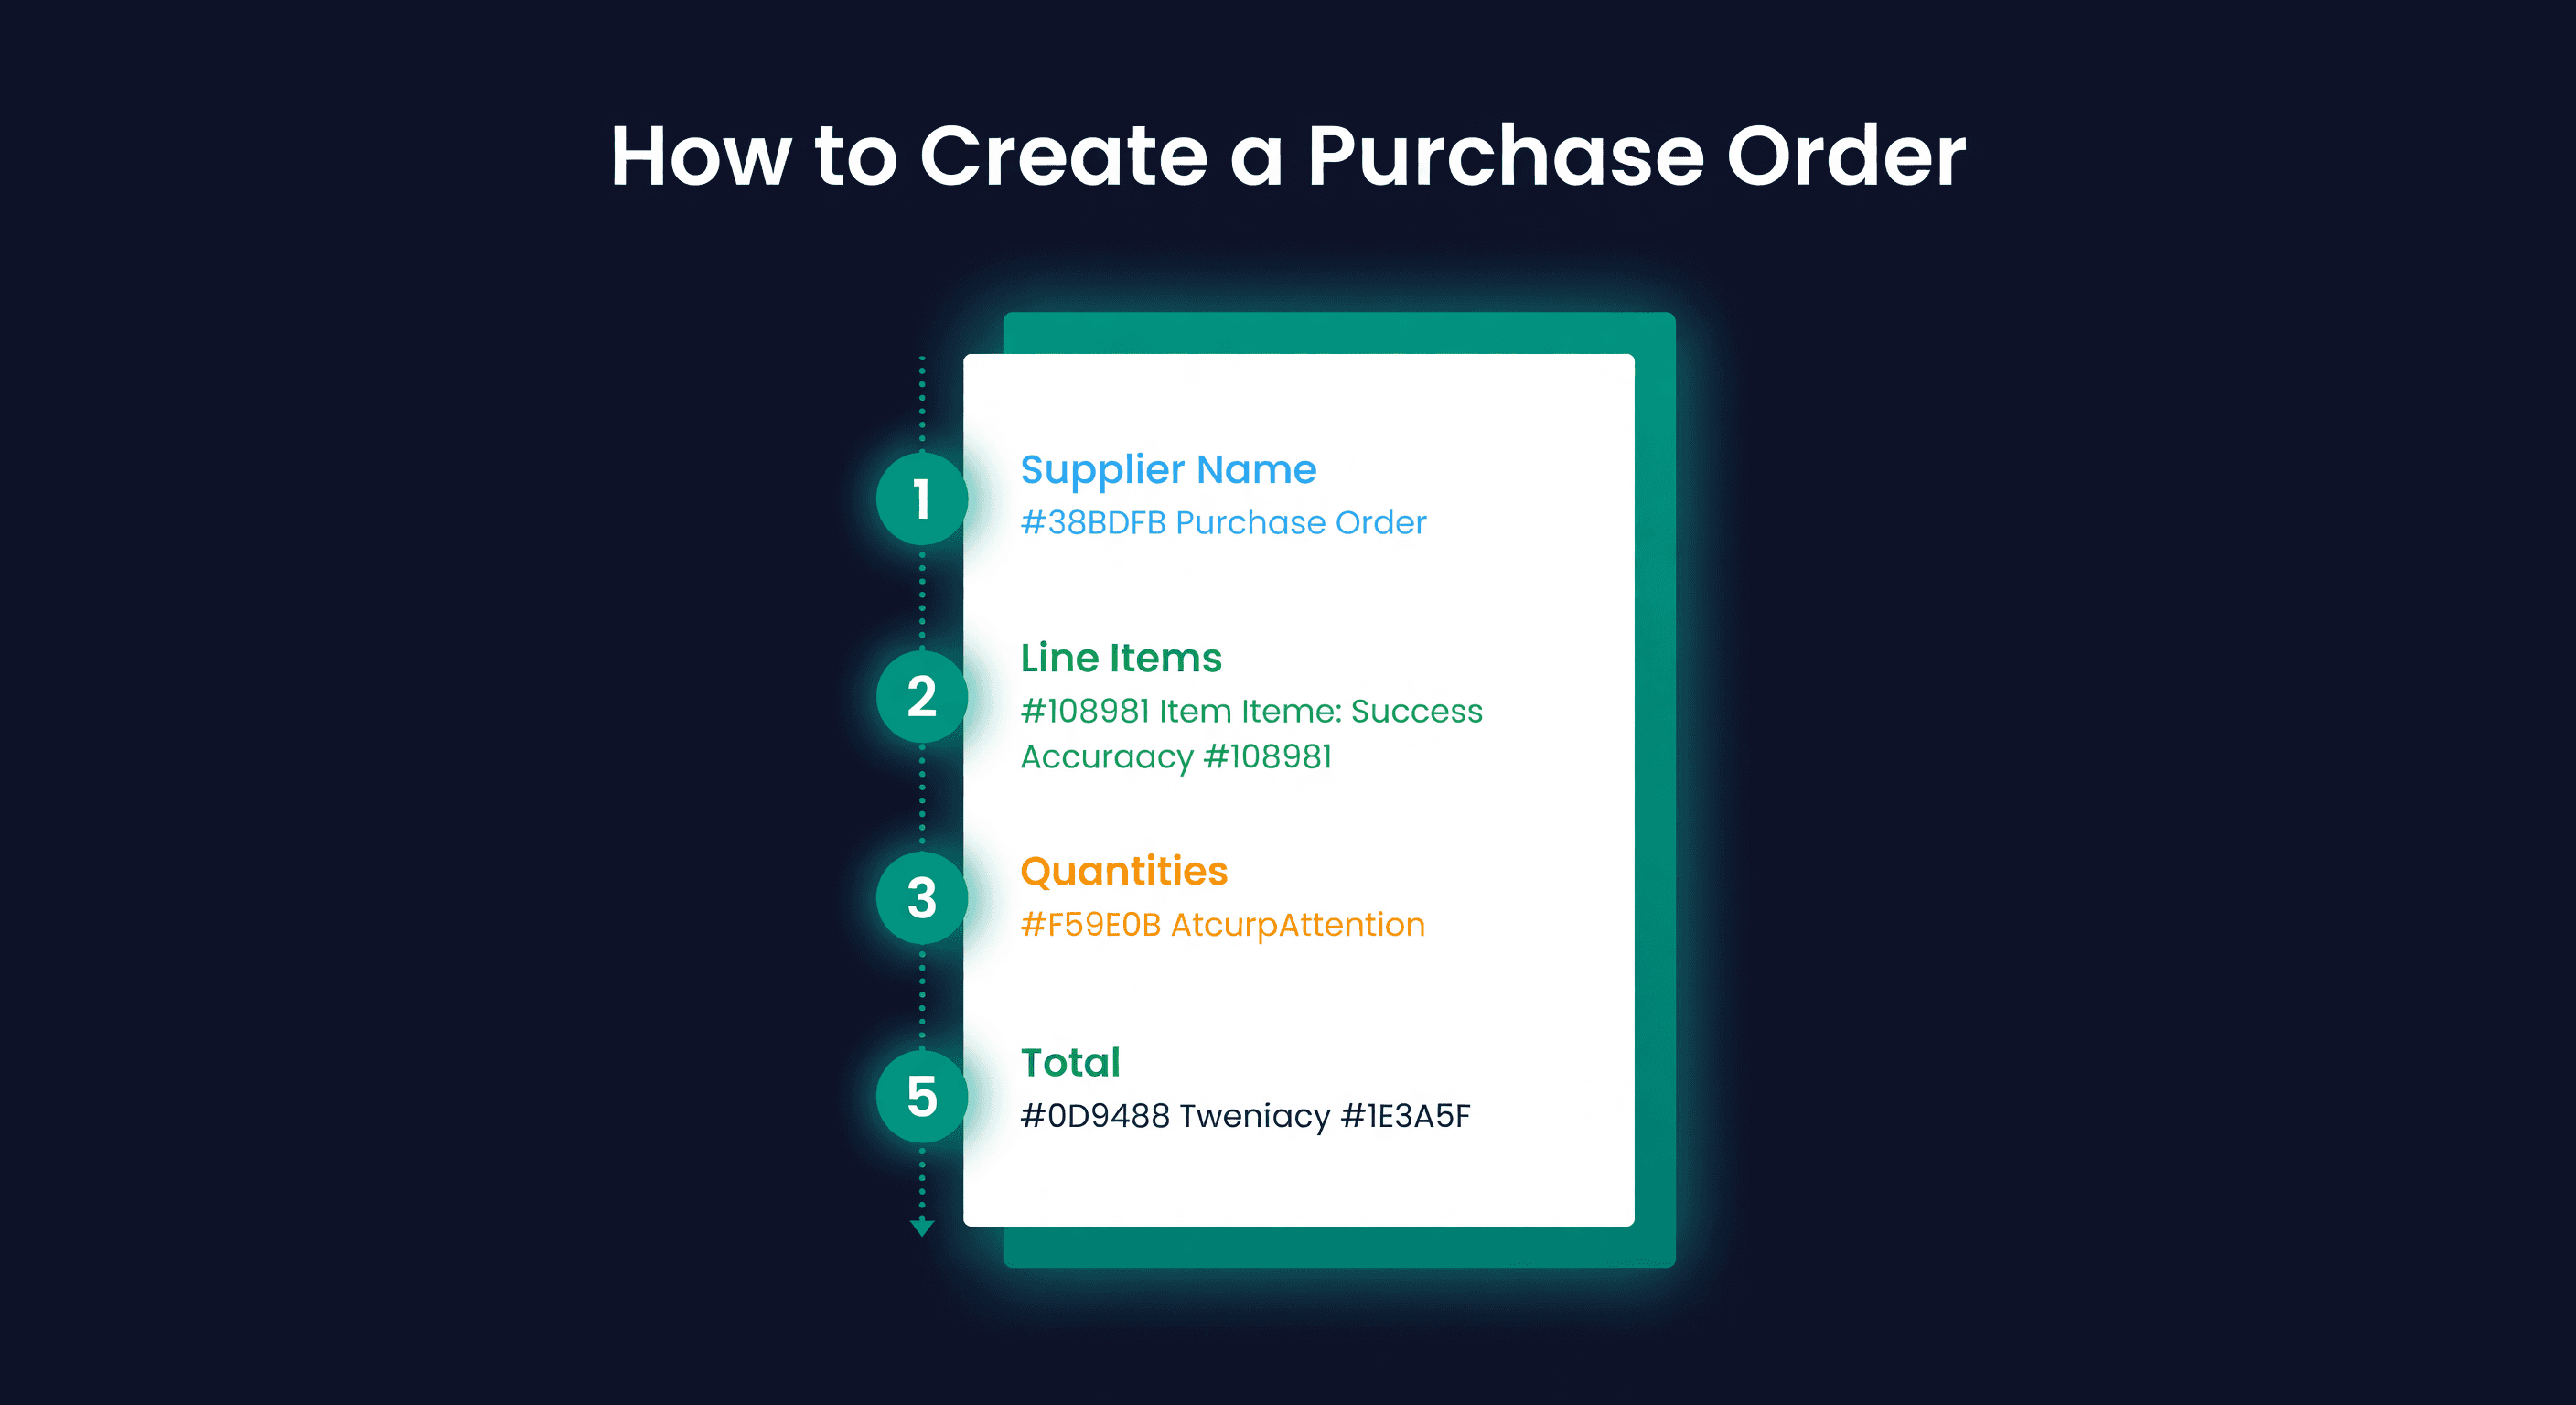
How to Create a Purchase Order (Step-by-Step)
How to create a purchase order for e-commerce, with a PO template, worked examples, and the ordering mistakes that cost sellers thousands.
