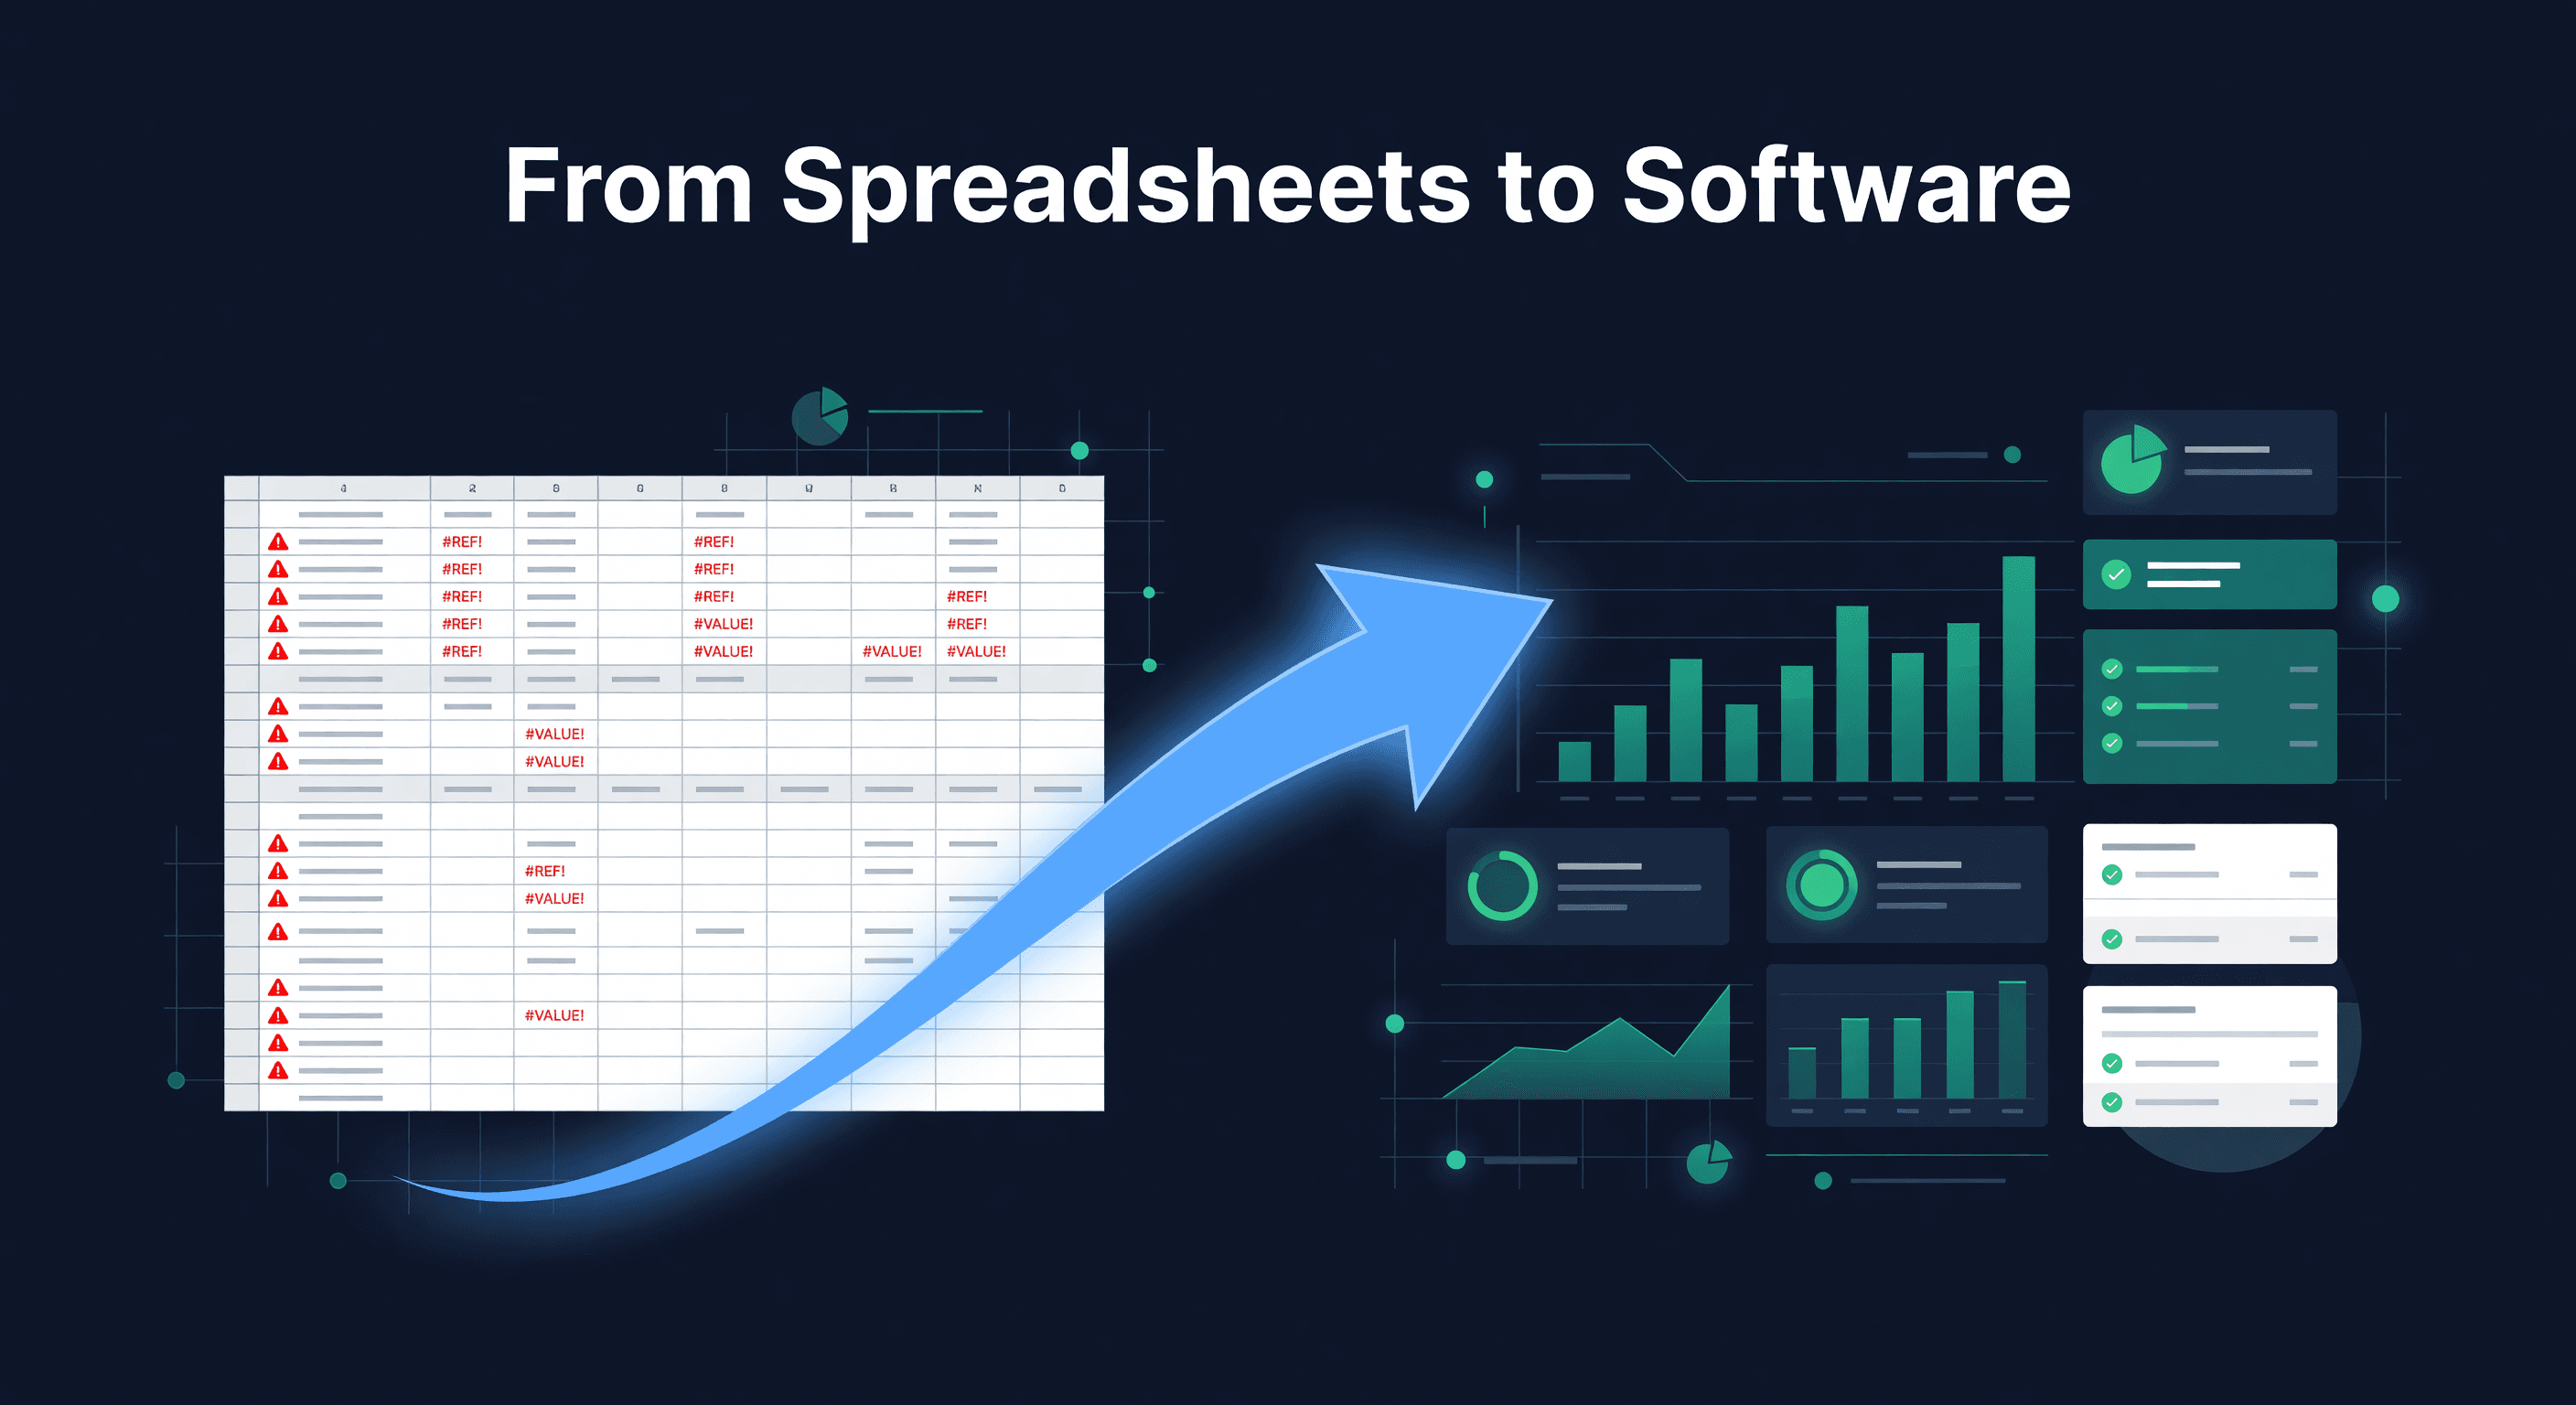
From Spreadsheets to Inventory Software: When to Upgrade
Key takeaway: Switch from spreadsheets to software when you're spending more than 5 hours per week on manual inventory work, selling on multiple channels, or more than one person needs to edit inventory data. Setup takes 1-3 days; ROI shows immediately in fewer stockouts.
I Ran My Inventory on Spreadsheets for Three Years
They worked. For a while. With 30 SKUs on a single Shopify store, a well-built Google Sheet did everything I needed. Reorder points, stock levels, basic velocity - all manageable with formulas I understood.
Then I added Amazon. Then a second product line. Then I hired someone to help with purchasing and suddenly we were both editing the same sheet, breaking each other's formulas, and spending Sunday nights reconciling numbers that did not match.
This post is not about convincing you to switch before you need to. It is about recognizing the signs when spreadsheets start costing you more than they save.
When Spreadsheets Are Enough
| Condition | Why It Works |
|---|---|
| Under 50 SKUs | Manageable to update manually |
| Single sales channel | No cross-channel sync needed |
| One person manages inventory | No version conflicts |
| Stable, predictable demand | Simple formulas suffice |
| Domestic suppliers with short lead times | Less forecasting complexity |
If this describes your business, a spreadsheet with columns for SKU, current stock, reorder point, and supplier lead time is genuinely sufficient. Do not fix what is not broken.
The 7 Signs You Have Outgrown Spreadsheets
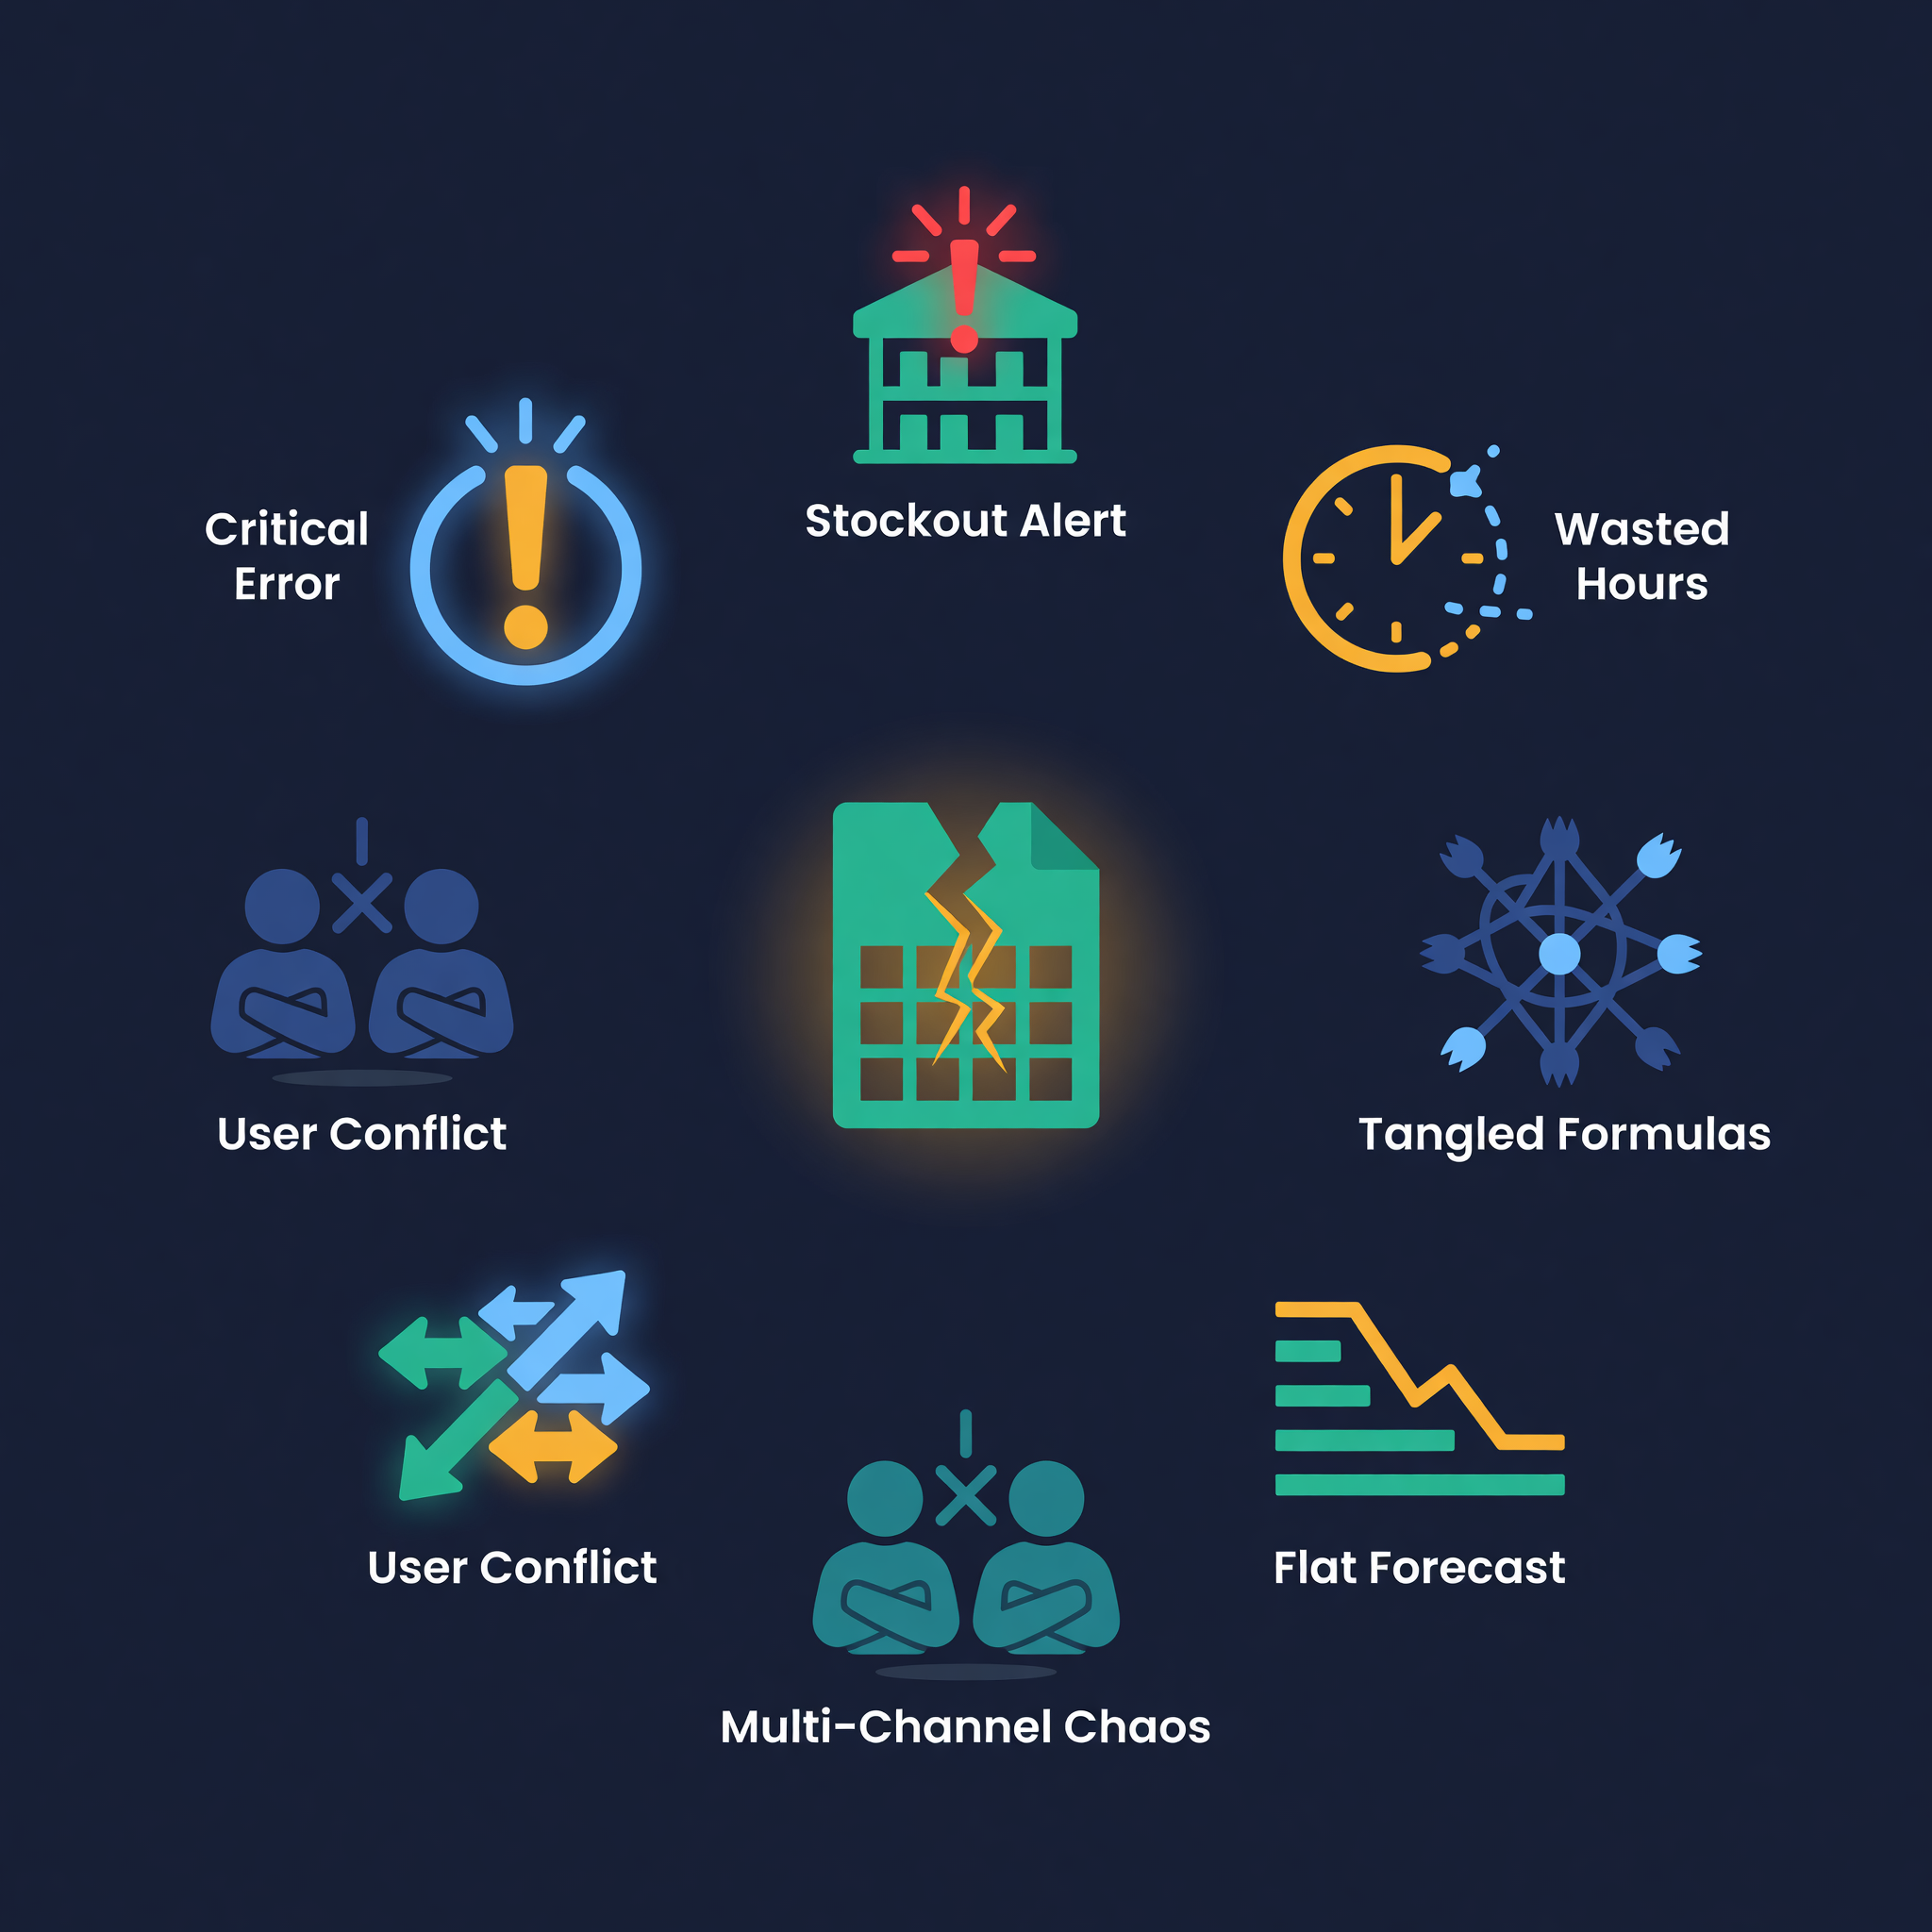
1. Frequent Stockouts You Did Not See Coming
Your spreadsheet said you had 45 units. You actually had 12 because yesterday's Amazon sales had not been entered yet. Manual data entry creates lag, and inventory counts are only as current as the last update.
A single stockout on a product selling $30/day with 40% margins costs $12/day in lost profit. A 5-day stockout across 3 SKUs: $180 in margin, plus ranking damage on Amazon.
2. You Spend Hours Each Week Updating Data
Copying order data from Shopify, cross-referencing Amazon Seller Central, updating stock counts, recalculating reorder points. If this takes more than 5 hours per week:
Time spent: 6 hours/week
Your hourly value: $50/hour (conservative for a business owner)
Annual cost of spreadsheet maintenance: 6 x $50 x 52 = $15,600/year
Most inventory software costs $50-200/month. The math is not close.
3. Multiple Tabs That Nobody Fully Trusts
You have a "Master Inventory" tab, a "Shopify Sales" tab, an "Amazon Sales" tab, and a "Reorder Calculator" tab. They reference each other with VLOOKUP and INDEX/MATCH formulas. When something breaks, nobody is sure which tab has the right number.
I have been in this situation. When two people look at the same spreadsheet and get different answers about stock levels, the tool has become a liability.
4. You Cannot Forecast Demand
Spreadsheets calculate averages. They struggle with seasonality detection across 200+ SKUs, trend analysis, lead-time-aware projections, and automatic reorder point adjustments. If your "forecasting" is looking at last month's sales and hoping next month is similar, you are guessing. And guessing gets expensive past 50 SKUs.
5. Multi-Channel Inventory Is Chaos
Selling on Shopify and Amazon with inventory in your warehouse plus FBA:
Total inventory = Warehouse + FBA Available + FBA Inbound + FBA Reserved

But your spreadsheet shows:
- Warehouse: Updated this morning
- FBA Available: Updated yesterday
- FBA Inbound: "I think we shipped 200 last week?"
- FBA Reserved: "Where do I even find that?"
Multi-channel sellers need real-time aggregation across locations. Spreadsheets give you snapshots at different points in time.
6. Your Team Cannot Collaborate
Two people editing the same spreadsheet. Conflicting changes. Someone accidentally deletes a formula. No audit trail. Even with Google Sheets' collaboration features, inventory spreadsheets become fragile when multiple people touch them daily.
7. Errors Are Increasing
Wrong quantities ordered. Duplicate purchase orders. A decimal point in the wrong place that ordered 1,000 units instead of 100. As complexity grows, manual processes produce more errors. Full stop.
If three or more of these sound familiar, you have likely crossed the threshold where spreadsheets cost more than they save.
What to Look for in Inventory Software
| Feature | Why It Matters | Questions to Ask |
|---|---|---|
| Auto-sync with sales channels | Eliminates manual data entry | Does it pull from Shopify AND Amazon? How often? |
| Real-time stock levels | Prevents overselling and stockouts | Does it show all locations (warehouse, FBA, in-transit)? |
| Demand forecasting | Replaces guesswork with data | Does it detect seasonality? How far ahead? |
| Reorder alerts | Proactive instead of reactive | Can I set thresholds per SKU? |
| Purchase order management | Connects recommendations to action | Can I generate POs from suggestions? |
Red flags: Manual CSV imports as the only sync method, no free trial, pricing that spikes as you grow, no Shopify or Amazon integration.
The Migration Process
Switching is simpler than most sellers expect.
What to Bring vs. Leave Behind
| Bring | Leave Behind |
|---|---|
| Sales history (software pulls from Shopify/Amazon) | Complex formula chains nobody understands |
| Current stock levels (initial sync + manual warehouse adjust) | Pivot tables built for one-time analysis |
| Supplier info (names, lead times, MOQs) | Workarounds for spreadsheet limitations |
| Reorder point overrides (if needed) | Historical notes (save separately if valuable) |
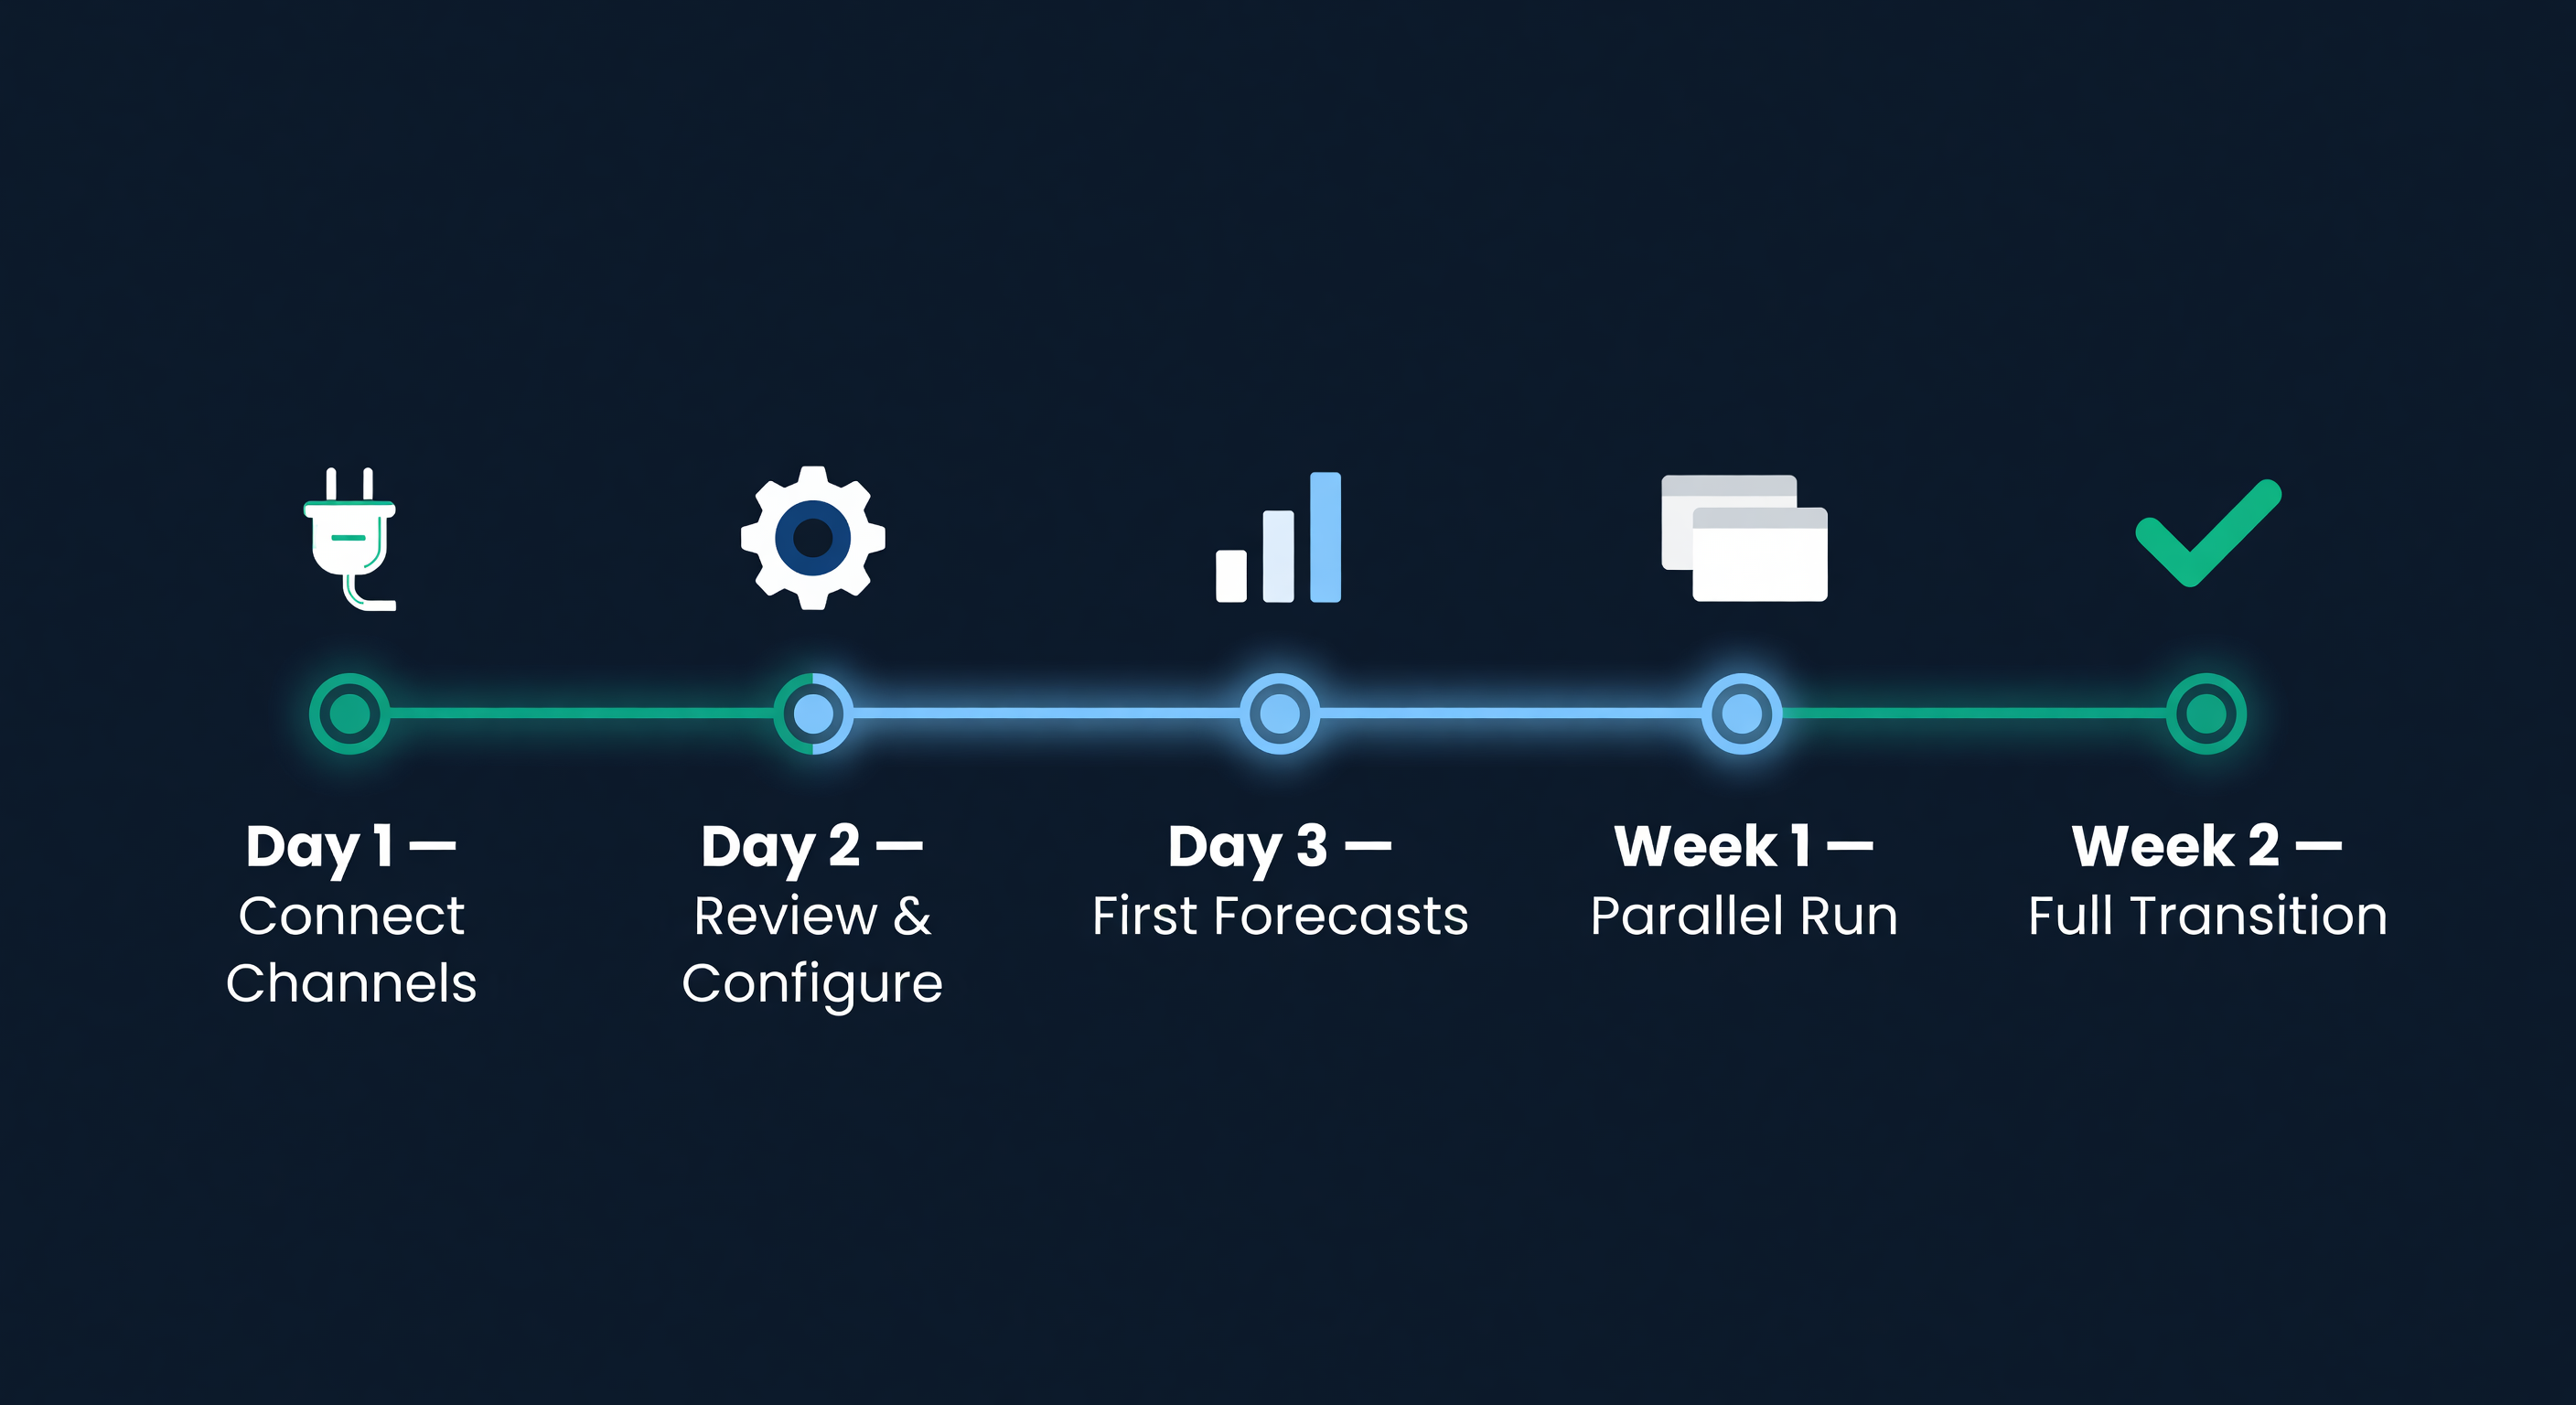
Typical Timeline
| Day | Activity |
|---|---|
| Day 1 | Connect sales channels, initial data sync |
| Day 2 | Review imported data, add supplier info, configure alerts |
| Day 3 | Generate first forecasts, review reorder recommendations |
| Week 1 | Run software alongside spreadsheet to build confidence |
| Week 2 | Transition fully, retire spreadsheet for daily use |
Calculating ROI
The decision should be financial, not emotional.
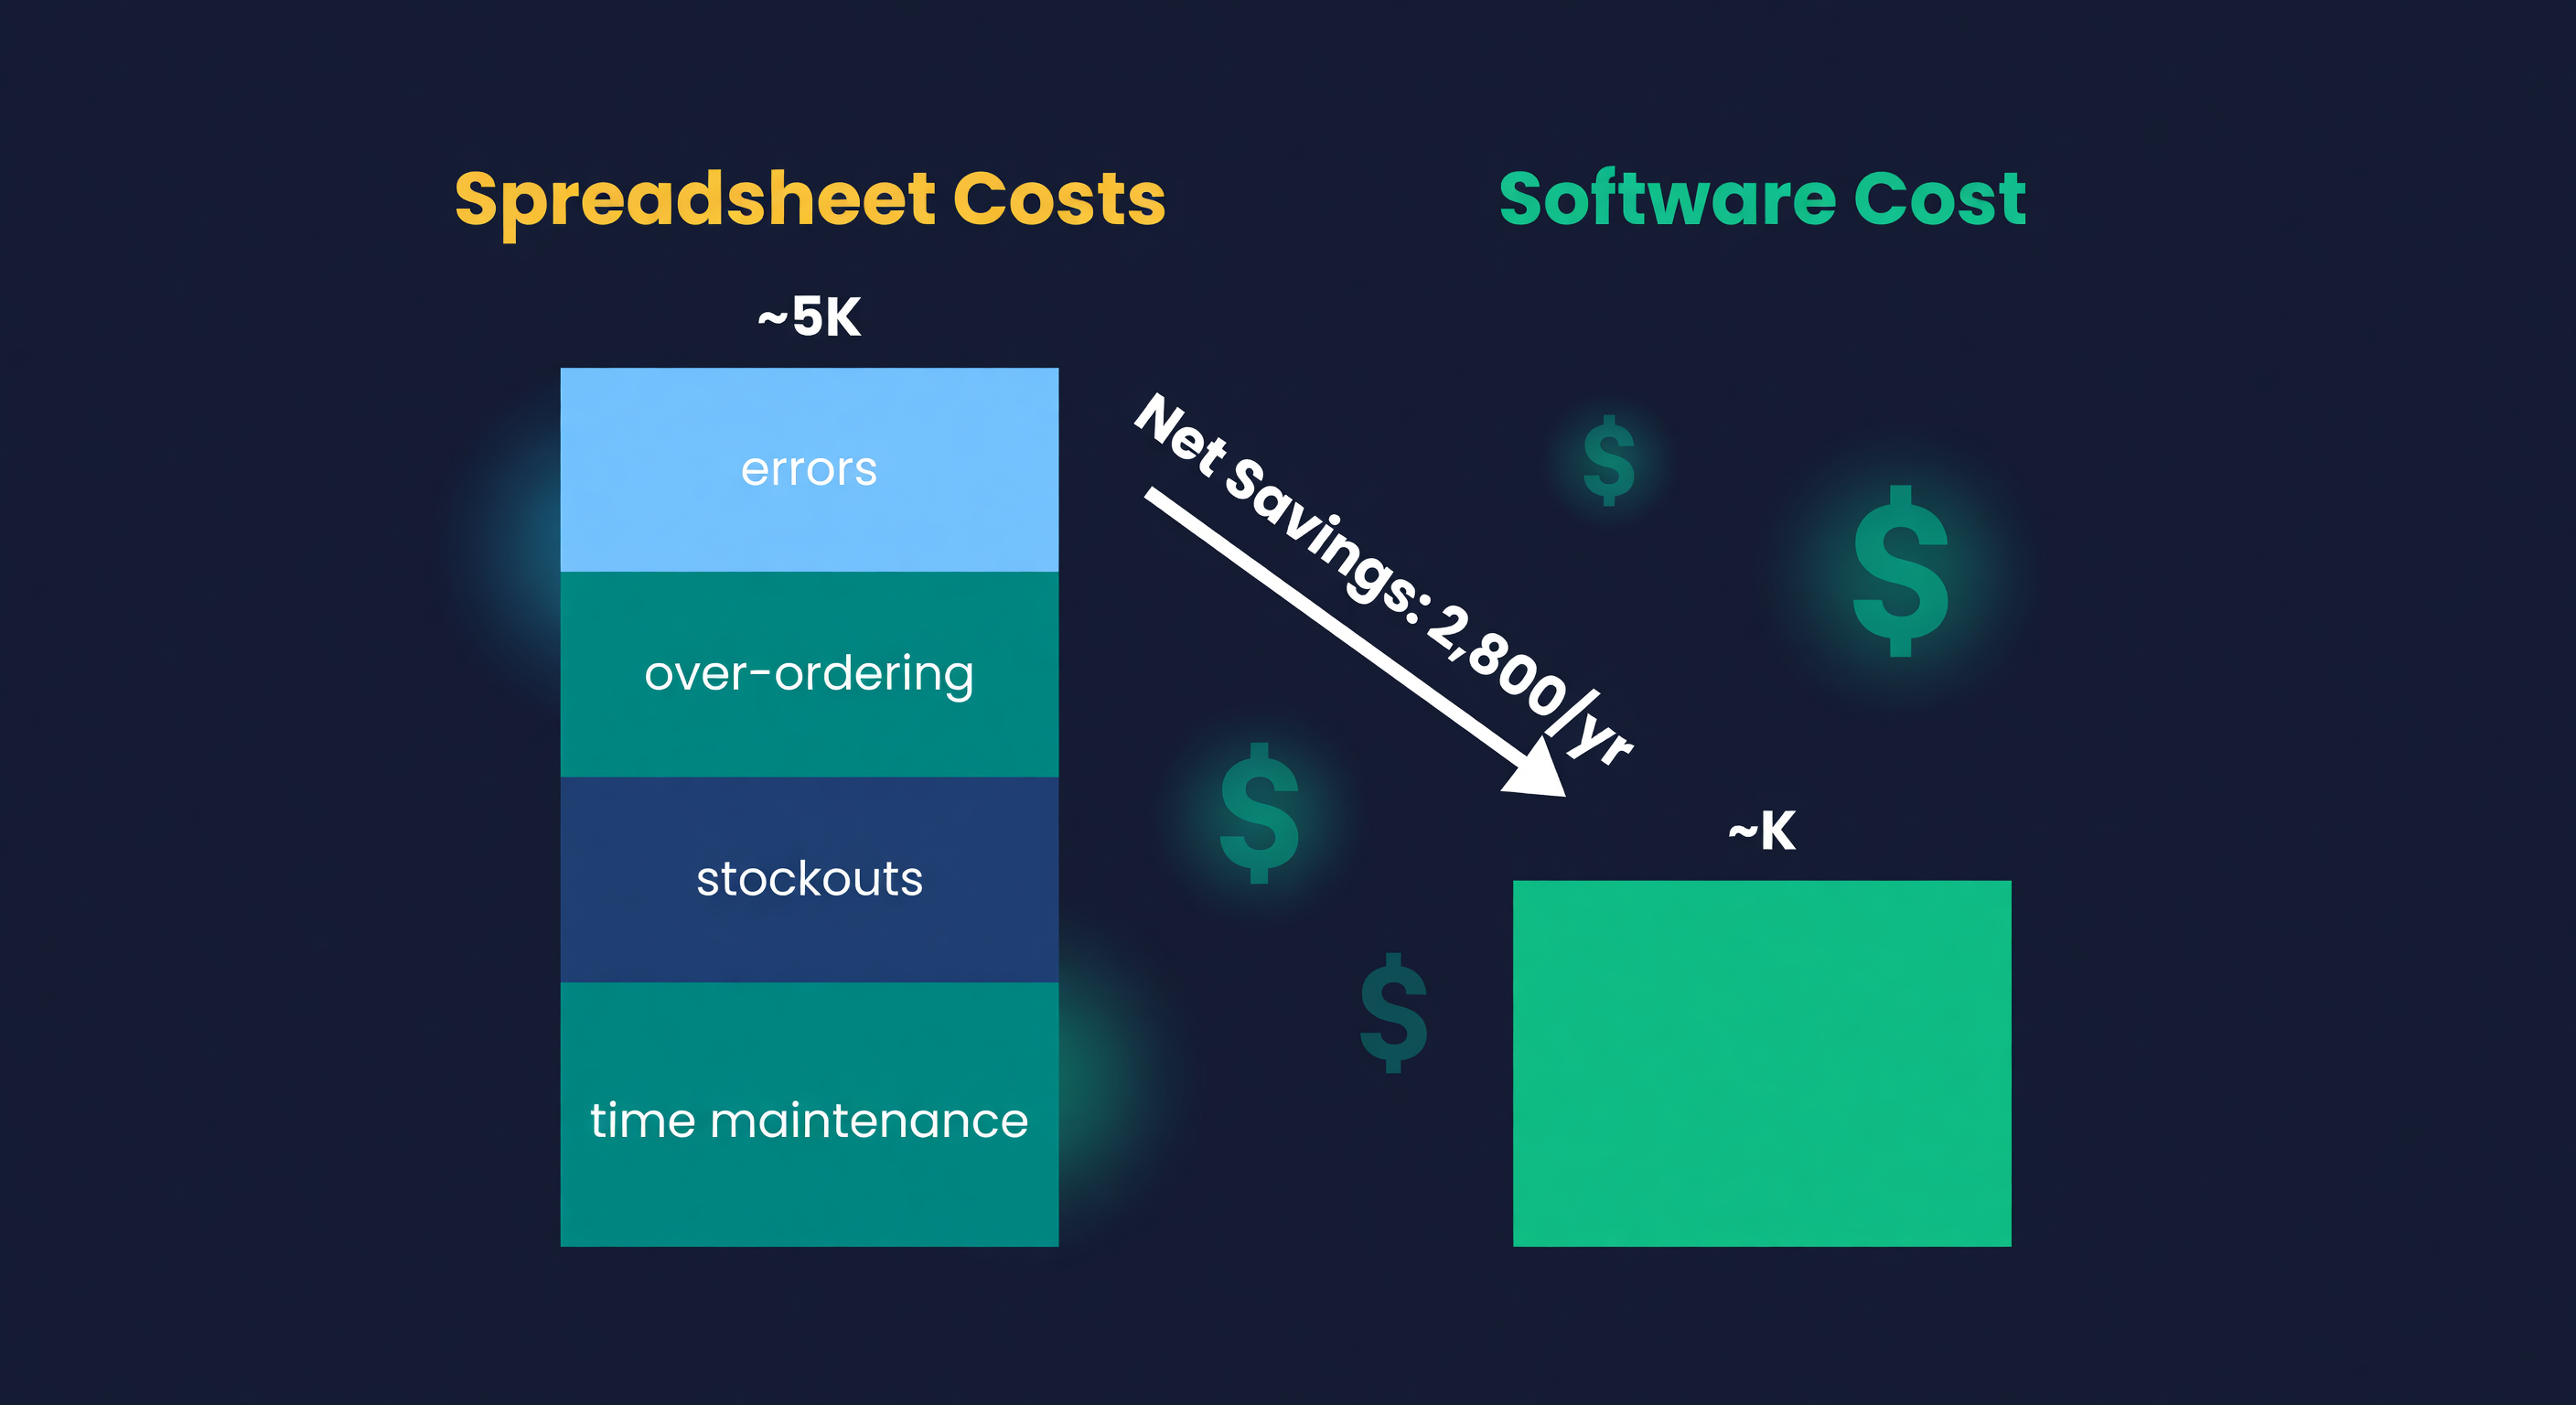
COST OF SPREADSHEETS (annual):
Time maintaining: 6 hrs/week x $50/hr x 52 = $15,600
Stockouts from data lag: 2/month x $200 margin = $4,800
Over-ordering from poor forecasts: ~$3,000
Errors (wrong orders, duplicates): ~$1,500
Total: ~$24,900/year

COST OF SOFTWARE (annual):
Subscription: $100/month x 12 = $1,200
Setup time: 8 hrs x $50/hr = $400
Learning curve (month 1): ~$500
Total: ~$2,100 year 1, ~$1,200 year 2+

NET SAVINGS: ~$22,800 year 1
Your numbers will differ. But compare honestly - including the hidden costs of spreadsheets that do not show up on any invoice.
Common Migration Mistakes
Trying to recreate your spreadsheet in software. Your spreadsheet had workarounds for its limitations. The software does not have those limitations. Learn the new workflow instead of dragging old habits into a new tool.
Not cleaning up data first. Inconsistent product titles or messy SKU mapping? Fix that before migrating. Garbage in, garbage out.
Switching during peak season. Migrate during a calm period. Do not add system uncertainty during your busiest months.
Not setting up alerts. The biggest advantage of software is proactive notifications. If you do not configure reorder and stockout warnings, you are paying for software but still managing reactively.
Skipping the parallel run. One week of running both systems side-by-side is cheap insurance against missing something the spreadsheet caught.
Making the Switch
We built ReplenishRadar for sellers making exactly this transition. Connect your Shopify and Amazon stores - OAuth, takes about two minutes - and the system pulls your sales history, maps your catalog, and generates demand forecasts within hours. No CSV uploads. No manual data entry on day one.
The data comes from your sales channels, which is the same source of truth your spreadsheet was trying to replicate manually. The difference is that ReplenishRadar updates on every sync, not whenever someone remembers to paste in new numbers.
If you are spending more hours maintaining your spreadsheet than it is saving you, the math has already flipped. Try ReplenishRadar free for 14 days ->
Related Reading:
Frequently Asked Questions
Get notified when it matters
Amazon and Shopify change the rules constantly. We'll email you when something affects your business.
See what your inventory is really doing
Doing $5M+ in revenue? Talk to our team
Related Posts
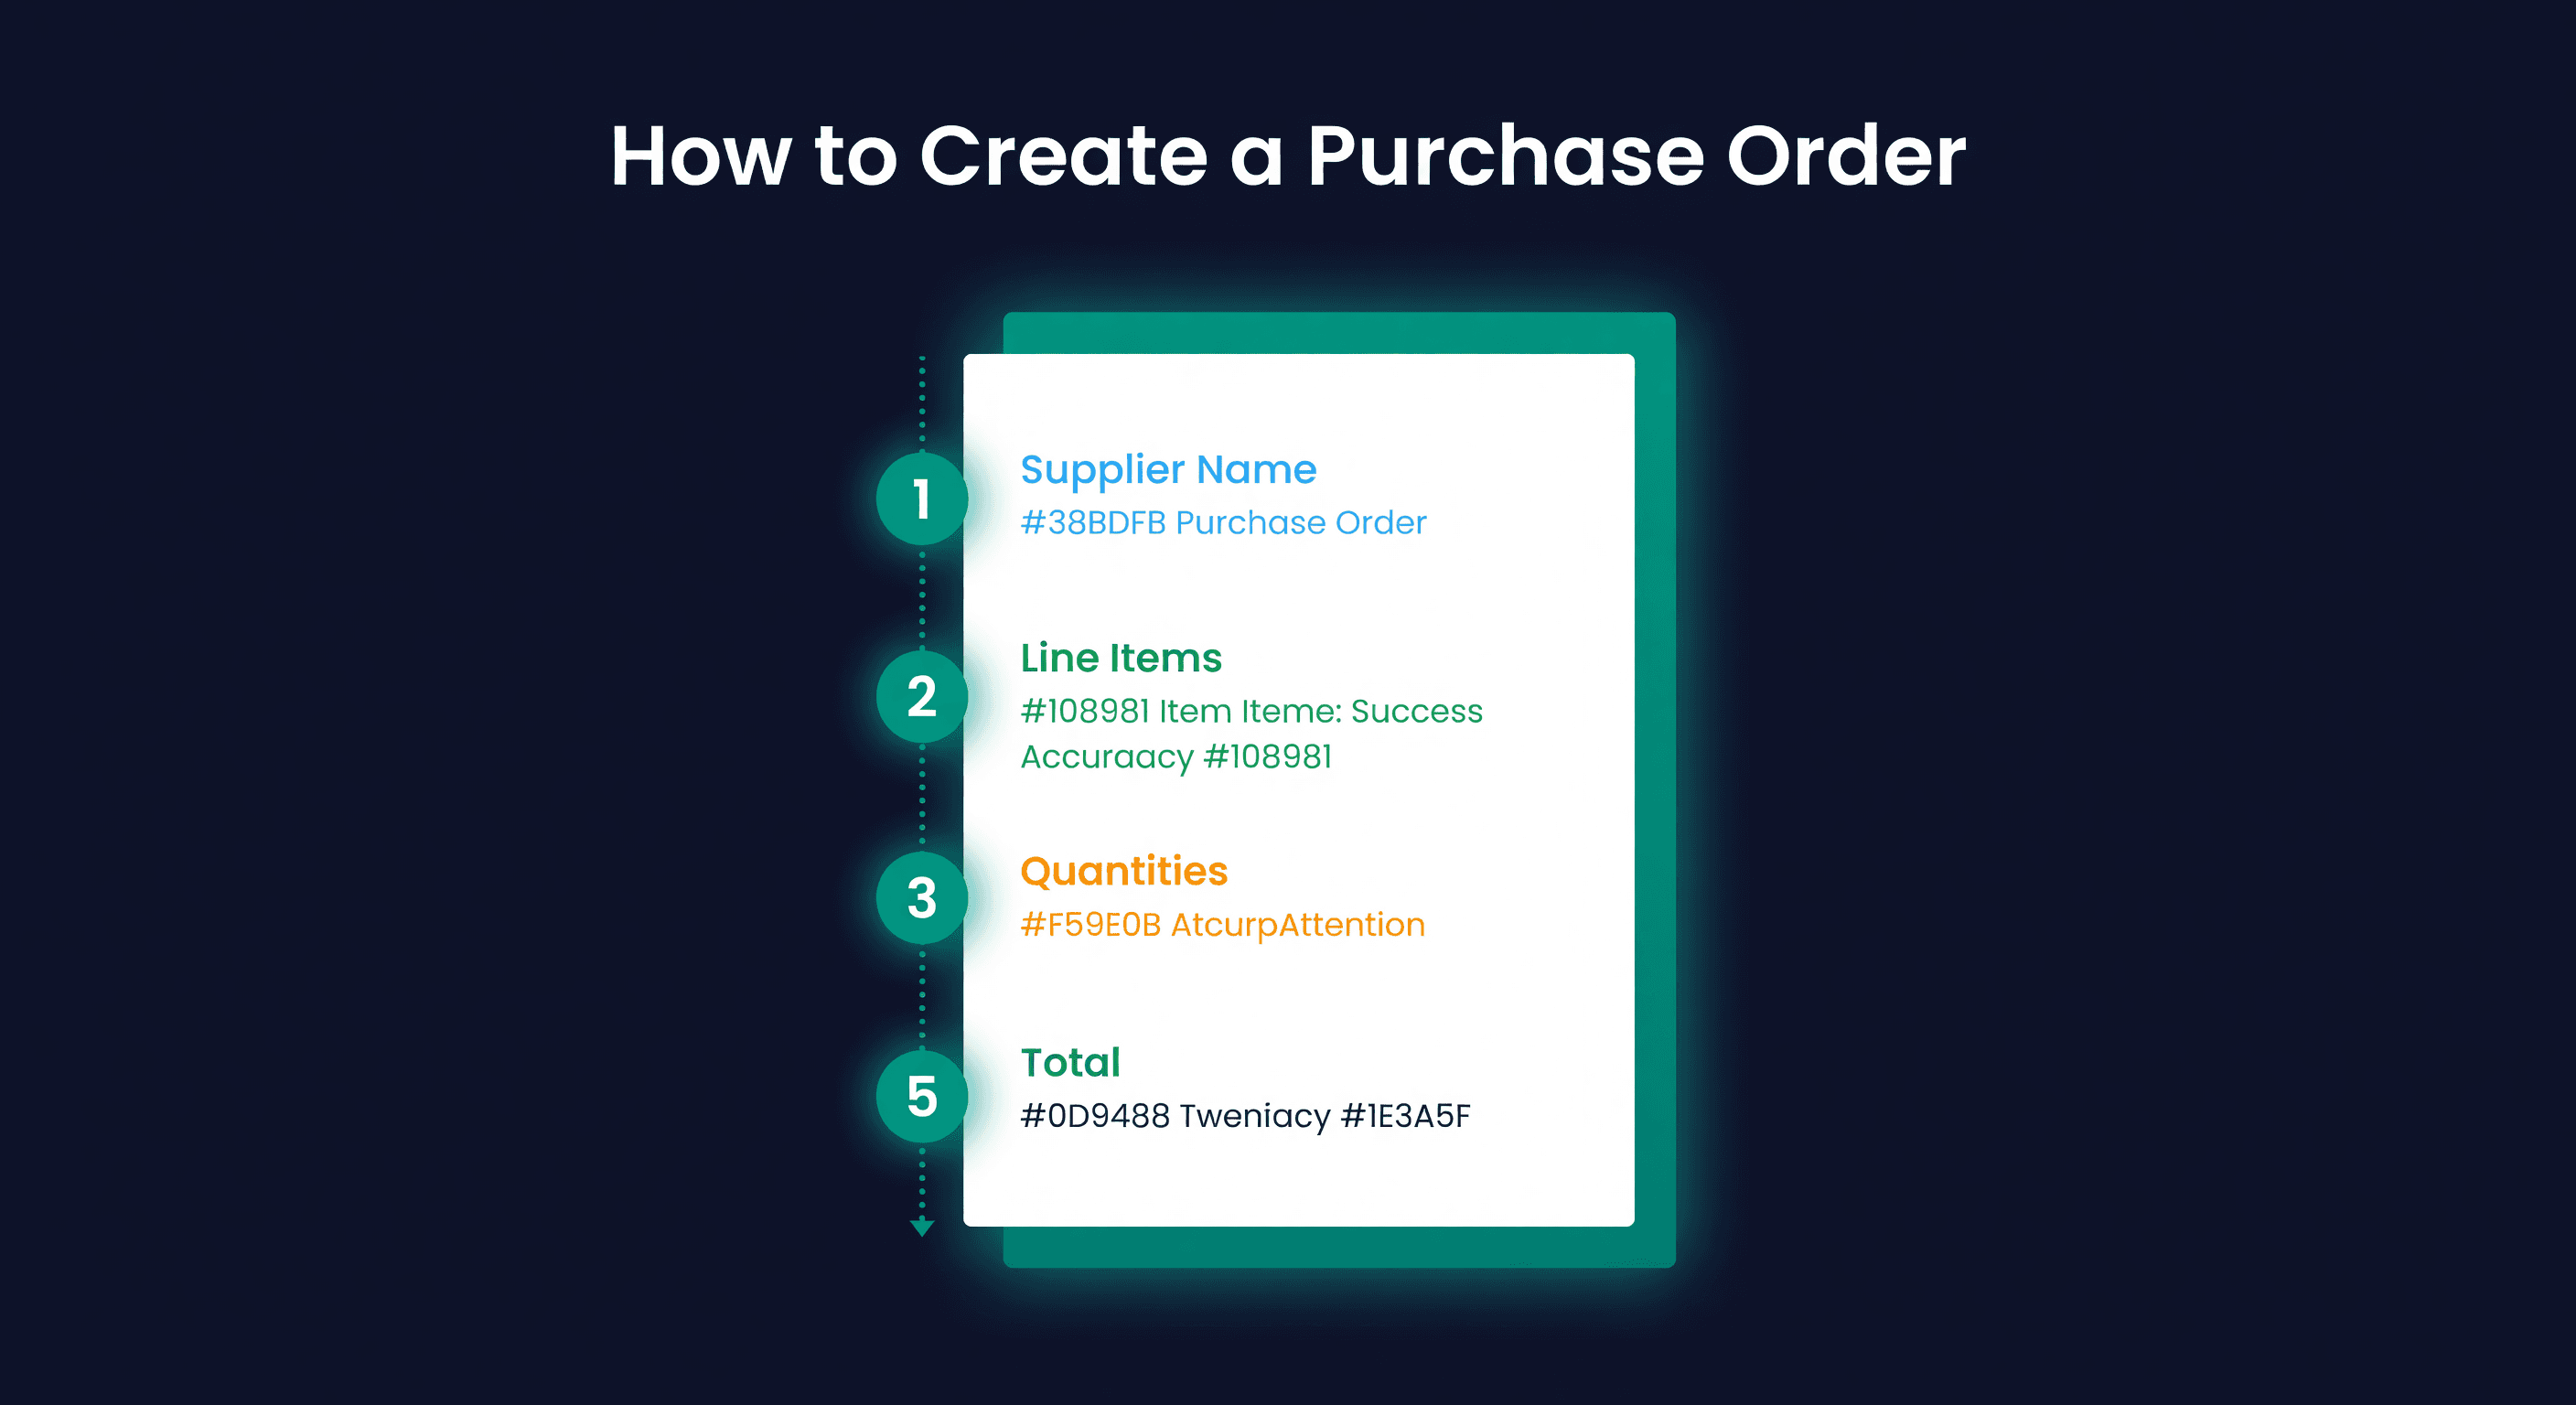
How to Create a Purchase Order (Step-by-Step)
How to create a purchase order for e-commerce, with a PO template, worked examples, and the ordering mistakes that cost sellers thousands.
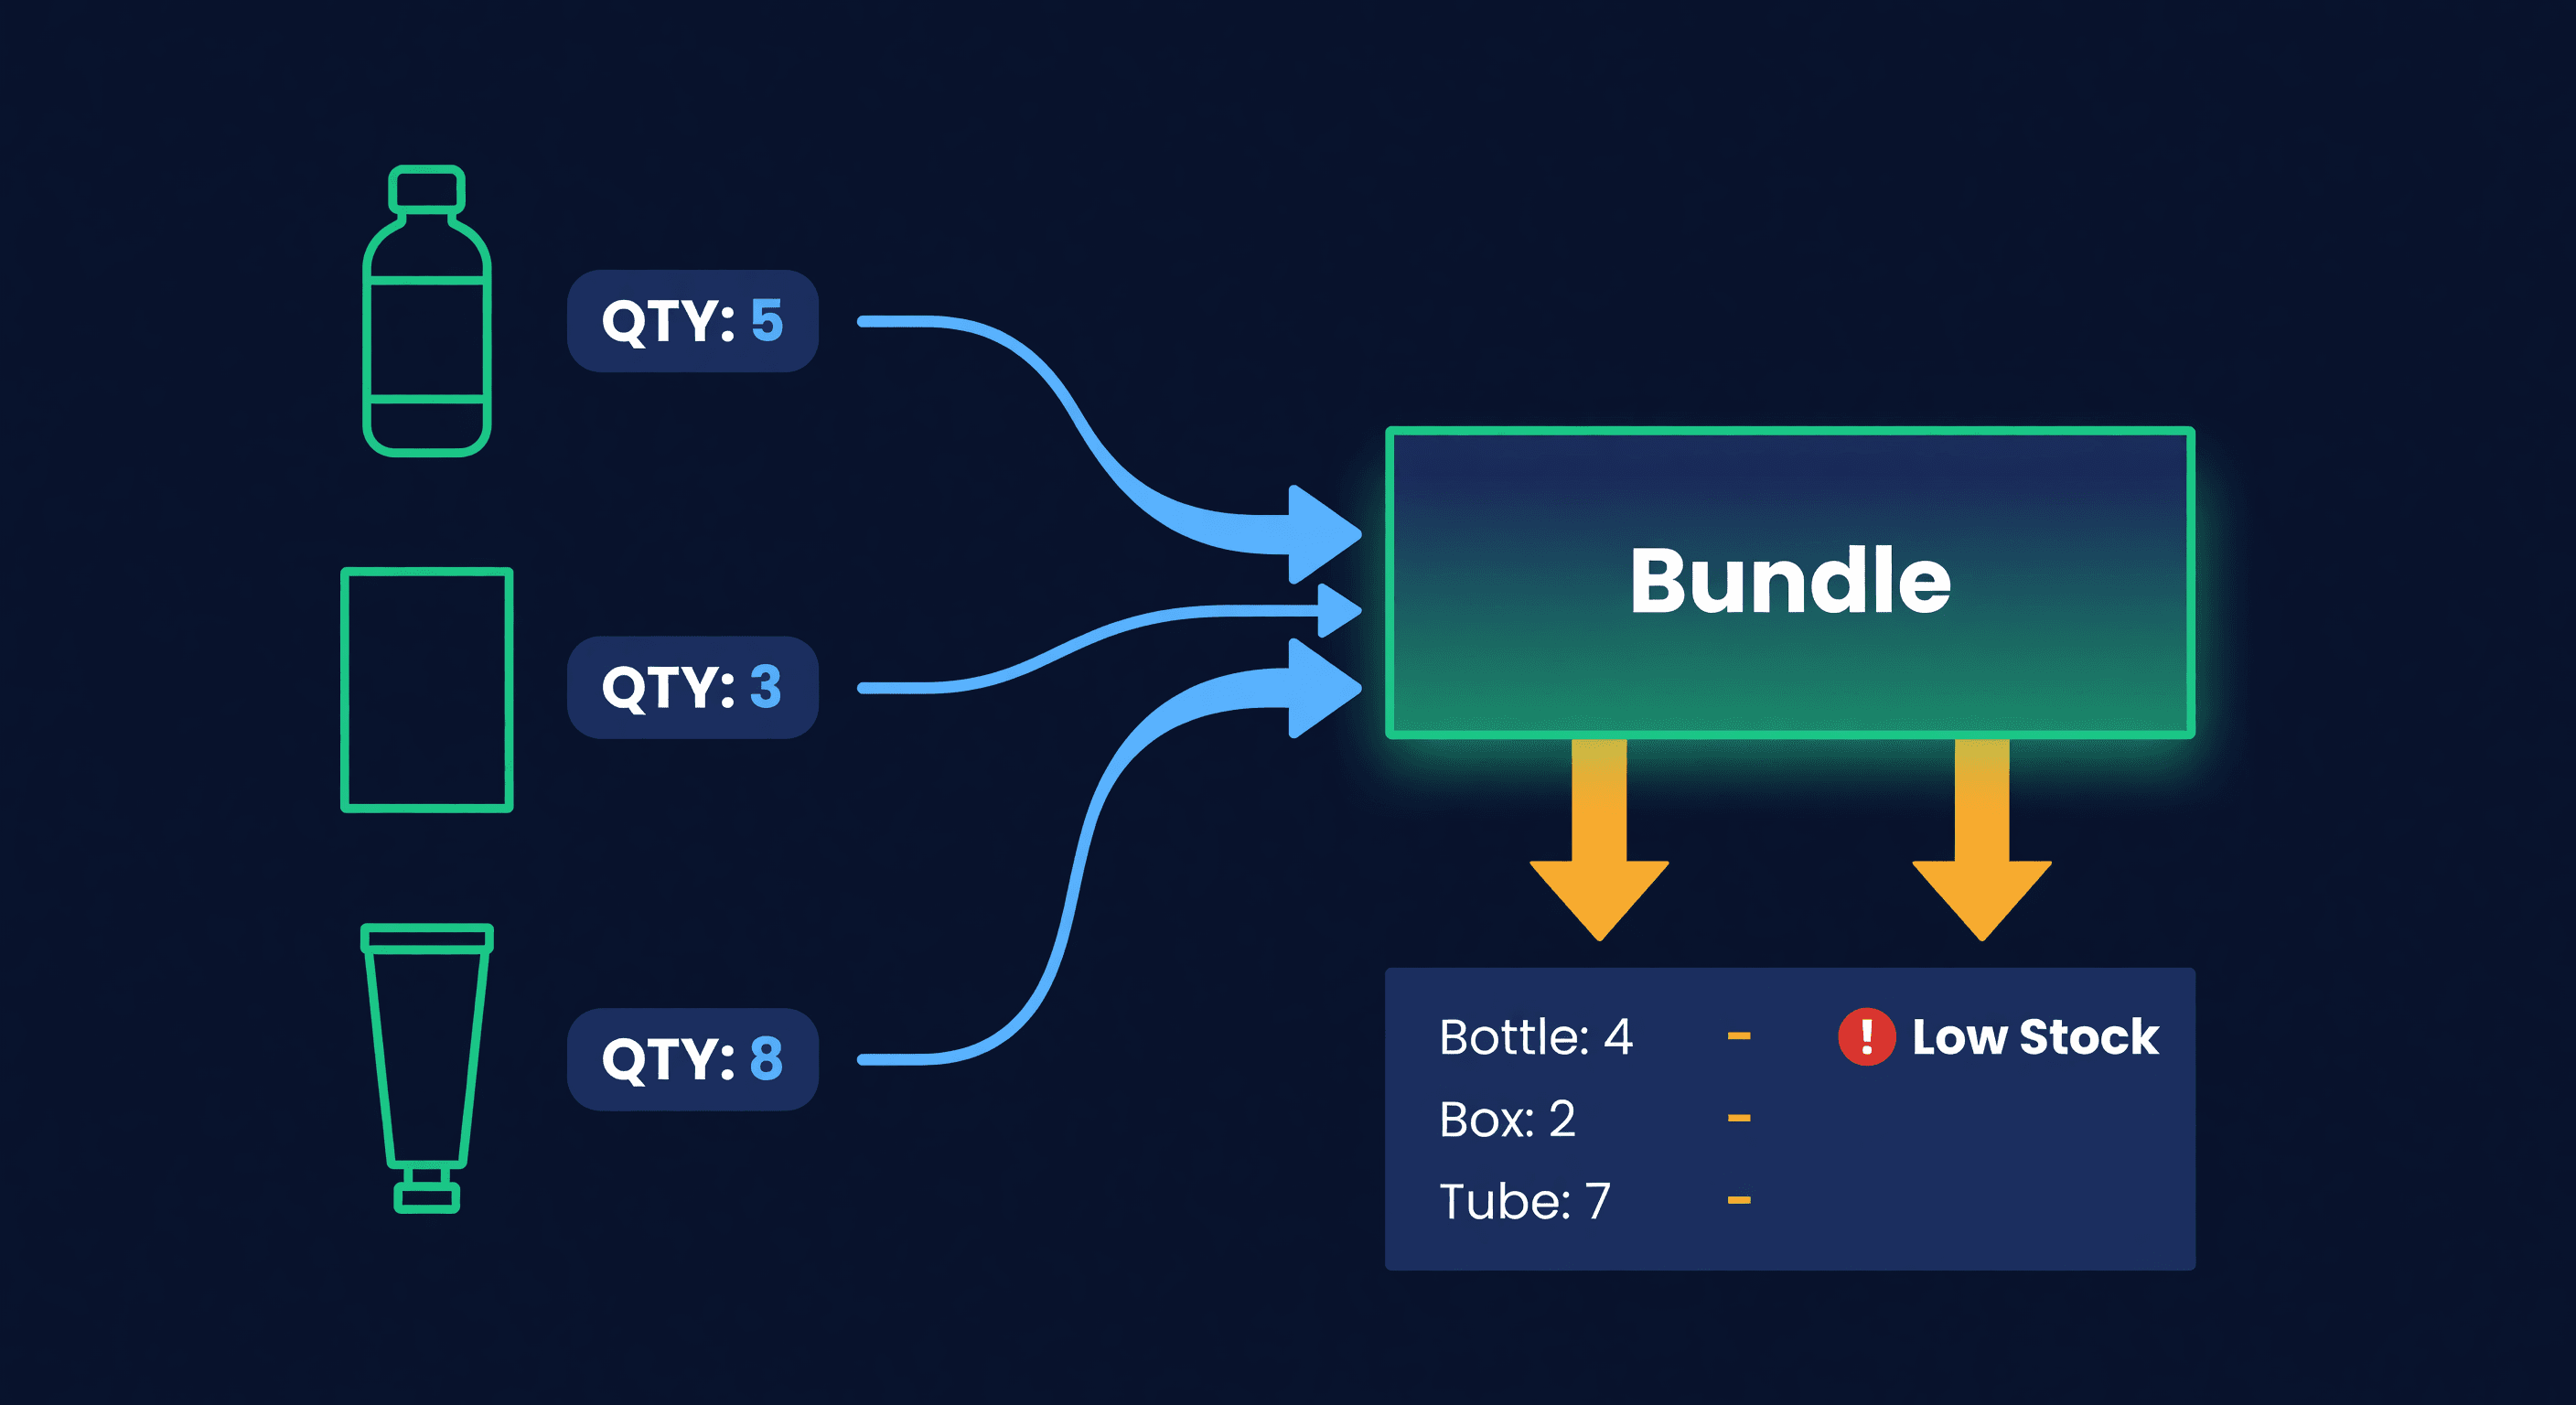
Shopify Bundles and the Inventory Problem
Product bundles sell great. Tracking their inventory is a mess. Here's how to handle component-level stock for Shopify bundles without overselling.
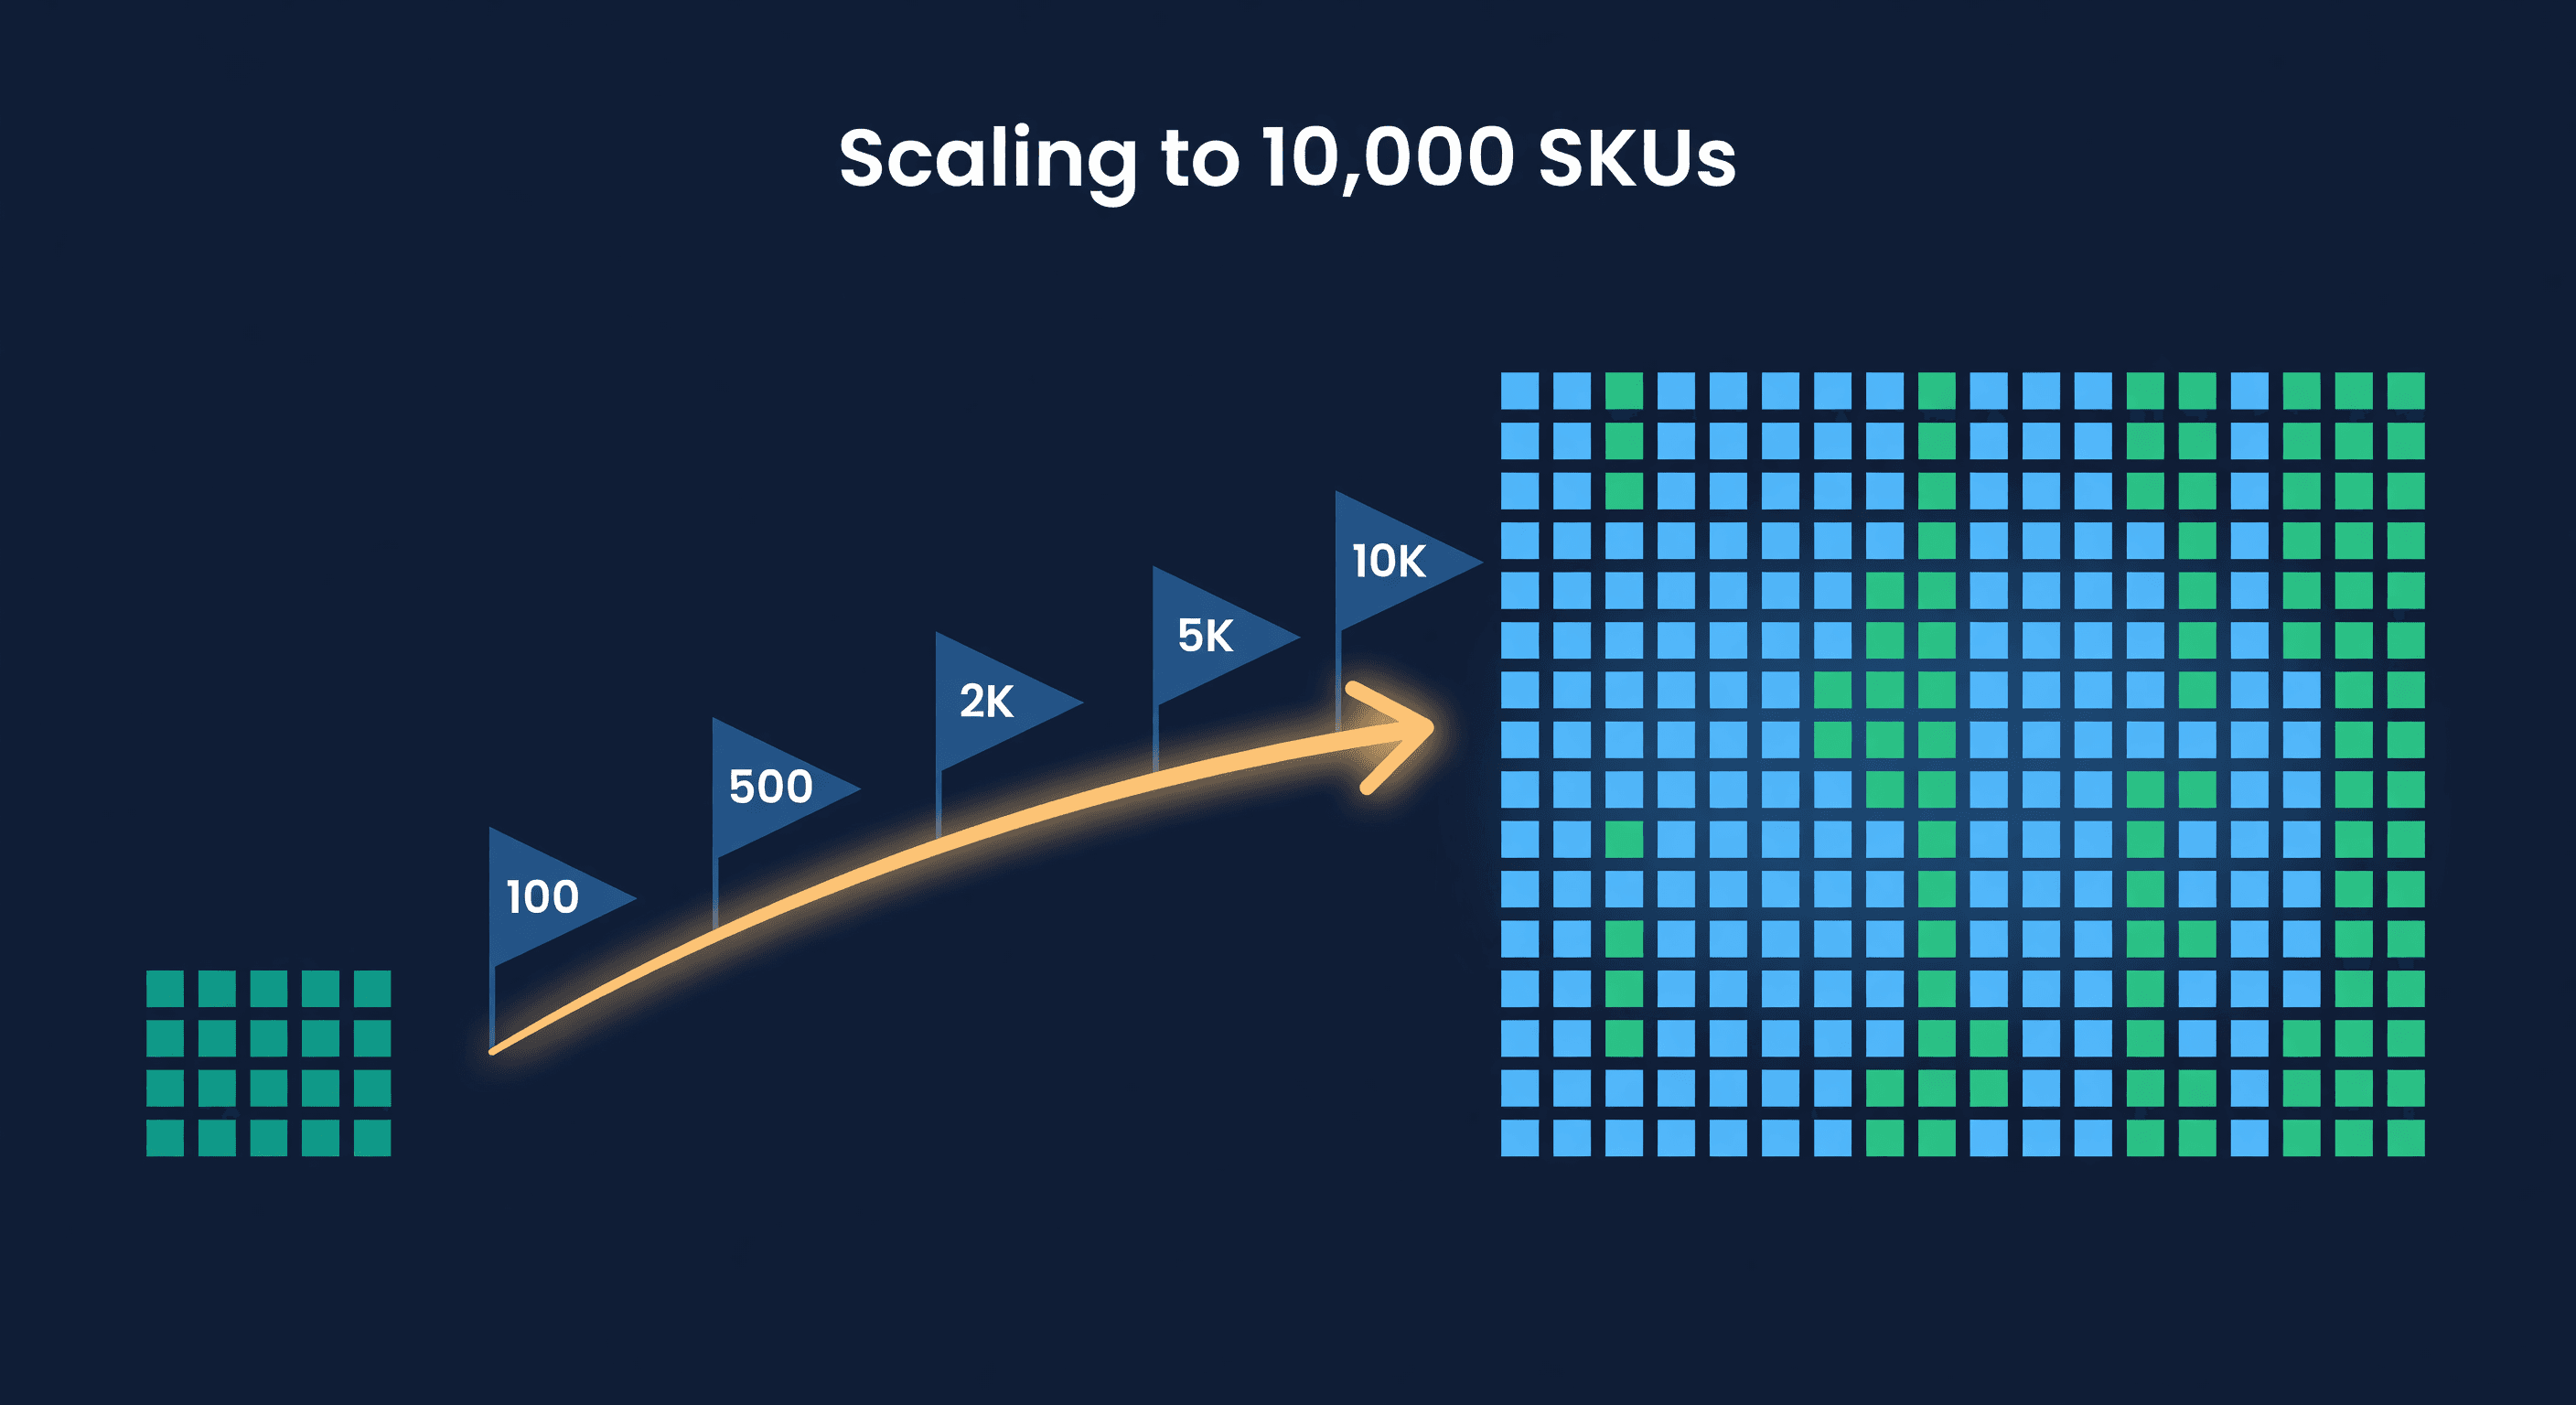
Scaling from 100 to 10,000 SKUs
What breaks at each stage of inventory growth. The systems, processes, and tools you need at 100, 500, 2,000, 5,000, and 10,000 SKUs.
