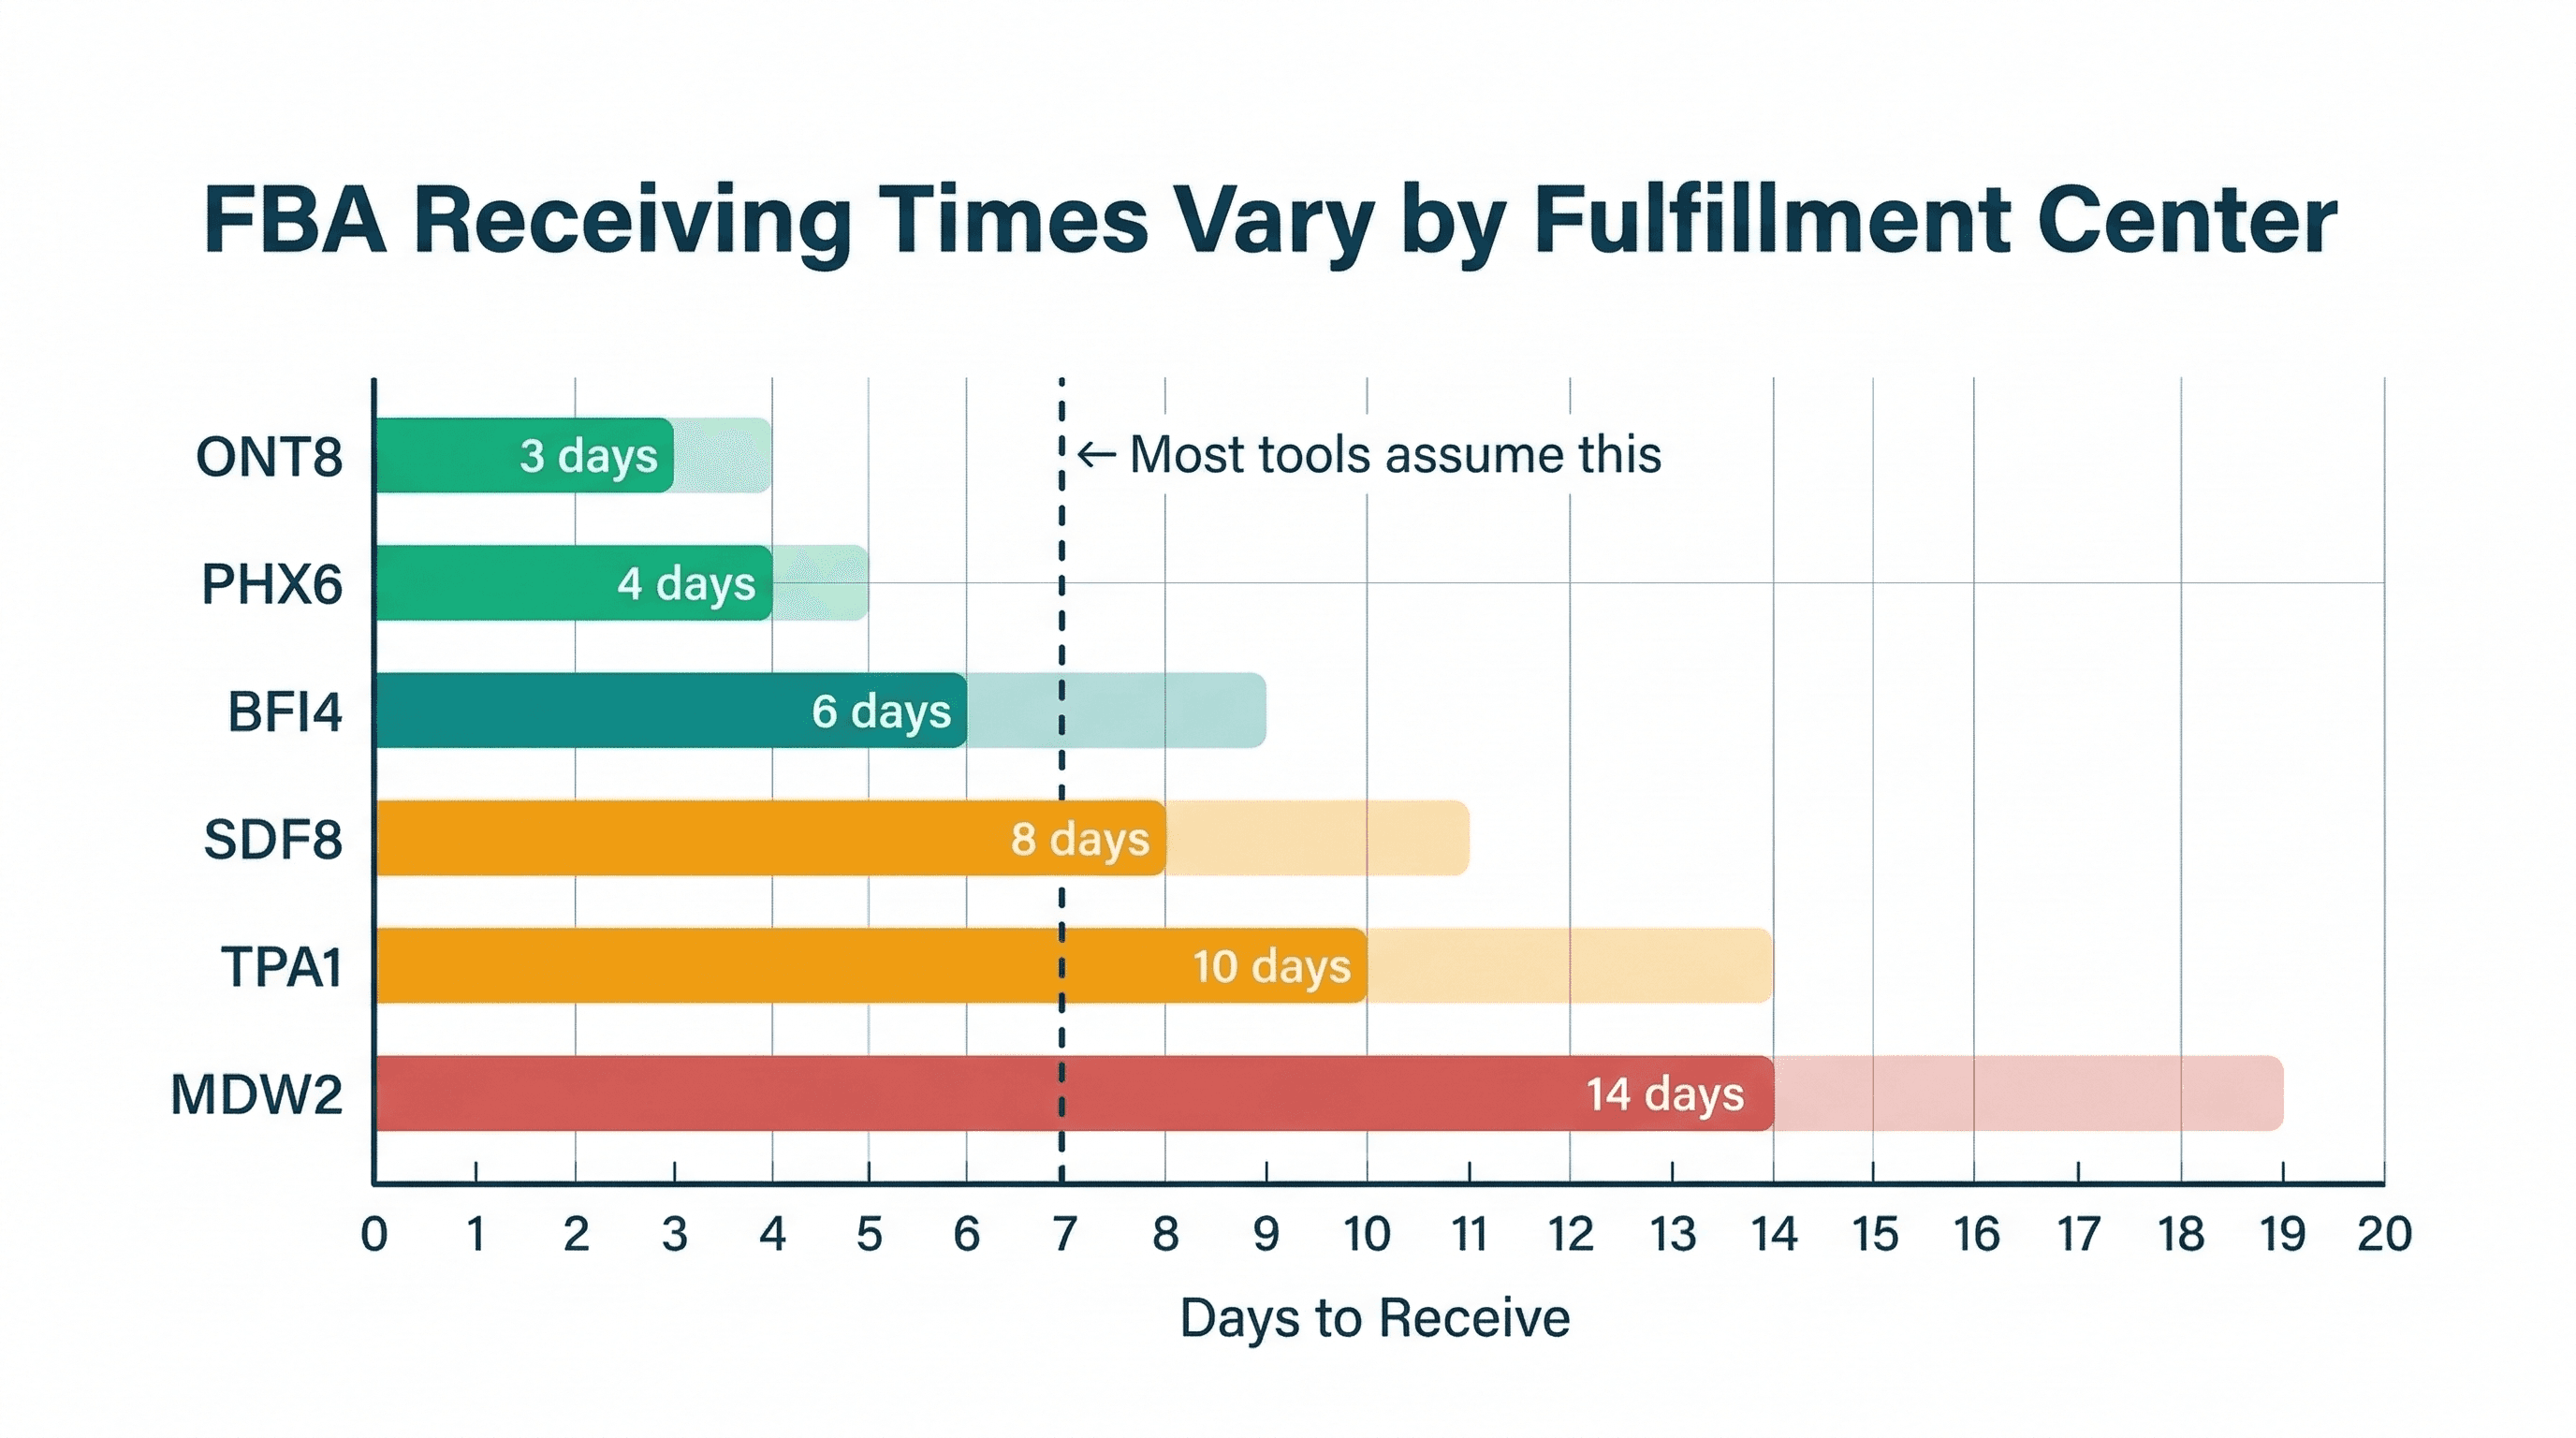
FBA Receiving Times by Fulfillment Center
Your FBA Lead Time Is Wrong
Not approximately wrong. Structurally wrong. Every seller I talk to has a single number in their head for FBA receiving time. "Amazon takes about a week to check in." "My shipments usually get received in 5 days." They plug that number into their reorder point calculation and call it done.
The problem: Amazon does not have one receiving time. It has dozens. Every fulfillment center operates at its own pace, with its own backlog, and Amazon decides which FC gets your shipment when you create the inbound plan. You do not pick. They pick.
Picture two identical pallets shipped on the same day. One lands at a fulfillment center that receives and stows it in 4 days. The other sits in a receiving queue for 13. Same product, same carrier, same day, nine days apart, and nothing in your spreadsheet would have told you which pallet was which.
A gap like that is the normal shape of the problem, not an edge case.
The Variance Is Enormous
Here is a representative sample of what receiving times look like across six fulfillment centers. These numbers are hypothetical, built to illustrate the spread, not measured from any account or published by Amazon:
| Fulfillment Center | Avg Receiving (days) | P90 Receiving (days) | Fastest | Slowest |
|---|---|---|---|---|
| FC-A (Inland Empire, CA) | 4 | 7 | 2 | 9 |
| FC-B (Dallas-Fort Worth, TX) | 5 | 8 | 3 | 11 |
| FC-C (Nashville, TN) | 7 | 11 | 4 | 14 |
| FC-D (Carteret, NJ) | 9 | 14 | 5 | 18 |
| FC-E (Lakeland, FL) | 11 | 16 | 6 | 21 |
| FC-F (Joliet, IL) | 13 | 19 | 7 | 25 |
Look at the spread. FC-A averages 4 days. FC-F averages 13 days. Same Amazon, same receiving process, nine days apart on average. At the P90 level, which is the number you should plan around if you care about not stocking out, the gap widens to 12 days.
And this is the average. During peak season, the slow FCs get slower while the fast ones hold relatively steady.
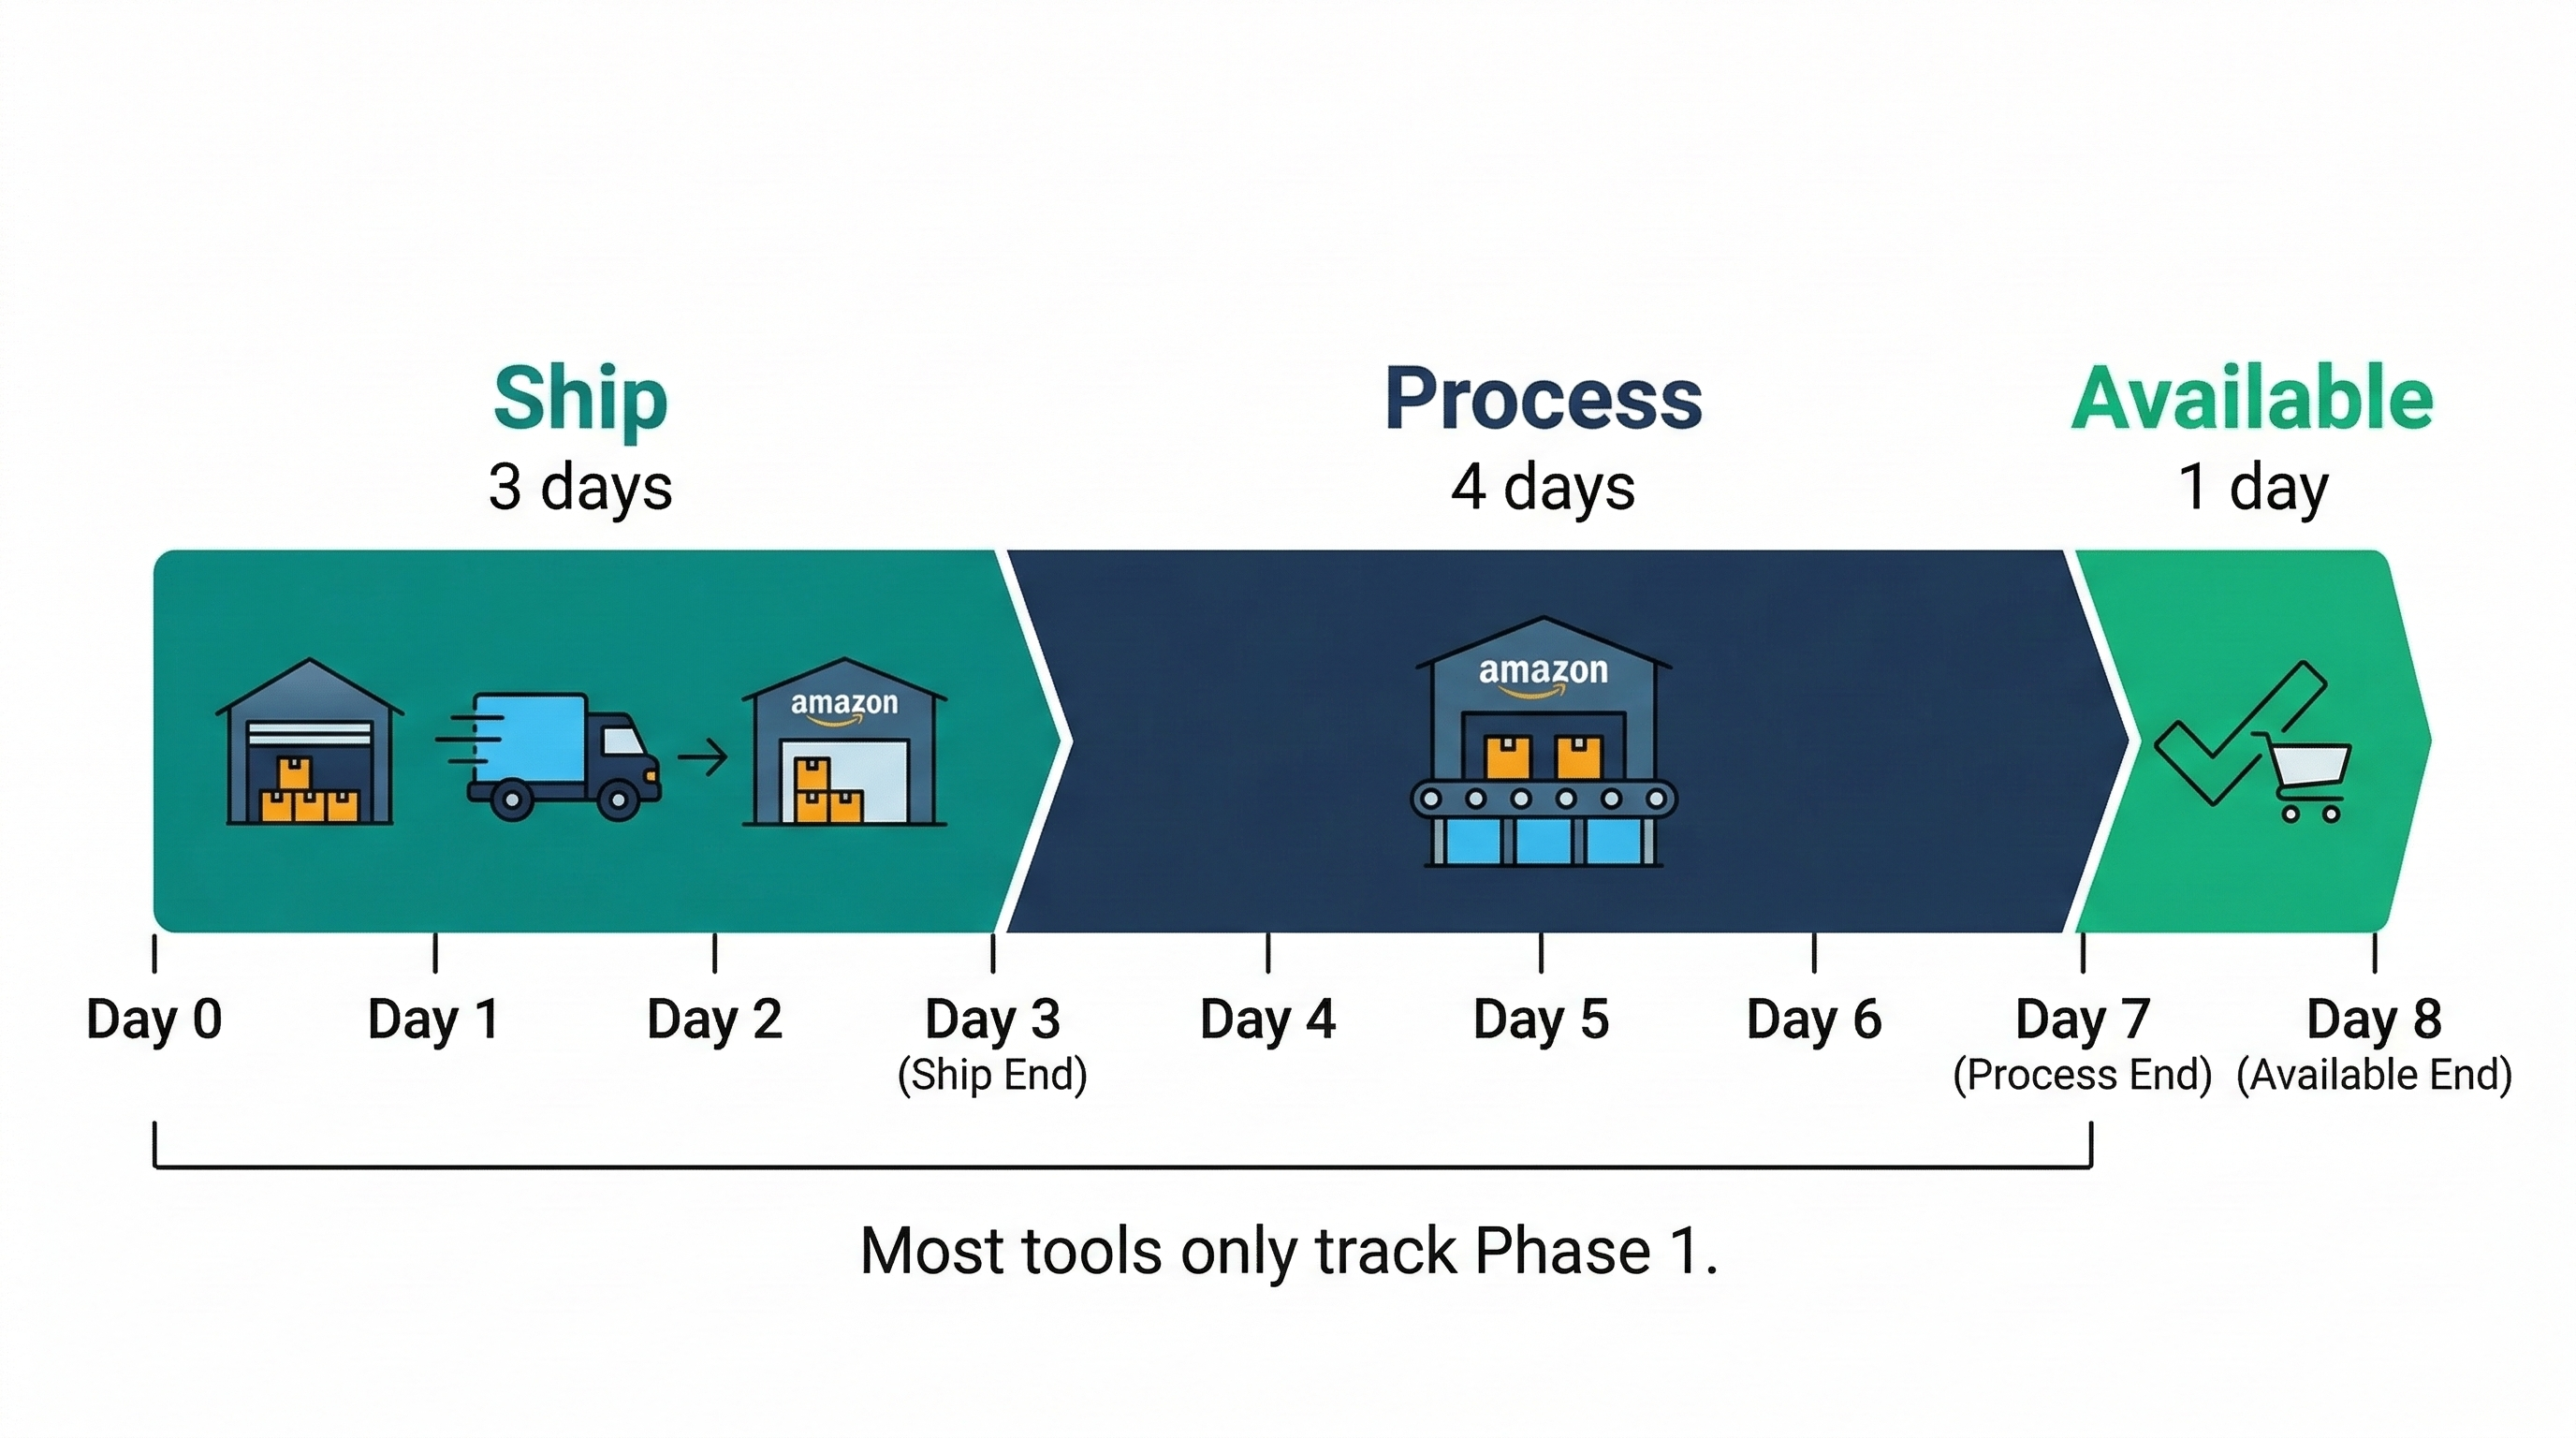
Delivered Is Not Received, and Received Is Not Sellable
Before you can measure receiving time, you have to agree on when the clock stops. Amazon gives you several milestones, and only the last one puts units in front of a customer.
Amazon's inventory notification docs count a shipment as inbound while it is shipped, in transit, delivered, or checked in. Units that have physically arrived and are being processed for receipt get their own receiving count. Neither one is fulfillable. The FBA Inventory API reserves "fulfillable" for units that can be picked, packed, and shipped.
That matters for planning in one specific way. A delivered or receiving shipment is expected supply, not stock you can sell now. If your reorder math counts it as on hand the moment the carrier scans it at the dock, you are borrowing days you do not have yet. I would stop the clock at fulfillable, every time, and treat everything before that as lead time.
Even after receipt, some units can sit in reserved instead of fulfillable. Amazon reports three separate reserved reasons: sidelined for warehouse processing, moving to another Amazon warehouse, and pending a customer order. Those are different causes, so do not read every reserved unit as a slow receiving dock. If your listing shows out of stock while units sit in one of these buckets, check the fulfillable count first: that is the only number a customer can buy from.
Expiry Dates Change How You Pack
If you sell anything with an expiration date, there is one packing rule that is easy to miss when you are building boxes in a hurry. Amazon's listShipmentBoxes reference states it directly: the same merchant SKU with different expiration dates cannot go into the same box.
So two lots of the same supplement, one expiring in March and one in June, are two box contents even though they share a SKU. Record the lot, the date, and the unit count per box before the shipment leaves, and keep that record with the shipment. It is a five-minute habit at the packing table, and it is far cheaper than finding out after a box is already sealed and labelled.
Why This Wrecks Your Planning
Most inventory planning tools treat FBA as a single destination with a single lead time. You enter "7 days for FBA receiving" and the system uses that number for every reorder calculation. This is wrong in a specific, quantifiable way.
Say you sell 20 units per day of a product. Your supplier ships in 14 days. You have your reorder point set to cover a total FBA lead time of 21 days (14 days supplier + 7 days FBA receiving).
Now Amazon assigns your shipment to FC-F instead of your assumed "average" FC.
Expected total lead time: 14 + 7 = 21 days
Actual total lead time:   14 + 13 = 27 days
Gap: 6 days
Lost sales: 6 days x 20 units/day = 120 units
At a $12 margin per unit, that is $1,440 in lost profit from a single shipment going to a slow FC. Not because you did anything wrong. Because your planning assumed a 7-day average and reality handed you a 13-day FC.
This works in reverse too. If you pad your safety stock to handle the slow FCs and then get assigned to FC-A, you are sitting on 6-9 extra days of inventory you did not need. At $8 cost per unit and 20 units per day, that is $960-$1,440 in unnecessary working capital tied up per SKU.
The Planning Error Compounds
The single-number problem gets worse when you account for how safety stock formulas work. Your safety stock calculation includes a term for lead time variability. If you are measuring variability across all your shipments without segmenting by FC, your standard deviation is artificially inflated.
Here is what I mean. Say your last 12 shipments received across various FCs looked like this:
Receiving times: 4, 12, 6, 14, 5, 9, 11, 4, 13, 7, 5, 10

Average: 8.3 days
Standard deviation: 3.6 days
That 3.6-day standard deviation drives a large safety stock buffer. But the variance is not random. It is systematic, because it depends on which FC Amazon assigns. If you could predict the FC (you cannot), the per-FC variance would be much tighter:
Fast FCs (4, 6, 5, 4, 5): Avg 4.8, SD 0.8
Slow FCs (12, 14, 9, 13, 10): Avg 11.6, SD 1.9
Middle (11, 7): Avg 9.0, SD 2.8
The within-FC variance is dramatically lower than the across-FC variance. You are not dealing with one unpredictable system. You are dealing with several mostly-predictable systems, and the unpredictable part is which system Amazon picks for you.
Seasonal Amplification
FC receiving times are not static. They shift with volume. Here is an illustrative year, built on the same hypothetical FCs as the table above:
| Period | Fast FC Avg | Slow FC Avg | Gap |
|---|---|---|---|
| January-March | 3 days | 10 days | 7 days |
| April-June | 4 days | 12 days | 8 days |
| July (Prime Day buildup) | 5 days | 16 days | 11 days |
| August-September | 4 days | 13 days | 9 days |
| October-November (Q4 buildup) | 6 days | 19 days | 13 days |
| December | 5 days | 15 days | 10 days |
During Prime Day prep and Q4 ramp-up, the slow FCs choke. Receiving queues balloon because every seller is shipping more freight at the same time. The fast FCs tend to handle the surge better.
If your reorder calculations use a flat 7-day FBA receiving estimate year-round, you are under-buffered during the exact periods when stockouts hurt the most.
The Dollar Impact on an Example Catalog
I want to put a number on this. Take a seller with 40 FBA ASINs averaging 15 units/day each, with a $10 margin per unit. They plan around a 7-day FBA receiving time.
Over a year, roughly 30% of their shipments go to slow FCs (10+ day receiving). On those shipments, the average overshoot is 5 days beyond their planned receiving time.
These inputs are assumptions chosen to show the math, not measured results from any seller or from ReplenishRadar data.
Shipments per year (biweekly per ASIN): 40 x 26 = 1,040
Shipments to slow FCs (30%): 312
Average delay beyond plan: 5 days
Units short per delayed shipment: 5 x 15 = 75
Percentage that results in actual stockout: ~40%
Stockout events: 312 x 0.40 = 125
Average stockout duration: 3 days
Lost sales per event: 3 x 15 x $10 = $450
Annual cost: 125 x $450 = $56,250
That number is rough. It assumes partial stockouts because safety stock absorbs some of the delay. But even if I am off by 50%, a $28,000 annual drag from a planning assumption you can fix is not trivial.
What You Can Measure
You cannot control which FC Amazon assigns. But you can measure what actually happens.
Track receiving time per shipment. For every FBA shipment, record: the date you shipped, the date the units became fulfillable, and the FC it went to. After 20-30 shipments, patterns emerge. Some FCs consistently receive in 3-5 days. Others consistently take 10-14.
Build a per-FC profile. Group your shipments by FC. Calculate the average and P90 for each. This is the data your planning should use, rather than a single blended number.
Weight by assignment frequency. If Amazon sends 40% of your shipments to three fast FCs and 60% to a dozen slower ones, your "expected" receiving time is not the simple average across all FCs. It is the weighted average based on where your shipments actually go. And the safety stock needs to cover the variance, not the average.
ReplenishRadar records your inbound shipment milestones by fulfillment center. Those milestones do not show when units became fulfillable, so confirm the current fulfillable count before you treat a shipment as sellable. Try it free for 14 days ->
Two Approaches That Help
Stagger shipments to shorten the pain. Instead of one large monthly shipment that lives or dies on a single FC assignment, send smaller shipments every 10-14 days. If one hits a slow FC, the next might hit a fast one. The blended result is closer to your expected average. The trade is a higher shipping cost per unit, so run it on your top ASINs first and compare the freight bill against the stockout days you were carrying.
Pay for fewer splits selectively. When you create an inbound plan, Amazon offers placement options, and the ones that send your shipment to fewer locations carry an inbound placement fee. Check the current rate in Seller Central on the day you build the plan, because Amazon sets it by size and option. Fewer splits do not guarantee a fast FC, but they do put more of your shipment on one receiving timeline instead of three. On high-margin, high-velocity products, the fee can be worth the predictability. On $8 widgets selling 3 units a day, it rarely is.
Stop Treating Amazon as One Warehouse
Amazon's fulfillment network is not one warehouse. It is 110+ warehouses, each with its own throughput characteristics, staffing levels, and receiving queue depth. When you plan your FBA restocking around a single "FBA receiving time" number, you are averaging over a system that does not behave like an average.
The sellers who get this right track per-FC performance, adjust their buffers based on assignment patterns, and accept that some shipments will be fast and some will be slow. The sellers who get this wrong use a flat 7-day estimate, stock out when they draw a slow FC, and blame Amazon for being unpredictable.
Amazon is not unpredictable. The variance is consistent. You just have to measure it.
Related Reading:
Frequently Asked Questions
Get notified when it matters
Amazon and Shopify change the rules constantly. We'll email you when something affects your business.
See what your inventory is really doing
Doing $5M+ in revenue? Talk to our team
Related Posts
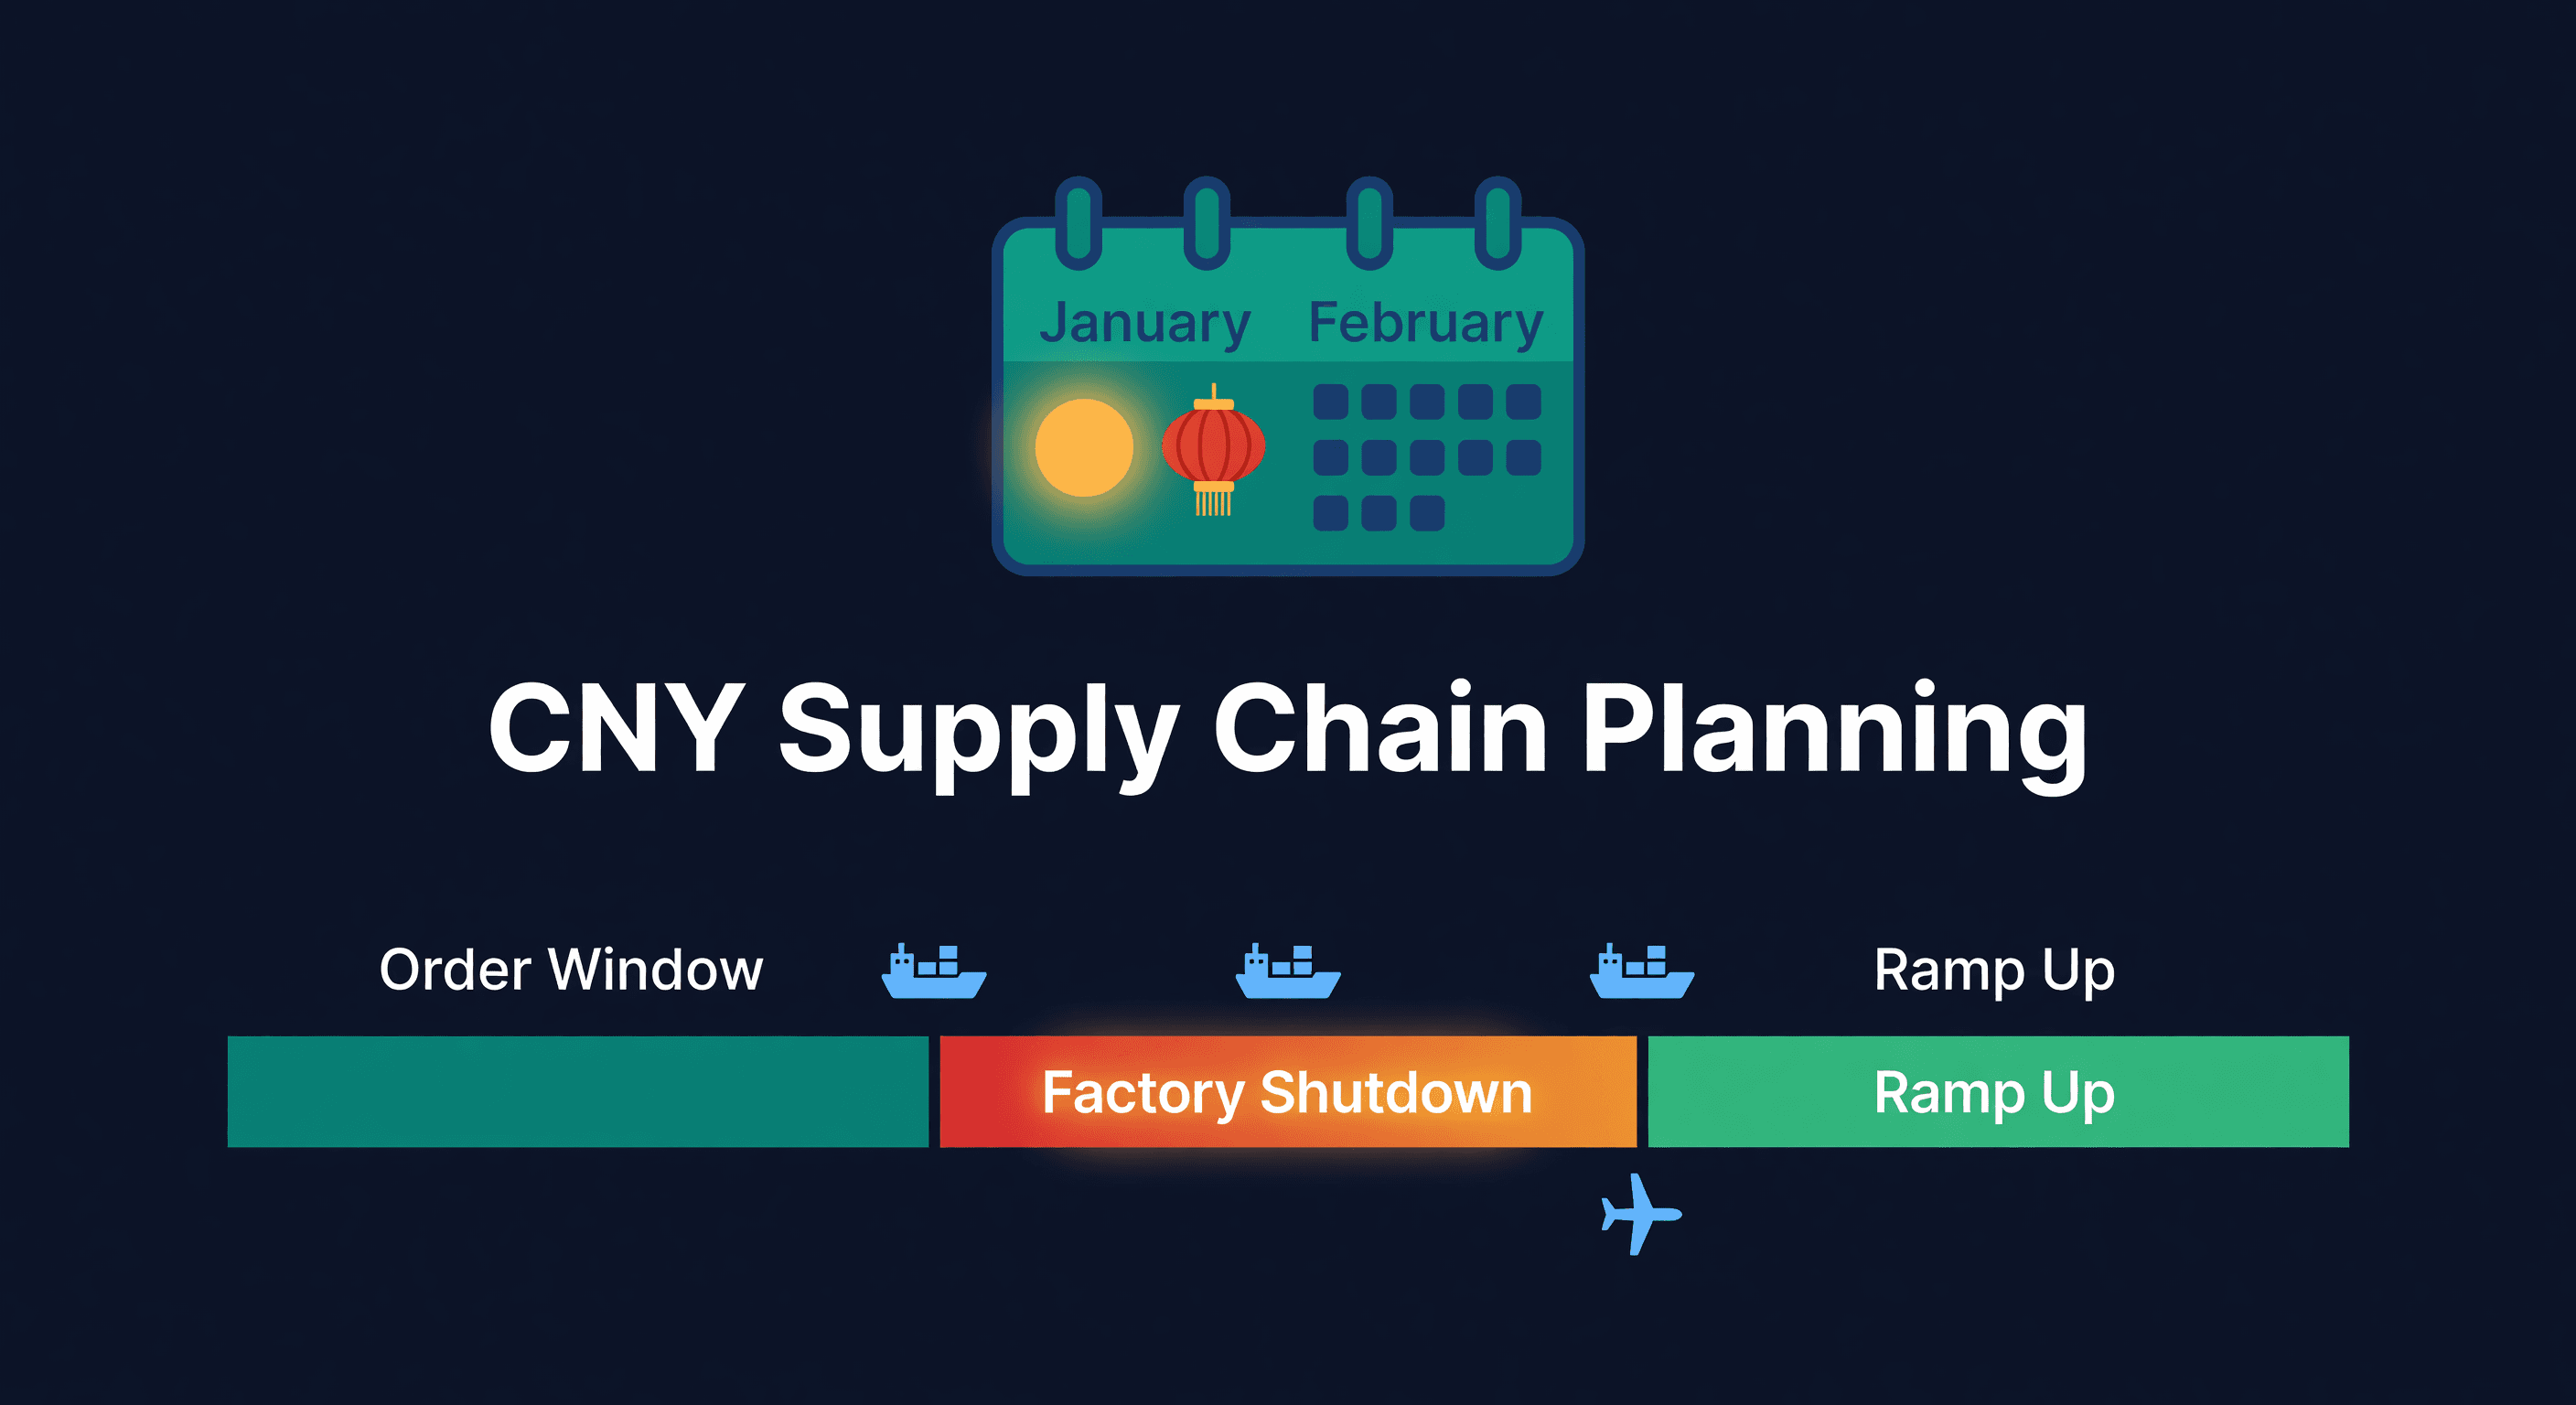
Chinese New Year Supply Chain Planning Guide
How to plan inventory around Chinese New Year factory shutdowns. Timelines, buffer calculations, and the mistakes that leave sellers out of stock for 6 weeks.
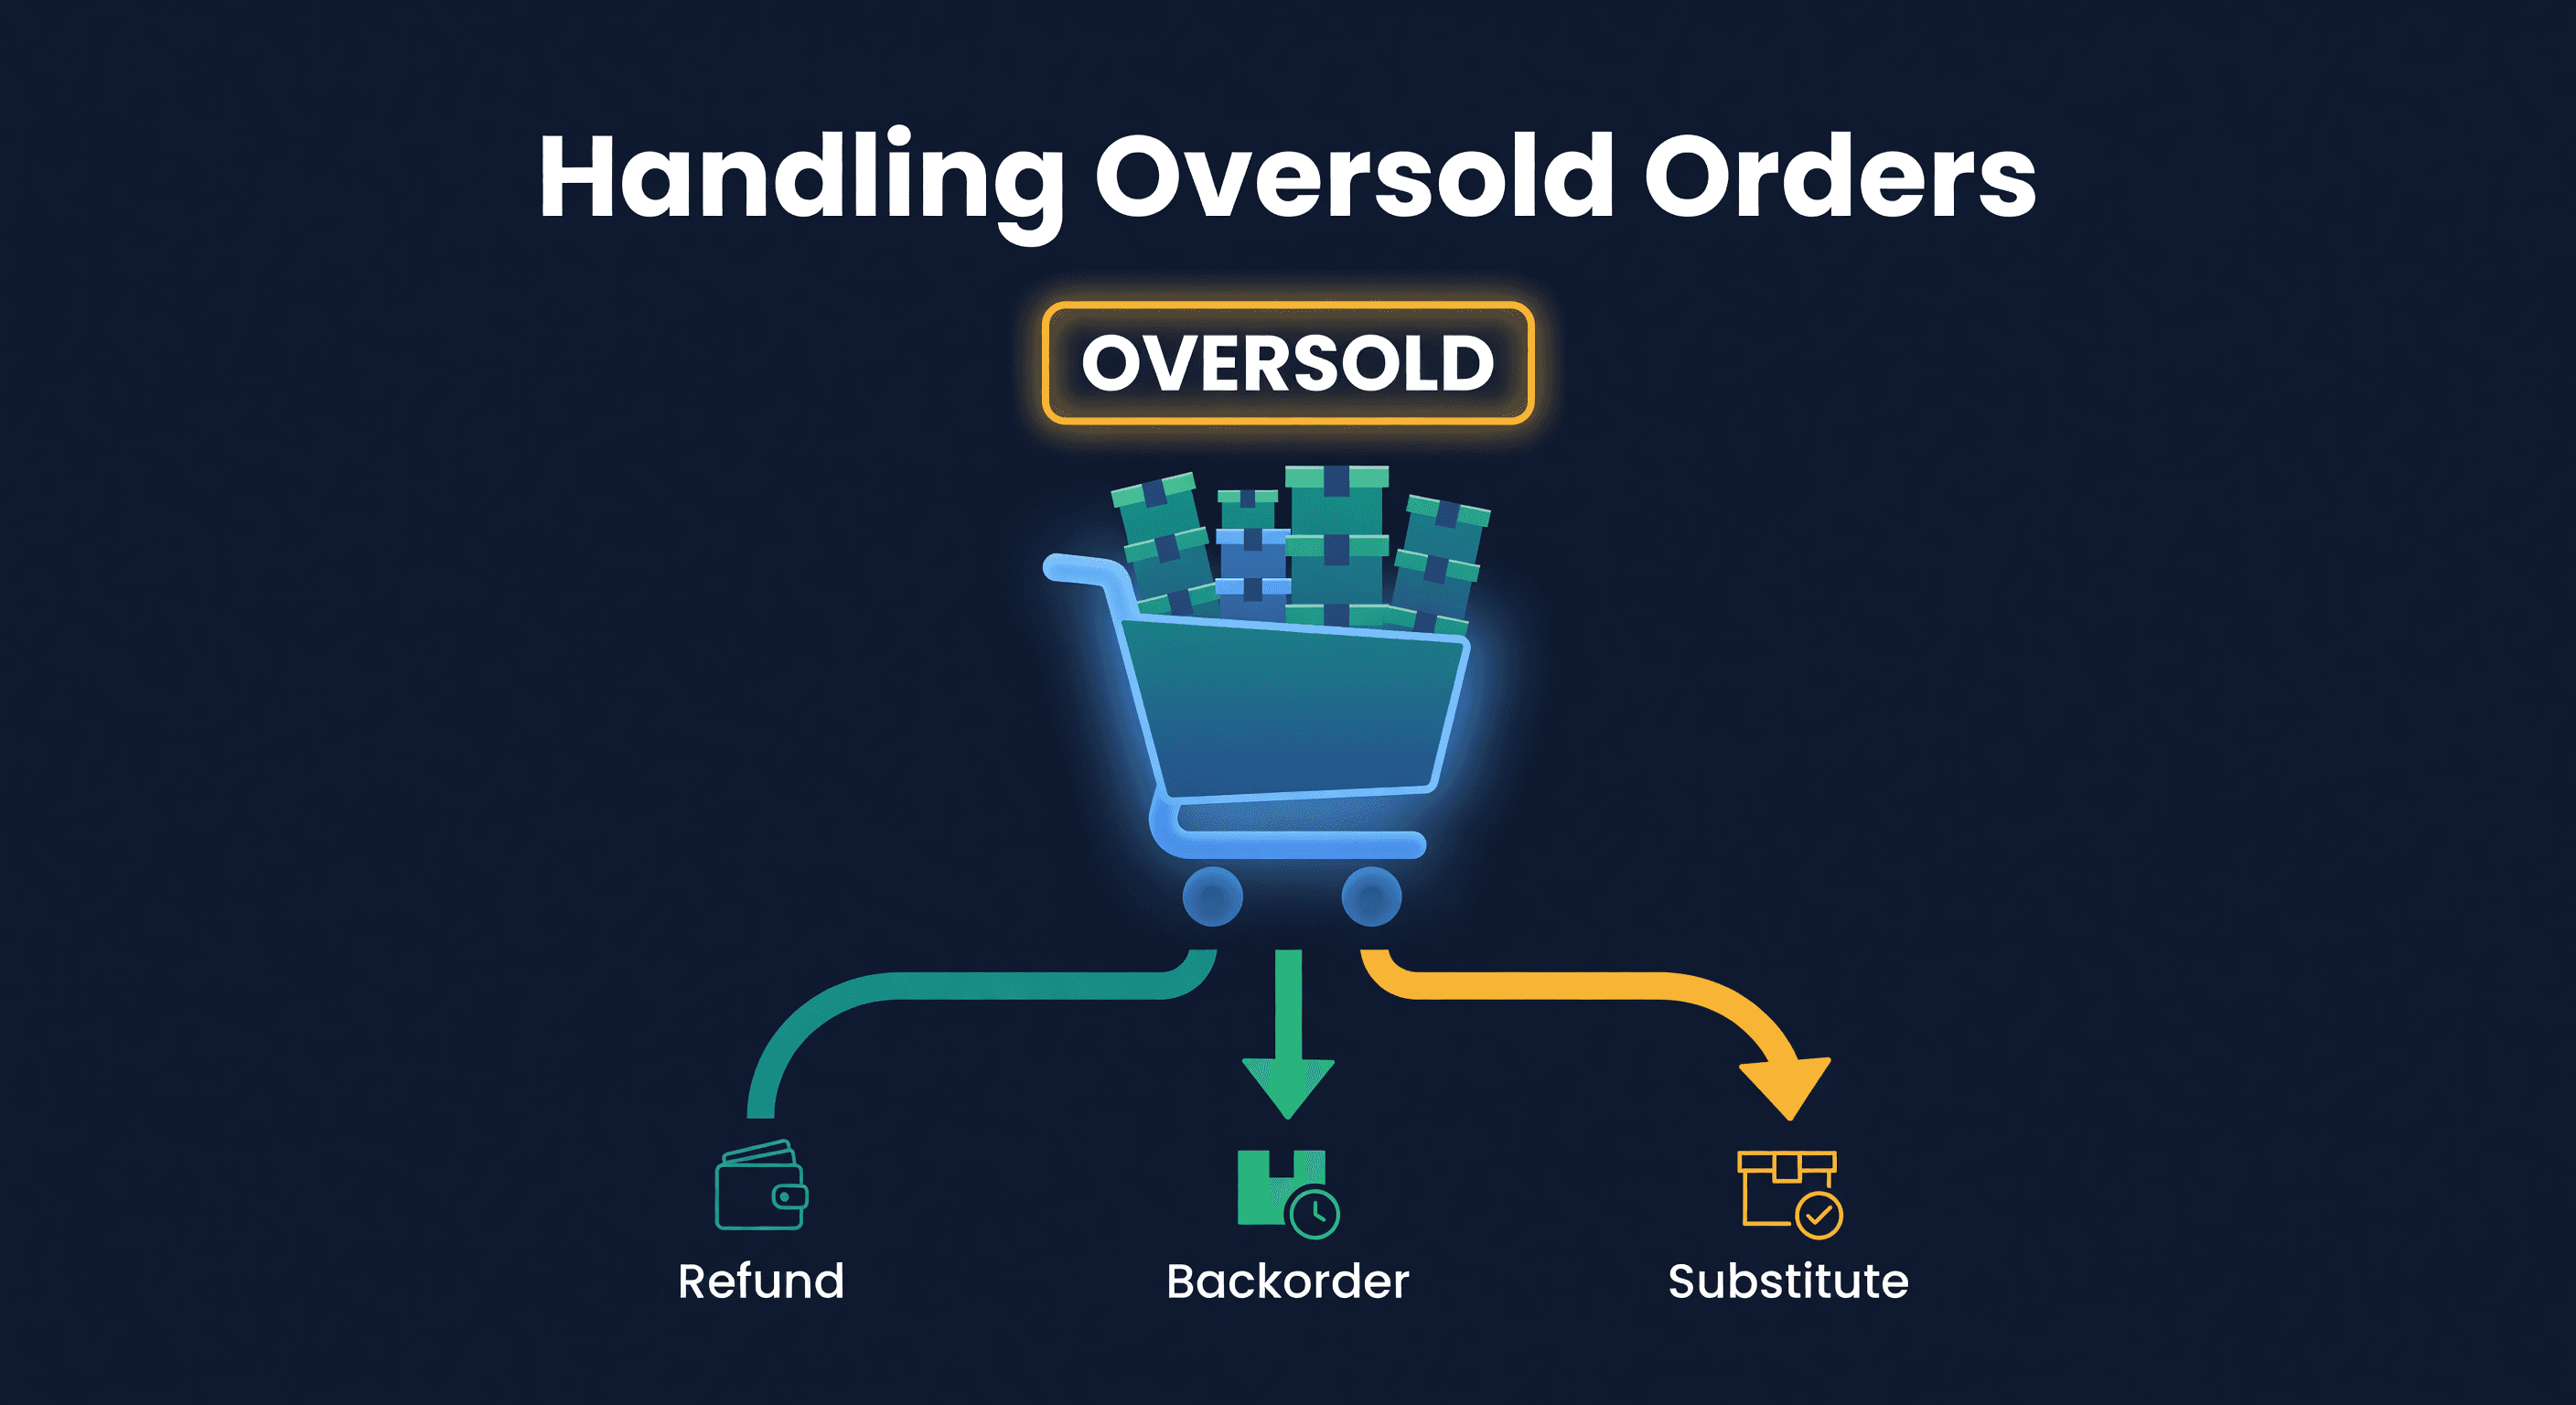
How to Handle Oversold Orders in E-commerce
Why overselling happens on multi-channel stores, what it costs you, and the prevention strategies that actually work, from buffer stock to real-time push sync.
Amazon Lost Inventory: How to Get Reimbursed
How to find lost or damaged FBA inventory, file reimbursement claims with Amazon, and stop leaving 1-3% of your FBA revenue on the table.
