Cash Conversion Cycle for E-commerce Sellers
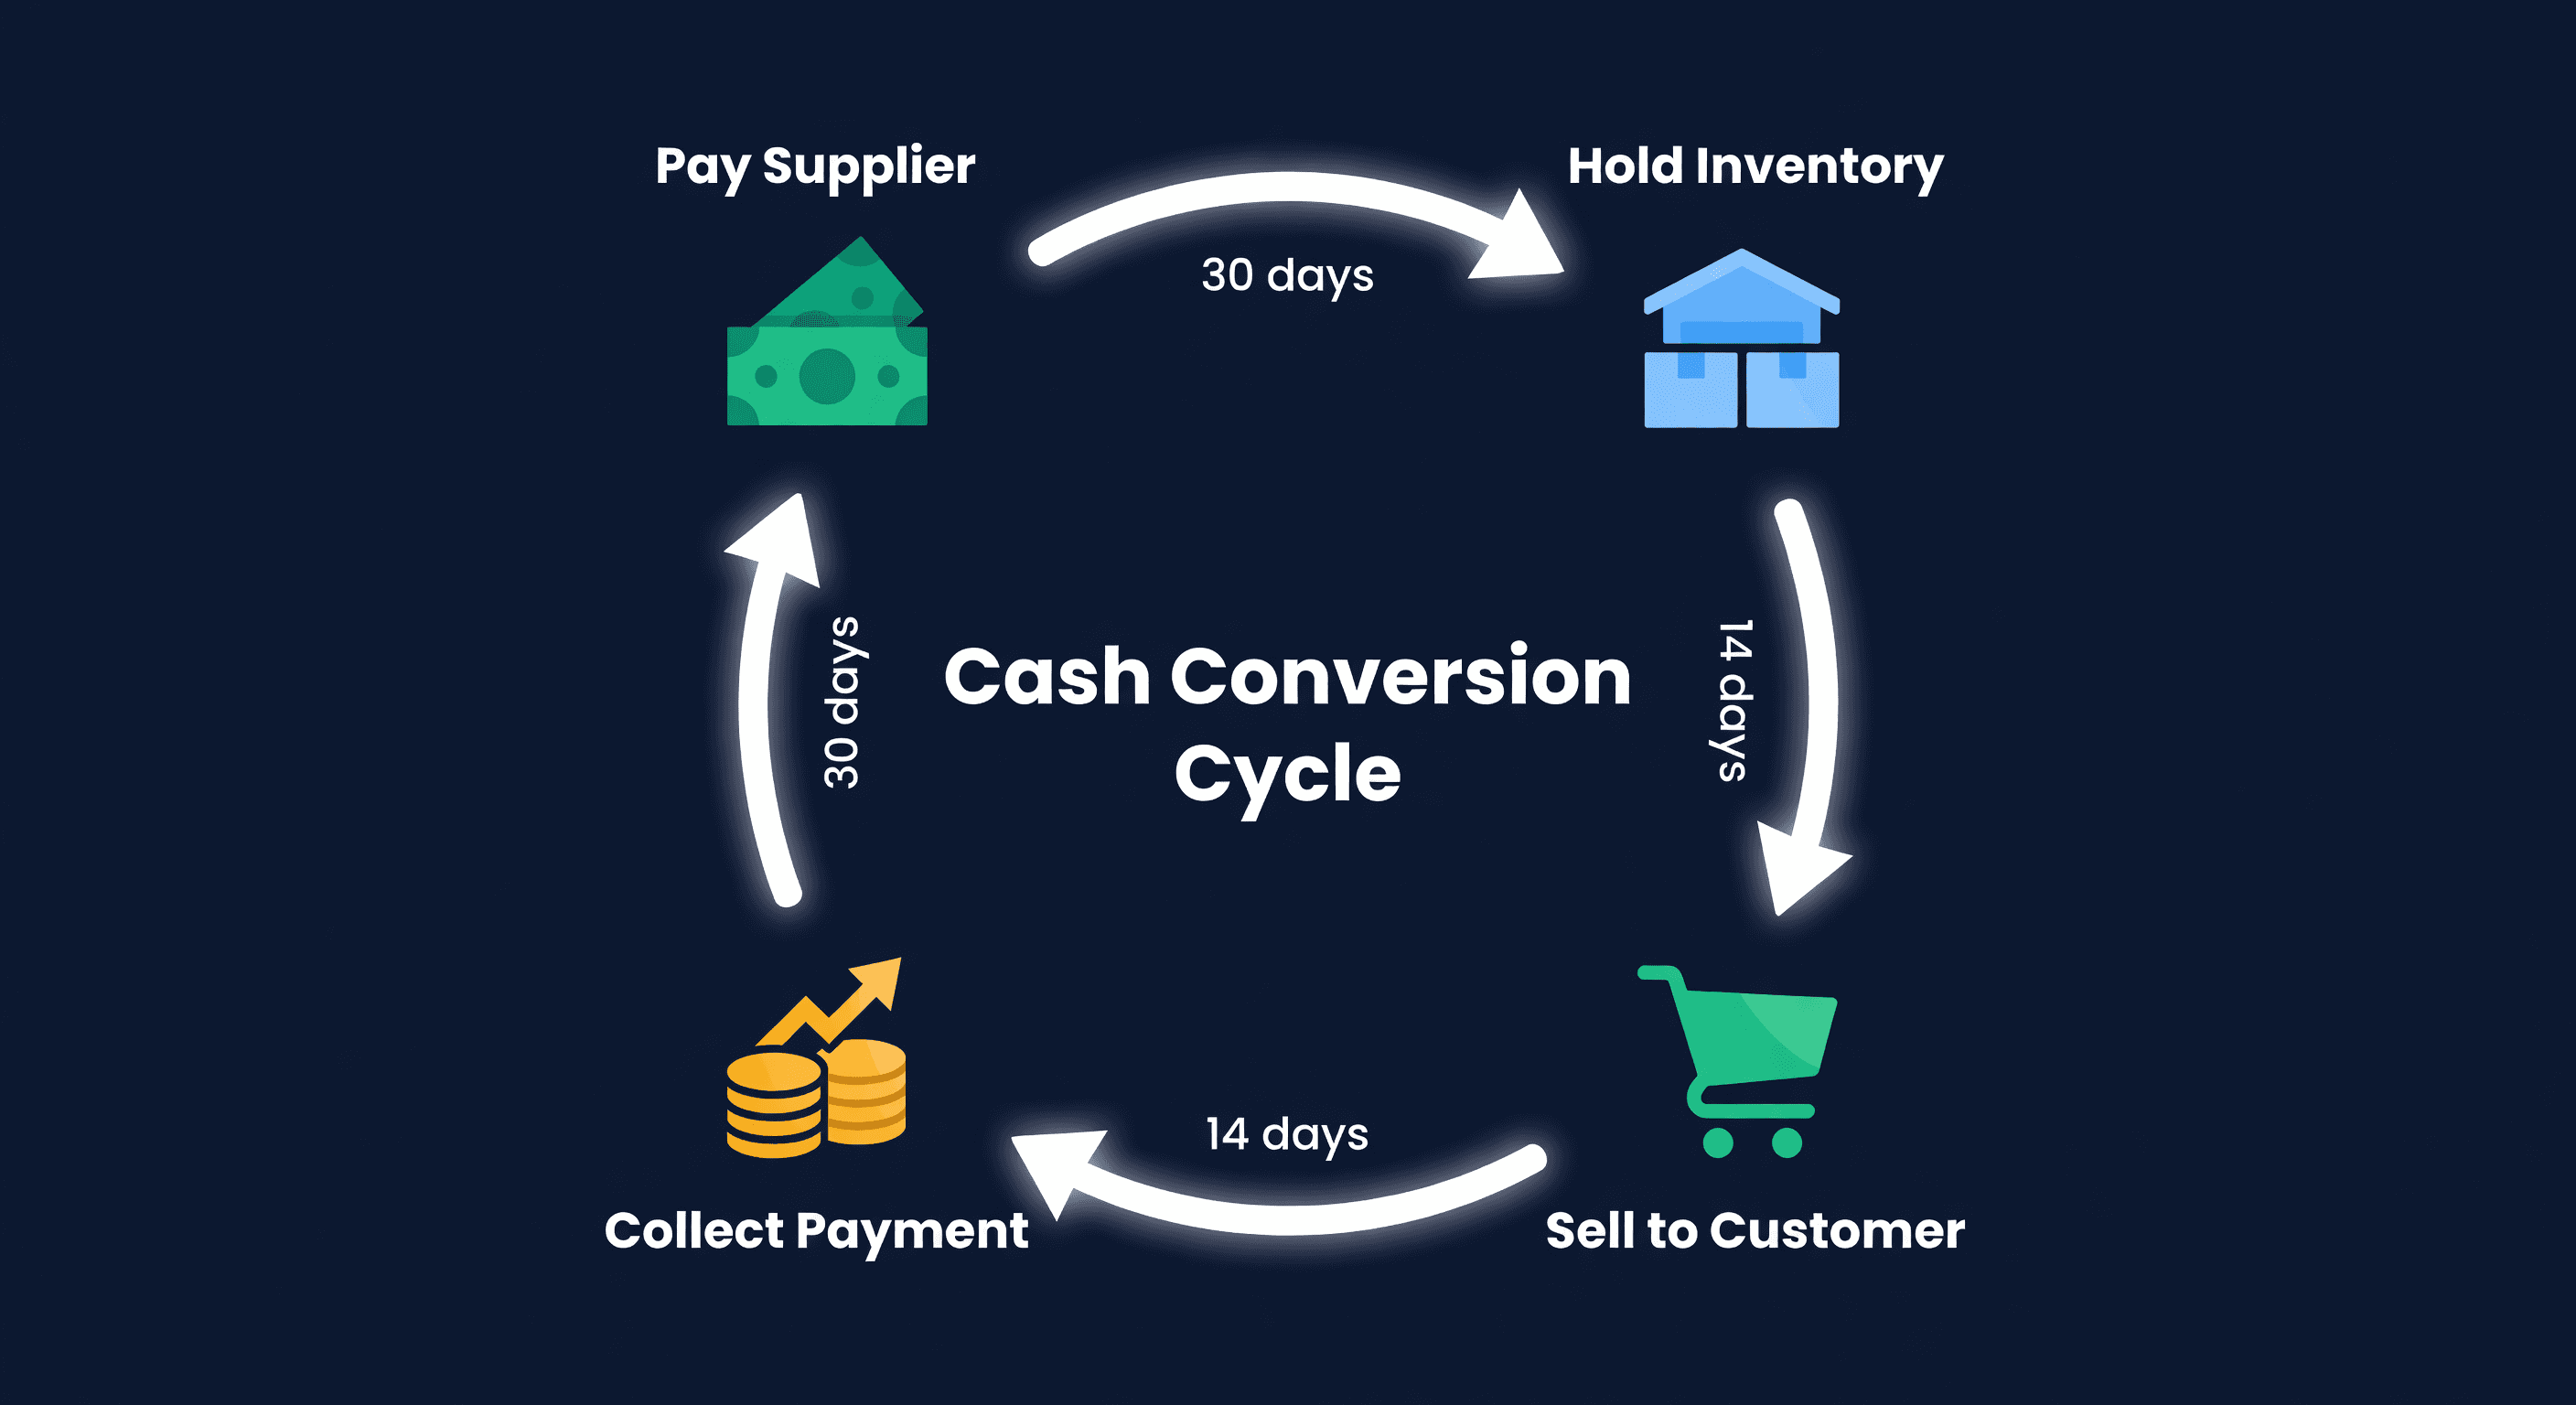
Key takeaway: Cash Conversion Cycle (DIO + DSO - DPO) measures how long capital is locked between paying suppliers and collecting customer revenue. Under 30 days is excellent for e-commerce; above 60 days means cash is bleeding out.
The first time I calculated my cash conversion cycle, I did not believe the number. Fifty-eight days. That meant nearly two months passed between the moment I paid my supplier and the moment that money came back as collected revenue. I was profitable on every order. I was also constantly broke.
CCC is the single best metric for understanding why a profitable e-commerce business can still run out of cash. Most sellers track gross margin religiously but never measure how long their cash is locked up between paying a supplier and collecting from a customer. Those are different problems. You can have 50% margins and still bounce a supplier payment if your CCC is 60+ days.
Here is how to calculate yours, what the number means, and how to shrink it.
The Formula
Cash Conversion Cycle = DIO + DSO - DPO
Three components. Each one measures a different leg of the cash journey.
DIO - Days Inventory Outstanding. How many days, on average, your inventory sits before it sells. High DIO means slow-moving stock tying up cash.
DSO - Days Sales Outstanding. How many days between making a sale and getting the money in your bank. This varies wildly by channel.
DPO - Days Payable Outstanding. How many days you wait before paying your supplier. Longer is better for your cash flow (worse for theirs).
The subtraction at the end is what makes this interesting. DPO works in your favor. Every extra day you delay payment to your supplier is a day your cash stays in your account.
A Worked Example
Let me walk through a real scenario. Say you run a Shopify + Amazon business doing $50,000/month in revenue with $20,000 in average inventory at cost.
Step 1: Calculate DIO
DIO = (Average Inventory / Cost of Goods Sold) x 365
Your average inventory (at cost) is $20,000. Your annual COGS is $25,000/month x 12 = $300,000.
DIO = ($20,000 / $300,000) x 365 = 24.3 days
That is actually pretty good. You turn your inventory about 15 times per year. If you want a deeper look at what this number should be, we wrote a full breakdown in our inventory turnover guide and built an inventory turnover calculator to run the math on your own numbers.
Step 2: Calculate DSO
DSO = (Accounts Receivable / Revenue) x 365
E-commerce DSO depends almost entirely on which platform pays you and how fast.
| Channel | Typical payout timing | Effective DSO |
|---|---|---|
| Shopify Payments | 1-3 business days | 2 days |
| PayPal | Instant to 1 day | 1 day |
| Amazon Seller | Every 14 days + reserve | 17-21 days |
| Wholesale / B2B | Net 30-60 terms | 30-60 days |
If 60% of your revenue is Amazon and 40% is Shopify, your blended DSO is roughly:
(0.60 x 19) + (0.40 x 2) = 11.4 + 0.8 = 12.2 days
Amazon's bi-weekly payout cycle is the biggest driver here. There is not much you can do about it - that is Amazon's policy. But knowing the number helps you plan.
Step 3: Calculate DPO
DPO = (Accounts Payable / COGS) x 365
If your average outstanding payables to suppliers are $12,500 and annual COGS is $300,000:
DPO = ($12,500 / $300,000) x 365 = 15.2 days
A DPO of 15 days means you pay suppliers about two weeks after receiving the invoice. That is typical for sellers on Net 15 or prepay-with-quick-turnaround terms.
Most small e-commerce sellers have a DPO problem. They pay on receipt or even prepay (wire transfer before production starts). A DPO of zero means your supplier gets paid before you have even listed the product. If this sounds familiar, your DPO is actively making your CCC worse. We will fix that in a moment.
Step 4: Put It Together
CCC = 24.3 + 12.2 - 15.2 = 21.3 days
Twenty-one days. Not bad. You pay your supplier, and 21 days later the cash cycle completes. For every dollar you spend on inventory, you wait three weeks to get it back.
That is a $35,000/month business with $35,000 of revenue locked up at any given time ($1,667/day x 21 days). Manageable. But watch what happens when any single component drifts.
What Good and Bad Look Like
| CCC range | What it means | Typical seller profile |
|---|---|---|
| Negative | You collect before you pay. Cash machine. | Long supplier terms (Net 60+), fast inventory turns |
| 0-20 days | Excellent. Tight inventory, fast payouts. | Shopify-heavy, domestic suppliers, low DIO |
| 21-40 days | Solid. Room to improve but not dangerous. | Mixed Amazon/Shopify, average inventory turns |
| 41-60 days | Warning zone. Cash is tight. | Amazon-heavy, some slow-moving stock, prepay suppliers |
| 60+ days | Danger. Profitable on paper, broke in practice. | Long lead times, high DIO, unfavorable payment terms |
That 58-day CCC I mentioned at the top? I was sitting on too much inventory (DIO of 42 days), selling mostly on Amazon (DSO of 19 days), and paying suppliers on Net 7 terms because I never thought to negotiate (DPO of 3 days). Every one of those numbers was fixable.
One thing to notice: DIO is usually the biggest component for e-commerce sellers. DSO is largely outside your control (Amazon pays when Amazon pays), and DPO depends on your supplier relationships. But DIO? That is your inventory decisions in a single number. If you want to see DIO at the SKU level, the days of supply calculator gives you the per-product view that a single DIO number hides. A seller with a lean catalog of fast-moving SKUs might have a DIO of 15. A seller hoarding slow movers could sit at 60+. Same revenue, completely different cash position.
Five Ways to Shorten Your CCC
Not all of these are equal. I am ranking them by impact for a typical e-commerce seller.
1. Cut DIO by liquidating slow movers. This is the biggest lever for most sellers. Run an ABC analysis on your catalog. Your C items - the bottom 50% by revenue - are probably dragging your DIO up by 10-20 days. Liquidate them, stop reordering them, or move them to a marketplace where they will sell. I cut my DIO from 42 to 26 days by clearing out 87 SKUs that were selling fewer than 3 units per month.
2. Negotiate longer payment terms. Going from Net 7 to Net 30 adds 23 days to your DPO, which subtracts 23 days from your CCC. That is the single largest one-line improvement you can make. Most suppliers will agree to Net 30 if you have an established relationship and consistent order volume. Some will do Net 45 or Net 60. Ask. The worst they say is no.
3. Order smaller quantities more often. A $10,000 order every 60 days means you are carrying 60 days of inventory. Two $5,000 orders 30 days apart means you carry 30 days. Same total spend, half the DIO. This only works if your supplier does not have high minimum order quantities and the freight cost per unit does not spike on smaller shipments. For domestic suppliers, it almost always works. For overseas suppliers, the MOQ and casepack math gets trickier.
4. Speed up fulfillment. The faster you ship after a sale, the sooner the payout clock starts (especially on Amazon, where payouts are tied to delivery confirmation). Sellers using FBA already have this handled. Merchant-fulfilled sellers who ship within 24 hours instead of 48-72 hours can shave 1-3 days off their DSO.
5. Diversify your channel mix. Every dollar you move from Amazon (19-day DSO) to Shopify (2-day DSO) shaves 17 days off the DSO for that revenue. I am not saying abandon Amazon. I am saying that building a Shopify channel is a working capital strategy, not just a sales strategy.
A seller doing $30,000/month on Amazon has about $19,000 always in transit (DSO of 19 days x $1,000/day). If they shift $10,000/month to Shopify, the blended DSO drops from 19 to about 13 days. That frees up roughly $6,000 in cash. Not life-changing for a $30K/month business, but combined with a DIO improvement and better payment terms, the cumulative effect is real.
Tracking CCC Over Time
Calculating CCC once is a snapshot. Tracking it monthly is where the value shows up. I keep a simple table:
| Month | DIO | DSO | DPO | CCC | Notes |
|---|---|---|---|---|---|
| Jan | 28 | 14 | 18 | 24 | Normal |
| Feb | 31 | 14 | 18 | 27 | Slow Jan sales inflated DIO |
| Mar | 25 | 13 | 22 | 16 | Negotiated Net 30 with top supplier |
| Apr | 22 | 12 | 22 | 12 | Cleared dead stock, Shopify revenue up |
The trend matters more than any single number. If DIO is creeping up, you are accumulating inventory faster than you are selling it. If DPO is shrinking, you are paying suppliers faster (which might mean you lost a payment term or your order cadence changed).
Doing this manually means pulling inventory snapshots, revenue data, and payables data every month, then running the formulas. It takes 2-3 hours if your data is clean, longer if you are reconciling across Amazon, Shopify, and your supplier invoices. ReplenishRadar tracks days of supply per SKU and inventory turnover on every sync, which gives you the DIO component automatically. That is the hardest piece to get right because it requires current stock levels matched against actual sales velocity - exactly the kind of thing that goes stale in a spreadsheet within a week.
See how ReplenishRadar tracks your inventory metrics ->
The Number That Sticks
Every day of CCC represents one day's worth of revenue locked up in the cycle. If your business does $50,000/month in revenue - roughly $1,667/day - then a CCC of 40 days means $66,680 of your cash is always in transit. Shorten that to 20 days and you free up $33,340. That is not theoretical money. That is cash you can use for your next purchase order or a product launch or just breathing room when a supplier invoice lands.
Related Reading:
Frequently Asked Questions
Get notified when it matters
Amazon and Shopify change the rules constantly. We'll email you when something affects your business.
See what your inventory is really doing
Doing $5M+ in revenue? Talk to our team
Related Posts
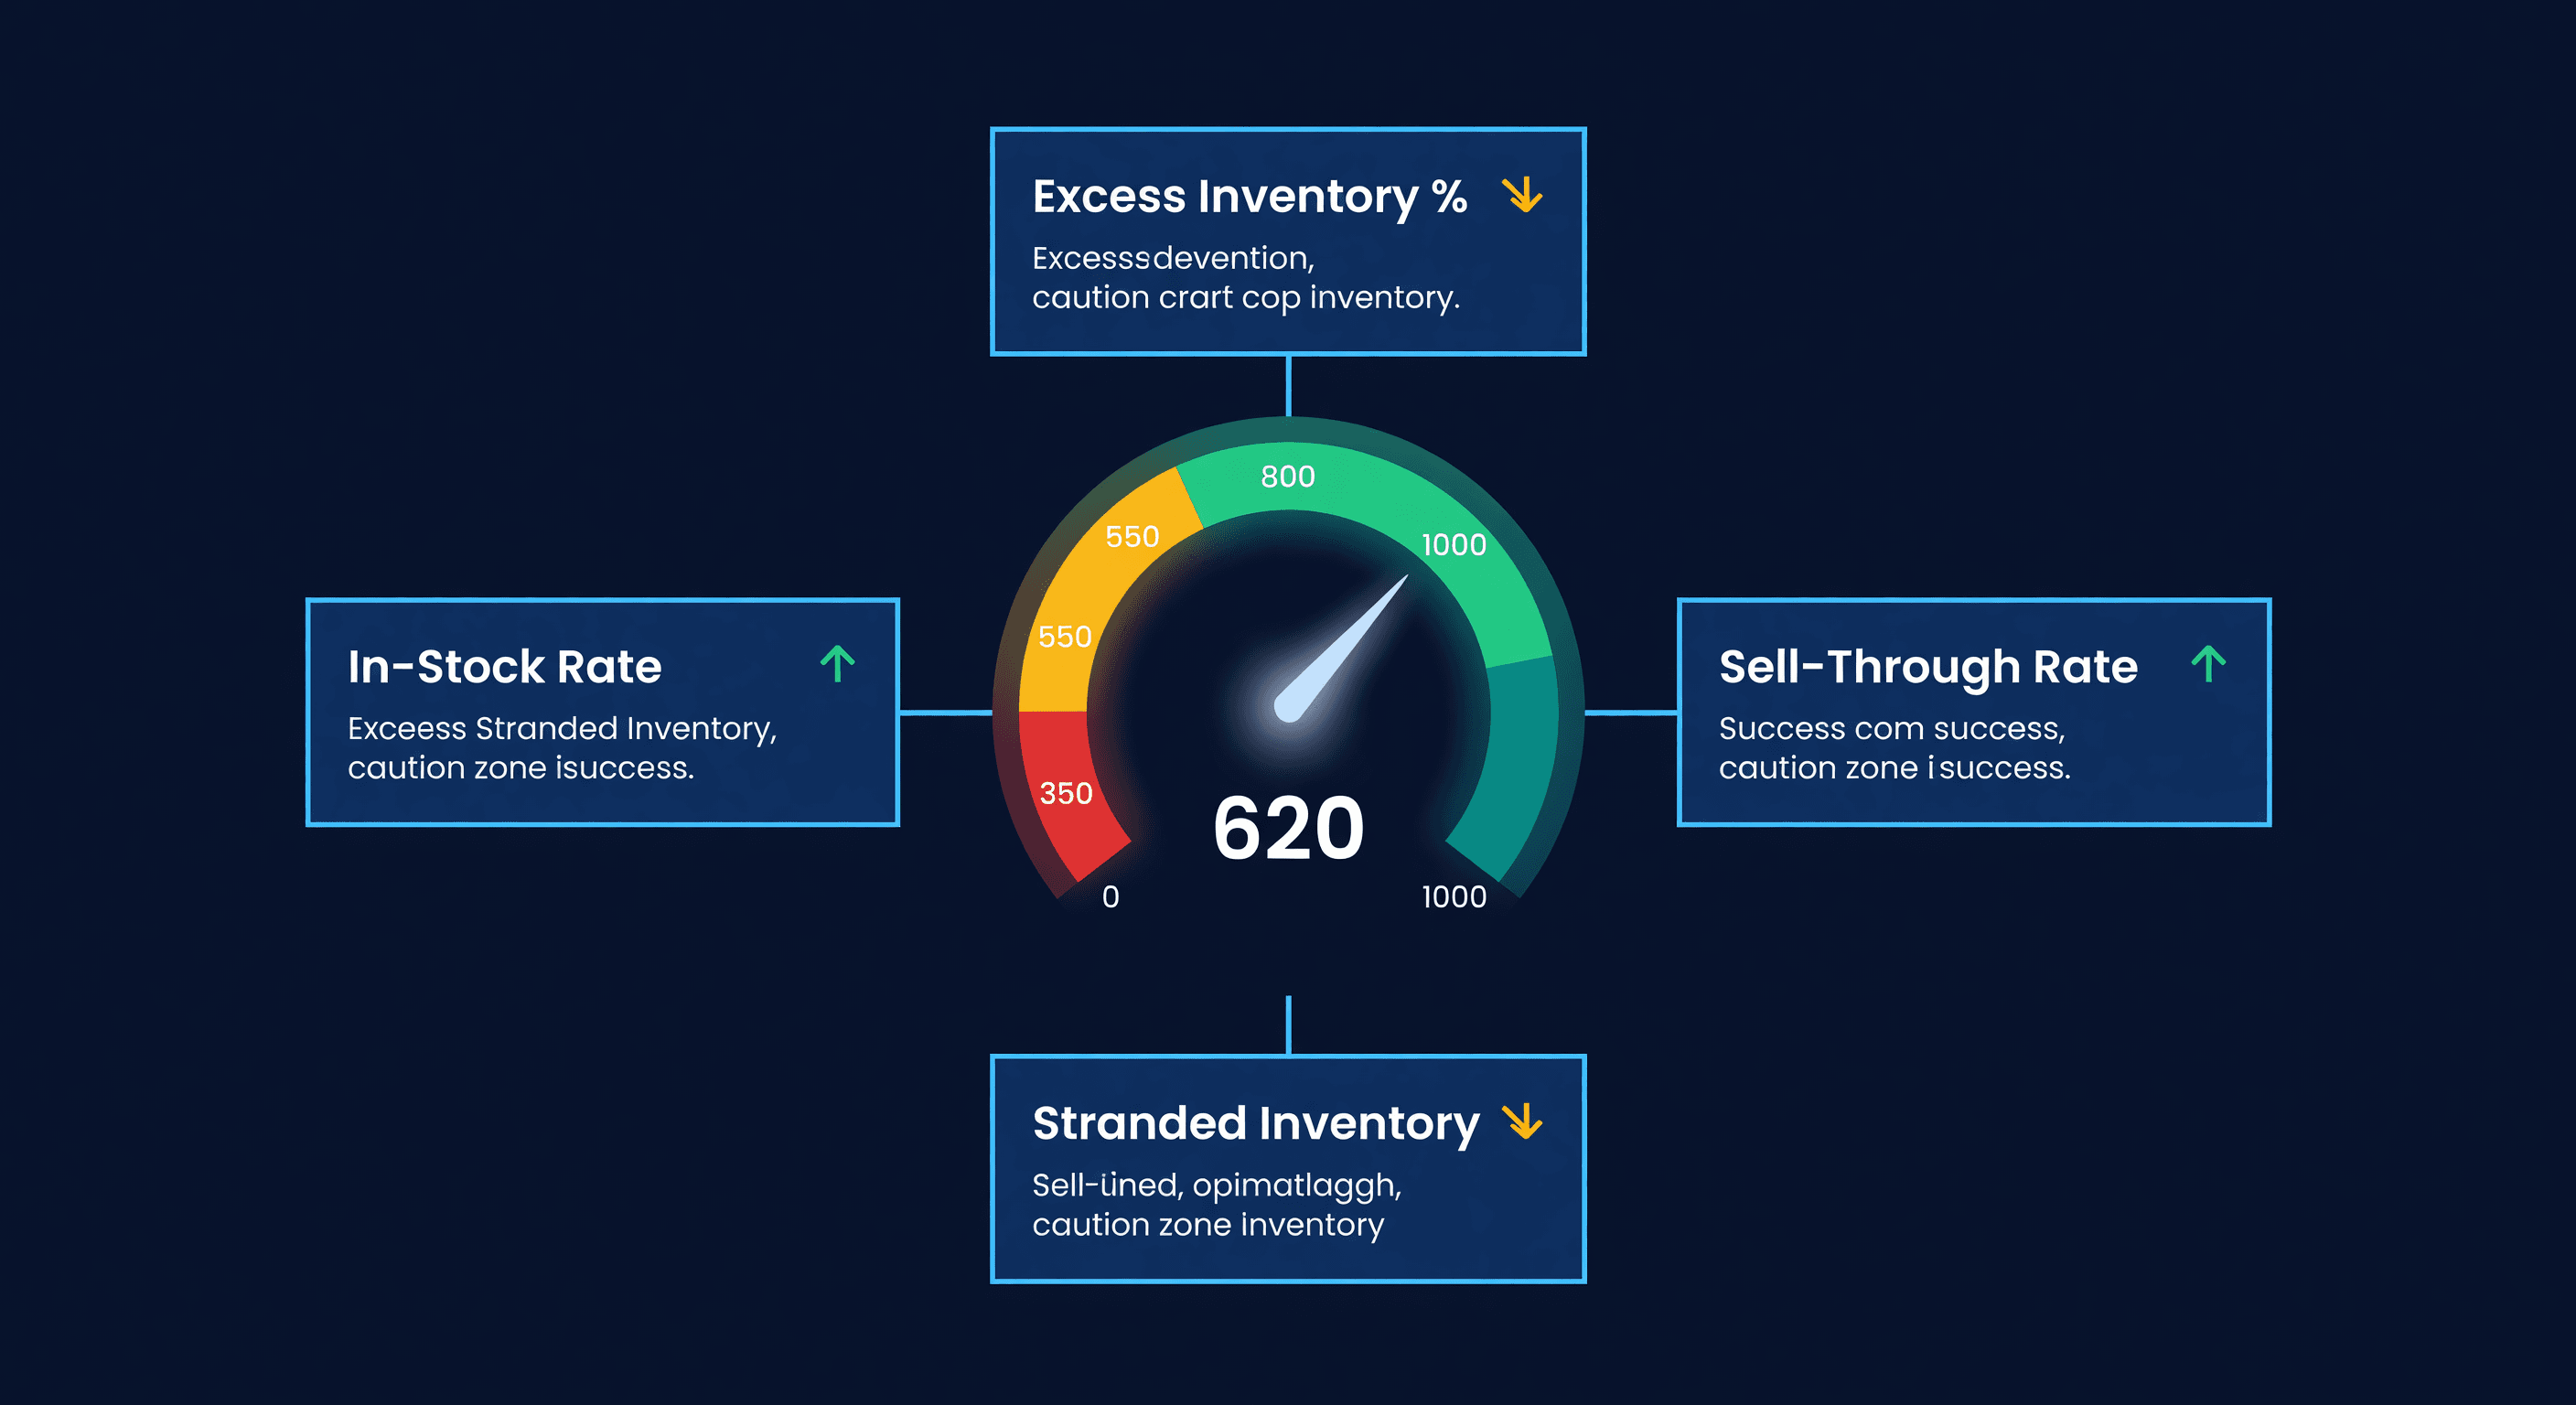
Amazon IPI Score: What It Is and How to Fix It
Your Amazon IPI score controls your FBA storage limits. Learn what the 4 factors actually measure, the score thresholds, and how to improve each one.
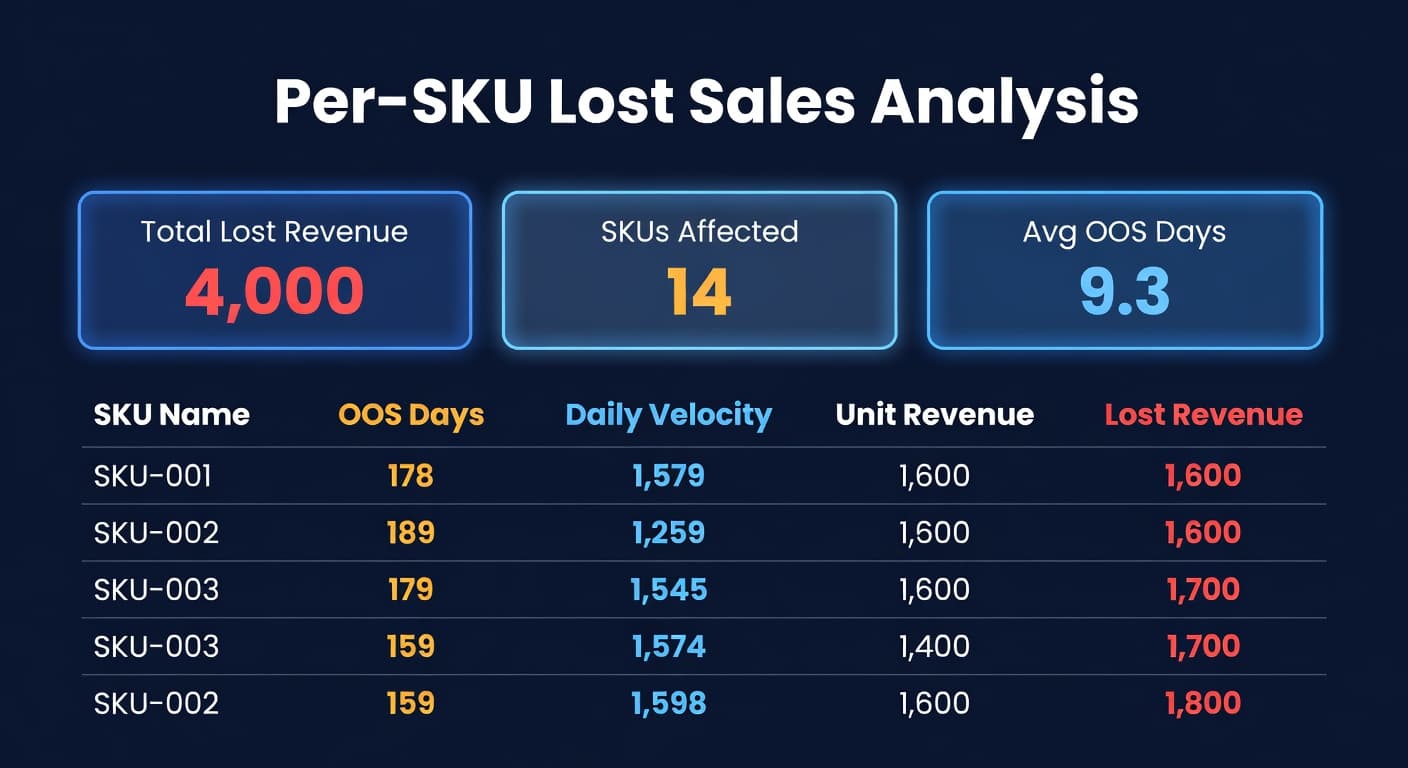
What Your Stockouts Actually Cost (Per-SKU)
Most sellers track what sold but not what didn't. Per-SKU lost sales analysis reveals the exact revenue each stockout costs.
Inventory Turnover Ratio: Formula, Benchmarks, and Fixes
How to calculate inventory turnover ratio with real examples. Industry benchmarks and specific strategies to improve turns and free up cash flow.
