Why Your Safety Stock Should Vary by Vendor
Your best vendor and your worst vendor should not get the same safety stock treatment. That is like buying the same insurance policy for a brick house and a tent.
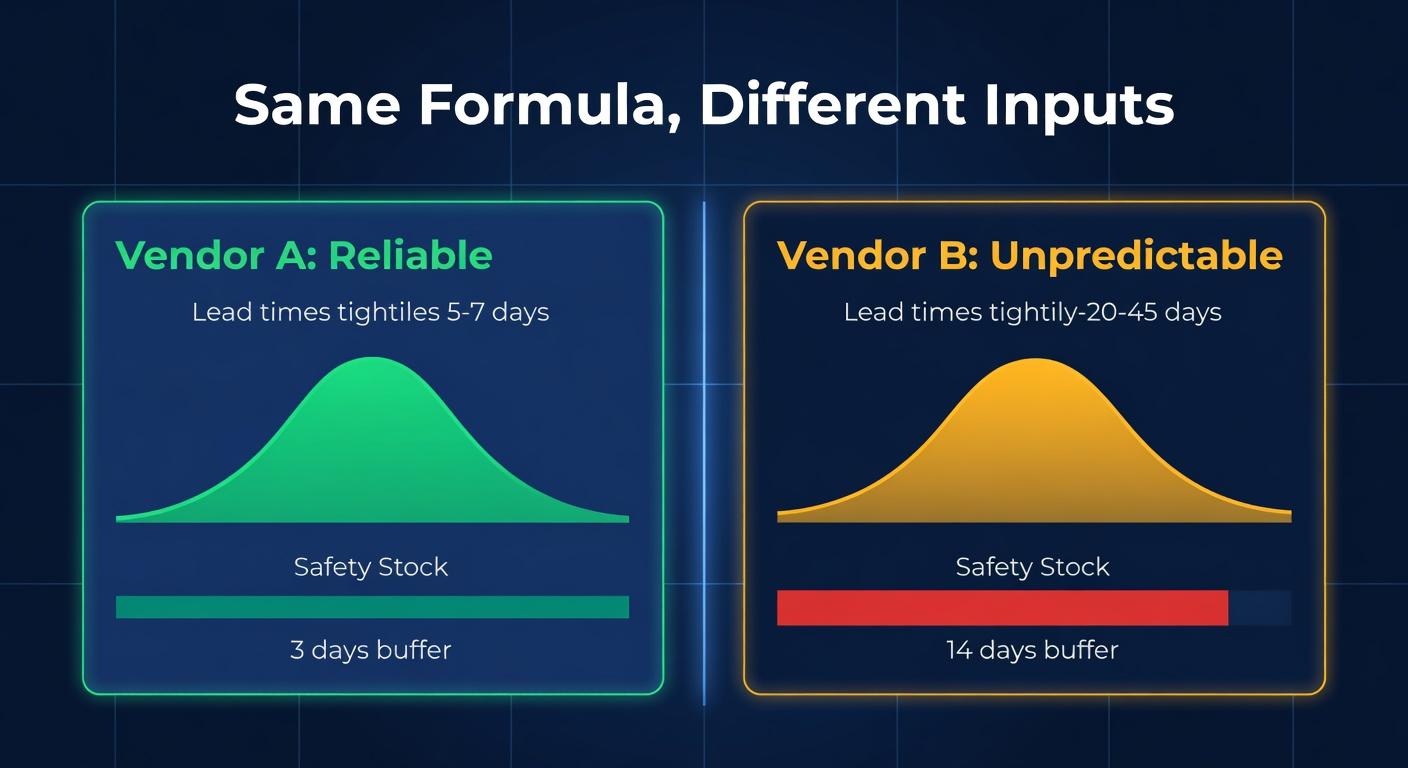
But that is what most inventory tools do. One safety stock formula. One set of inputs. Applied identically to every SKU regardless of which supplier fulfills it. The domestic supplier who delivers in 5-7 days like clockwork gets the same buffer calculation as the overseas factory that quotes 30 days and actually takes anywhere from 25 to 45.
The reliable vendor's SKUs end up holding buffer against delays that never happen, and that buffer is cash sitting on a shelf. In the worked example below it comes to $48,000 for a single supplier. And the frustrating part is that the math to fix it is not complicated. The problem is that most tools do not track the data needed to make it work.
The Formula Most Tools Use
The textbook safety stock formula looks like this:
Safety Stock = Z x sqrt(LT x sigma_D^2 + D_avg^2 x sigma_LT^2)
Where:
- Z = service level factor (1.65 for 95% in-stock target)
- LT = average lead time in days
- sigma_D = standard deviation of daily demand
- D_avg = average daily demand
- sigma_LT = standard deviation of lead time
Two variables in that formula are demand-related. Two are lead-time-related. Many inventory planning tools plug in the demand numbers automatically from sales history. Fine. But the lead time numbers? Those come from a single field you typed into a settings page six months ago.
Static. Unchanged. Wrong.
What Goes Wrong With Flat Lead Times
Here is a worked scenario. You sell kitchen products. You have two suppliers.
Vendor A: domestic distributor. Quoted lead time: 7 days. Actual lead times from your last 10 POs: 6, 7, 7, 6, 8, 7, 7, 6, 7, 8.
Vendor B: overseas manufacturer. Quoted lead time: 30 days. Actual lead times from your last 10 POs: 28, 35, 42, 31, 26, 38, 29, 45, 33, 27.
Same formula. Wildly different inputs.
| Metric | Vendor A | Vendor B |
|---|---|---|
| Average lead time | 6.9 days | 33.4 days |
| Lead time std dev | 0.7 days | 6.2 days |
| Quoted lead time | 7 days | 30 days |
| OTD% (within quoted window) | 80% | 40% |
If your tool uses the quoted lead time with no variance data, it calculates the same type of safety stock buffer for both. Maybe 10 days of supply as a default. That is fine for Vendor B, maybe even tight. But for Vendor A, 10 days of supply is absurd. The vendor has not been more than a day late on any of its last 10 POs.
The Dollar Cost of Treating Them the Same
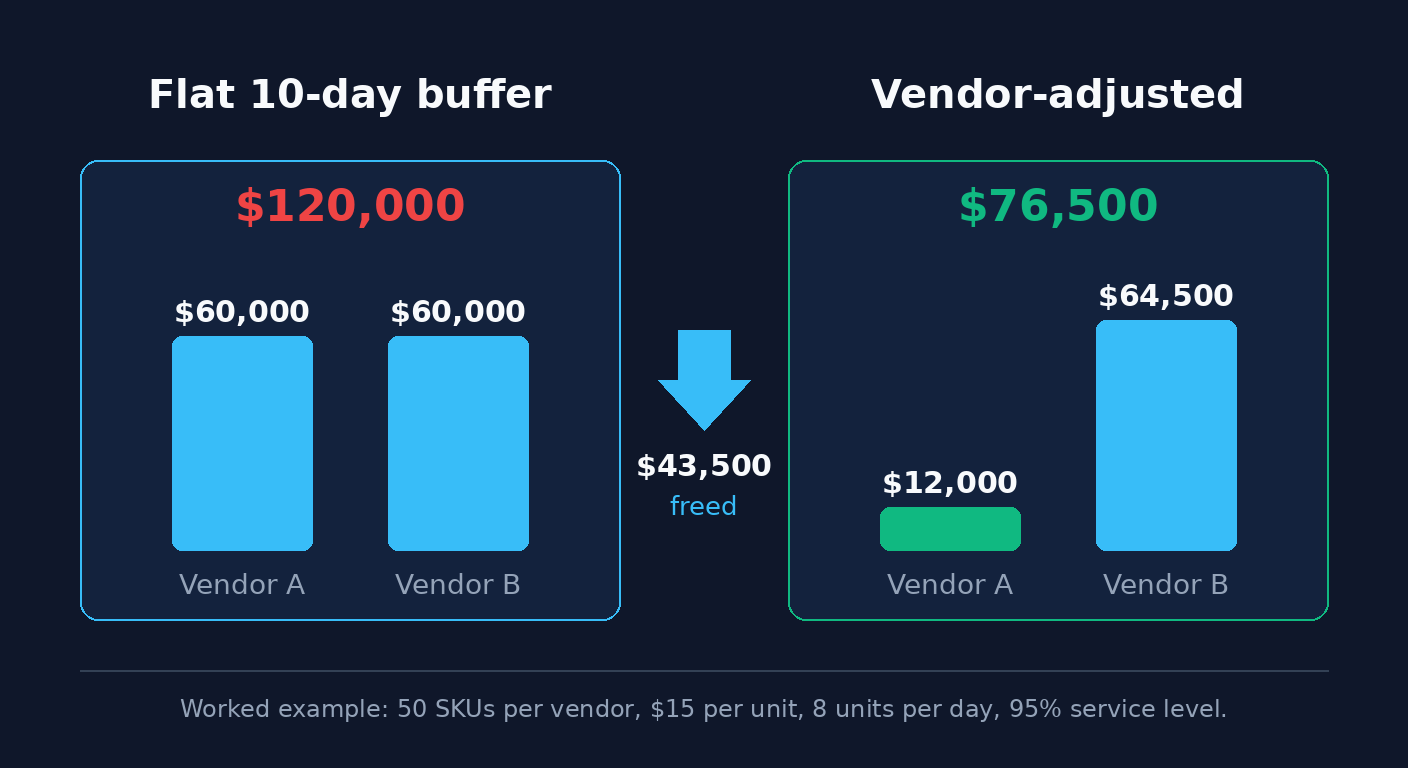
Illustrative assumptions: you carry 50 SKUs from Vendor A and 50 from Vendor B. Average cost per unit is $15. Average daily demand per SKU is 8 units. Every figure in this section is computed from those inputs and the lead times above, not measured from a real catalog.
With a flat 10-day safety stock buffer across the board:
| Vendor A SKUs | Vendor B SKUs | Total | |
|---|---|---|---|
| Safety stock units per SKU | 80 | 80 | - |
| Total safety stock units | 4,000 | 4,000 | 8,000 |
| Capital locked in safety stock | $60,000 | $60,000 | $120,000 |
Now recalculate with actual lead time variance using the formula above (Z = 1.65, sigma_D = 3 units/day):
| Vendor A SKUs | Vendor B SKUs | |
|---|---|---|
| sigma_LT | 0.7 days | 6.2 days |
| Safety stock per SKU | 16 units | 86 units |
| Total safety stock units | 800 | 4,300 |
| Capital locked | $12,000 | $64,500 |
Vendor A's correct safety stock: $12,000. The flat calculation had $60,000 tied up. That is $48,000 sitting in a warehouse doing nothing because the tool cannot tell the difference between a reliable vendor and an unreliable one.
Vendor B's safety stock actually goes up slightly, from $60,000 to $64,500, because the real variance is worse than the flat assumption. But that increase is justified. You need that buffer.
Net effect: $120,000 drops to $76,500. That frees $43,500 in working capital at the same 95% service level. For a seller running $200K in total inventory, that is more than a fifth of the capital.
The Three Metrics That Matter
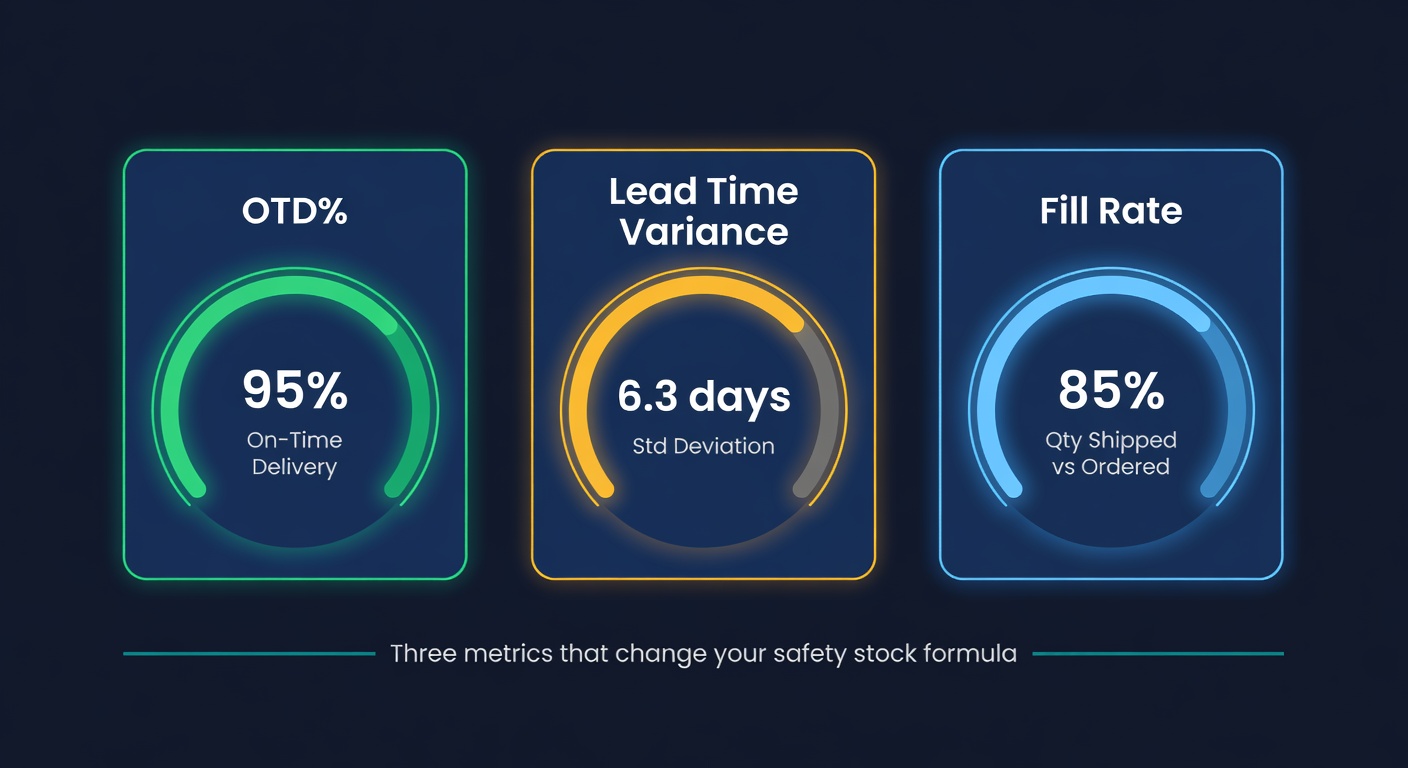
Not all vendor reliability data is equally useful for safety stock. Here is what actually moves the needle.
Lead time standard deviation
This is the big one. It feeds directly into the safety stock formula. A vendor with a 2-day standard deviation needs a fraction of the buffer that a vendor with a 10-day standard deviation needs. And I mean actual measured standard deviation, not "they said 30 days and I believe them."
You need at least 8-10 POs worth of data to get a meaningful number. Less than that and random variation dominates.
On-time delivery percentage
OTD% answers a simple question: what fraction of orders arrived within the quoted lead time window? An OTD of 95% means the vendor is consistent and your lead time estimates are trustworthy. An OTD of 60% means you are guessing.
OTD% works best as a warning signal, not just a formula input. If a vendor's OTD drops below 80%, stop trusting the quoted lead time and switch to actuals. Below 80%, more than one order in five misses the quoted window, and the quote has stopped describing the vendor.
Fill rate
Did the vendor ship what you ordered? A vendor who delivers on time but only ships 70% of the requested quantity is not really on time. You are short 30% of your expected inventory, and your safety stock has to cover that gap too.
Fill rate does not appear in the standard safety stock formula, but it should factor into your demand-during-lead-time calculation. If you order 500 units and historically receive 400, your effective demand coverage is different than planned.
Static Lead Times Are the Default Everywhere
Here is the test: open your inventory tool. Go to a supplier's settings. Can you see actual delivery performance data: average lead time from POs, standard deviation, OTD percentage? Or is there just a single "Lead Time (days)" field?
If it is a single field, your safety stock is based on whatever number someone typed in there. Maybe it was accurate when they set it. Maybe the vendor has gotten worse since then. Maybe better. You have no idea because the tool is not watching.
This is a common default in mid-market inventory tools: one field, one number, no learning.
Some tools let you update that number manually. Great. So now the process is: pull your PO history into a spreadsheet, calculate average delivery times per vendor, compare to the number in the tool, update it, and repeat every quarter. For every supplier. Say you have 15 suppliers: that is a full day of work, four times a year, and it is easy to skip after the first time.
What Lead Time Learning Actually Means
The alternative to static lead times is a system that tracks delivery performance from your actual purchase order history. Every time you receive a PO, the system records the actual lead time, not the quoted one. Over time, it builds a statistical profile for each vendor.
That profile includes the average, the variance, and the trend. Is this vendor getting slower? Getting more erratic? The data is already in your PO history. The question is whether your tool reads it.
When the system has that data, safety stock stops being a guess. It becomes a calculation that reflects reality. Your reliable domestic vendor gets a tight buffer. Your unpredictable overseas manufacturer gets a wide one. And when the overseas manufacturer starts improving (shipping consistently in 32-34 days instead of the previous 25-45 spread), the buffer shrinks automatically. You do not have to remember to check.
What Happens When a Good Vendor Goes Bad
The flip side matters too. A vendor with a 95% OTD might slip to 75% over two quarters. Maybe they changed logistics partners. Maybe they are having capacity issues. If your lead time data is a static number from last year, you will not notice until you stockout.
An illustrative scenario, not a real account. Picture a supplier who has been rock-solid for 18 months. Then they switch shipping carriers. Lead times go from a tight 12-14 day window to a sloppy 10-22 day range. The lead time field still says 14 days, so the safety stock is still sized for a 2-day spread when the real one is 12. Nothing flags it until the first stockout sends someone digging through the PO data.
Every one of those stockouts was preventable with data already sitting in the PO history.
Tracking This in ReplenishRadar
The manual version of this analysis is a quarterly chore for every supplier you buy from. Pull PO dates, calculate averages and standard deviations, compare to what is in the system, update the fields, and pray you did not fat-finger a cell reference.
We built ReplenishRadar to track actual delivery performance on every closed PO. The supplier scorecard shows OTD%, average lead time vs. quoted, and variance trends per vendor. When the measured numbers drift, downstream calculations, safety stock included, adjust to match. You do not have to build the spreadsheet or remember to run it quarterly.
That is the difference between a system that remembers what you told it and a system that watches what actually happens.
What to Do Right Now
If you are not ready to switch tools, you can still improve your safety stock accuracy with a spreadsheet. Pull the last 10 PO receipt dates per vendor. Calculate the standard deviation. Plug it into the safety stock formula above. Compare the result to what your tool currently recommends.
At least one of your vendors will very likely show a dramatic difference. The reliable one will need far less buffer. The unreliable one might need more. Both of those are improvements: one saves capital, the other prevents stockouts.
Do the math for your top 5 suppliers by spend. If the total difference exceeds $10,000 in safety stock, that is real money sitting in inventory because your tool cannot tell your vendors apart.
If you are tired of doing that math manually, ReplenishRadar's demand forecasting engine factors in per-vendor lead time data automatically, and the safety stock calculator lets you run the statistical formula against your own numbers. Fourteen-day free trial. The supplier scorecard alone might pay for the first month.
Related Reading:
Frequently Asked Questions
Get notified when it matters
Amazon and Shopify change the rules constantly. We'll email you when something affects your business.
See what your inventory is really doing
Doing $5M+ in revenue? Talk to our team
Related Posts
Chinese New Year Supply Chain Planning Guide
How to plan inventory around Chinese New Year factory shutdowns. Timelines, buffer calculations, and the mistakes that leave sellers out of stock for 6 weeks.

Supplier Lead Time: How to Track, Reduce, and Plan Around It
Lead time drives every reorder decision. Learn how to measure it, reduce it, and build it into your inventory planning so you stop running out of stock.
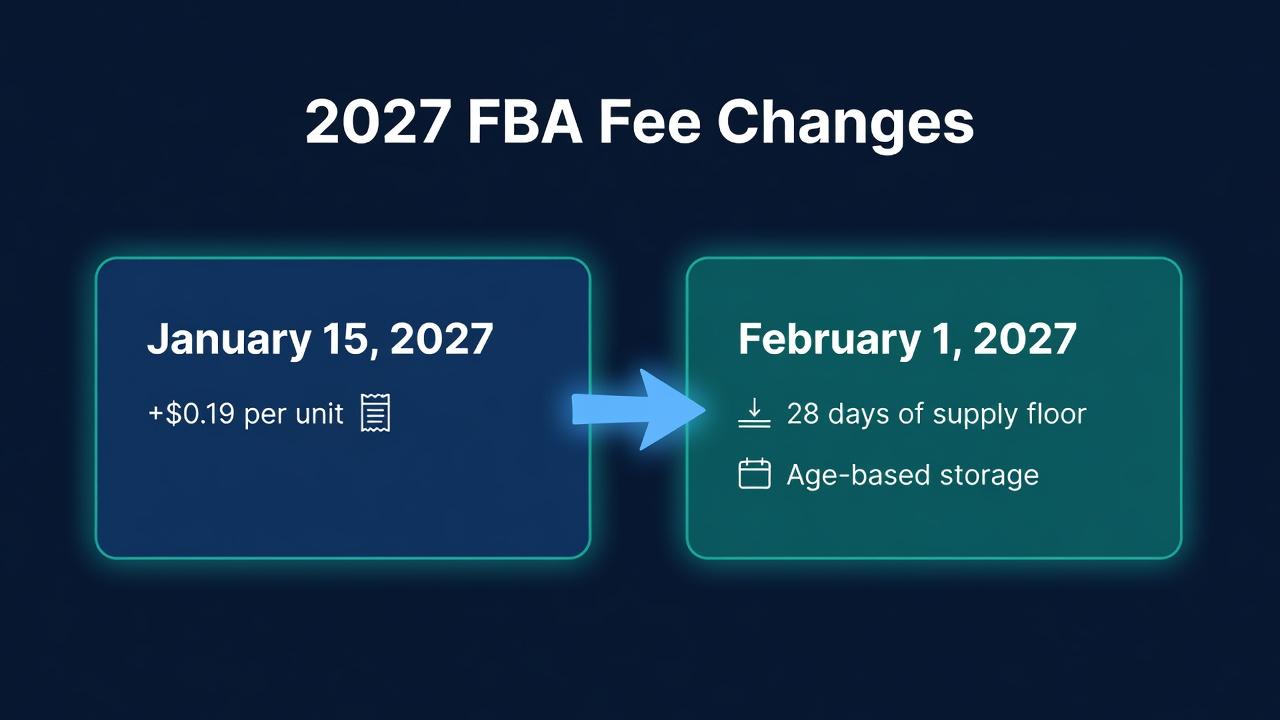
Amazon's 2027 FBA Fee Changes: 28 Days Is the Floor
Amazon's 2027 FBA fee changes: +$0.19 a unit from January 15, then a 28-day low-inventory floor and age-based storage from February 1. How to plan for both.
